Unlike traditional financial markets, where investors' behavior remains hidden, blockchain technology uniquely allows analysts to pinpoint the type of investors who are buying or selling at specific stages of a token's lifecycle and price. Supply Mapping is a new on-chain tool designed to classify token supply based on such investor behavior, offering a new, deeper, and more nuanced understanding of market dynamics.
It builds on the foundation of Cost Basis Distribution (CBD), which maps token supply across price levels – showing where supply is concentrated. However, CBD doesn’t reveal who is buying or selling at those levels. Supply Mapping bridges this gap by introducing a behavioral layer. It identifies different types of market participants based on when they decide to buy or sell, revealing their motivations.
Such a granular segmentation of different investor cohorts based on their behavioral patterns leads to a more comprehensive view of supply dynamics and market sentiment.
The Power of Supply Mapping
Understanding investor psychology is crucial in cryptocurrency markets, as repeated emotional behaviors – ranging from exuberant buying driven by FOMO, systematic profit realization at peaks, to fear-driven selling in downturns –underscore market cycles.
Supply Mapping effectively visualizes these emotional dynamics, empowering traders with superior predictive insight into pivotal market turning points.
Behavioral Cohorts Defined
Supply Mapping segments token holders into five mutually exclusive cohorts:
- Conviction Buyers: Investors accumulating tokens despite declining prices, signaling strong belief in long-term value.
- Momentum Buyers: Participants purchasing tokens as prices rise, capitalizing on market momentum.
- Loss Sellers: Investors exiting positions at a loss.
- Profit Takers: Participants selling tokens at a profit.
- First-Time Buyers: New entrants engaging with the token for the first time.
Calculating Supply Mapping
Supply Mapping calculation begins by aggregating the cumulative supply of each investor cohort on a daily basis. This cumulative view shows how the supply held by each group evolves over time.
To further enhance interpretability, a 30-day Relative Strength Index (RSI) transformation is applied, normalizing cohort data and clearly highlighting shifts in investor behavior. Green areas indicate rising supply activity, while red signifies declines, vividly capturing dynamic flows and shifting sentiment among cohorts.
Practical Behavioral Insights
The examples below illustrate how Supply Mapping enables traders to effectively read the collective mindset of the market. By interpreting shifts among cohorts, traders can clearly identify emotional extremes such as exuberant buying, panic selling, or profit realization, helping to pinpoint market excesses and anticipate reversals. Let’s break down some examples.
1) Identifying Local Tops
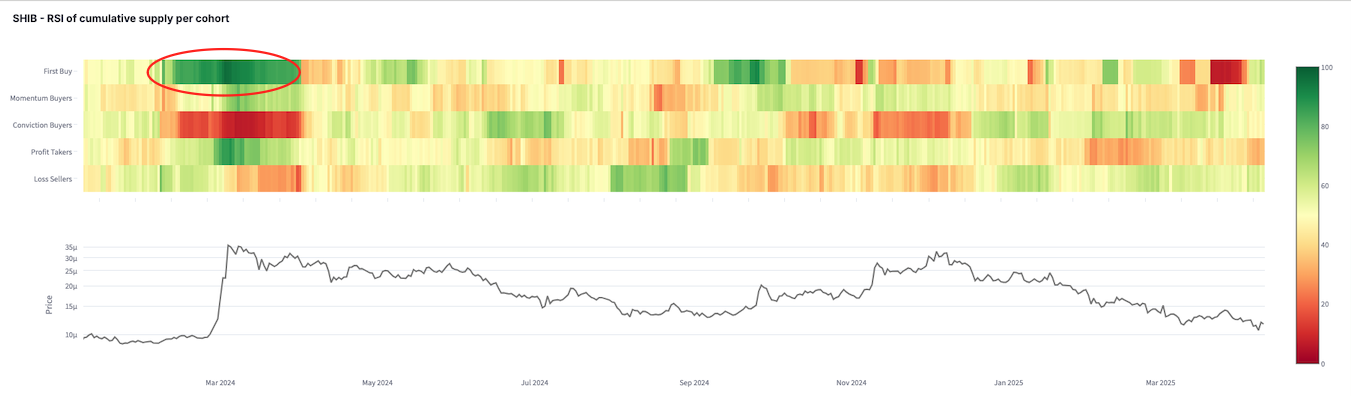
SHIB (March 2024): SHIB experienced a major wave of first-time buyers in March 2024 — a clear sign of retail-driven FOMO. As the price began to climb rapidly, hype kicked in, and new investors rushed in, eager not to miss out. This sudden influx of fresh demand is visible in the on-chain data as a strong spike in First-Time Buyers activity.
This surge of inexperienced buyers coincided almost exactly with the local price peak. Meanwhile, Profit Takers – more experienced market participants – started selling into the strength, locking in gains as the newcomers entered.
Notably, Conviction Buyers did not participate meaningfully in the rally, showing little sign of accumulation. That lack of support, combined with rising profit-taking and aggressive FOMO buying, created an unsustainable structure.
This pattern – fresh demand absorbed by seasoned sellers with no conviction backing – is often a hallmark of market tops. In SHIB’s case, it marked the start of a prolonged downtrend.
On-chain behavioral data captured this perfectly, highlighting how investor psychology leaves footprints in supply flows – and how reading those shifts can offer powerful insight into price dynamics
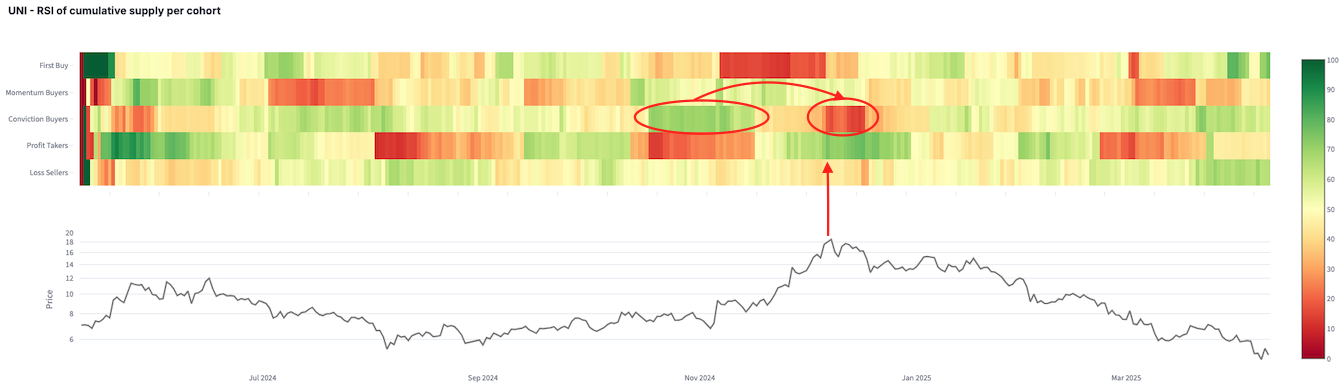
UNI (December 2024): In this example, Supply Mapping reveals again how behavioral data can help identify local market tops before price reversals occur.
Looking at UNI in late 2024, we see that Conviction Buyers (third row from the top) were actively accumulating early in the uptrend – shown by deep green colors. This indicates strong belief-driven buying, typically a healthy sign during price appreciation.
However, as the price approaches its December peak, we observe a clear behavioral shift:
- Conviction Buyers stop accumulating, with the color fading toward red.
- Simultaneously, the Profit Takers cohort (fourth row) turns green, signaling a surge in selling from participants locking in gains.
This transition from accumulation to profit-taking was a key warning signal. The growing dominance of Profit Takers suggested that the rally was maturing and that upward momentum could be fading – anticipating the eventual price reversal that followed.
2) Identifying Local Bottoms
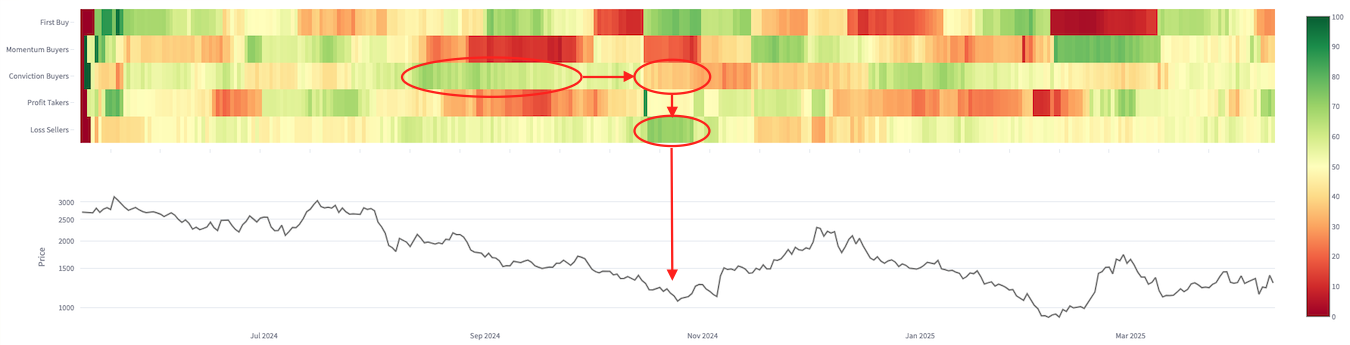
MKR (November 2024): During MKR’s sharp sell-off in November 2024, Supply Mapping highlighted a textbook example of capitulation.
Throughout the price decline, Conviction Buyers (third row from the top) had been steadily accumulating – shown by sustained green coloring – signaling confidence and willingness to absorb the dip.
But as the downtrend intensified, even these high-conviction participants started to give up. The shift is clear:
- Accumulation by Conviction Buyers fades and eventually disappears.
- At the same time, Loss Sellers (bottom row) spike sharply into green, indicating that many holders are exiting at a loss.
This behavioral pivot – from conviction to capitulation – is a hallmark of market exhaustion. When even the most resilient holders start selling, it often marks a local bottom. In this case, the simultaneous drop in conviction and surge in loss selling served as a powerful contrarian signal, presenting tactical entry opportunities for traders willing to go against the crowd.
3) Capturing Momentum and Trends
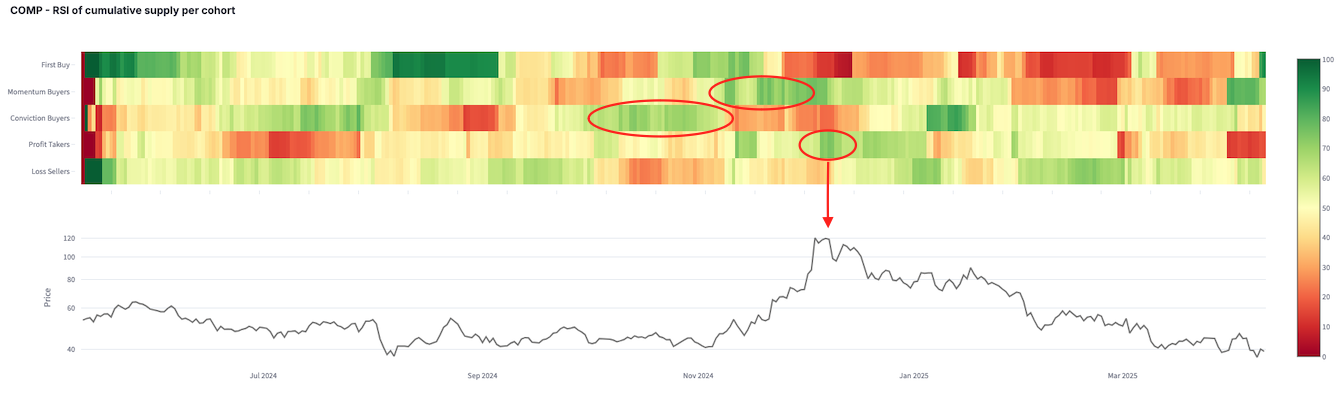
COMP (October–December 2024): The October rally in COMP followed a classic momentum-driven pattern – and Supply Mapping made that structure easy to spot.
Early on, Conviction Buyers (third row) stepped in, accumulating at lower price levels, as shown by the green band. This suggested growing confidence.
Once the price started accelerating, Momentum Buyers (second row) jumped in, pushing the rally higher and feeding the breakout.
But as the rally matured, both groups began to shift behavior:
- Momentum and Conviction Buyers stopped accumulating, as shown by fading greens.
- Profit Takers (fifth row) surged into green – indicating widespread realization of gains.
This behavioral rotation, from accumulation to distribution, echoed patterns seen in prior local tops. The rise in profit-taking activity served as an early warning of trend exhaustion, giving traders a chance to de-risk before the subsequent reversal.
These examples demonstrate how Supply Mapping empowers traders to read the collective psychology of the market. By analyzing shifts in behavior across investor cohorts, traders can identify emotional extremes – such as euphoric buying, panic-driven selling, or waves of profit-taking. These behavioral inflection points help reveal moments of market excess and can serve as early indicators of potential trend reversals.
Conclusion
Supply Mapping provides traders with a powerful lens to decode market psychology and behavior directly from on-chain data. When combined with traditional Cost Basis Distribution (CBD), it enhances visibility into not just where supply is positioned but also who is driving it. By uncovering the strategies and emotions behind participant actions – from conviction to capitulation – Supply Mapping helps traders better anticipate turning points and make more informed, timely decisions.