In our previous article on the practical applications of the Cost Basis Distribution metric (CBD), we explained the concept of cost basis lines to show how investors increase or decrease their cost-basis.
This week, we’ll look at how sharp shifts in supply at certain price levels reflect investors throwing in the towel - often a key indicator of a local market bottom.
Cost Basis Distribution - A Quick Recap
CBD reflects the total supply held by addresses with an average cost basis within specific price buckets. This, in effect, gives a clearer view of how investors’ cost bases shift over time due to buying or selling activity and allows mapping out the behaviour of market participants over time.
Tracking these upward and downward shifts helps us understand not only the sentiment behind buying and selling decisions, but also potential inflection points, where the market might pivot.
How to read CBD Heatmaps:
- Color Intensity (Supply Distribution): A color scale - from cooler shades (lower supply) to warmer shades (higher supply) - shows where the token supply is concentrated. Example: A red band means a high supply at that particular price range. A green or blue band indicates a smaller supply.
- Vertical Axis (Cost Basis): Each horizontal “slice” corresponds to a price range at which some portion of the token supply last moved.
The Psychology of Market Bottoms: A Hypothesis
Market behavior is often shaped by the intense psychological pressure experienced by investors who are deeply underwater on their positions. Across various assets - such as Uniswap (UNI), Maker (MKR), and AIOZ analyzed below - we frequently observe that holders with significant unrealized losses tend to capitulate near local or global bottoms.
This pattern suggests that forced selling, driven by emotional and financial distress, plays a key role in shaping market reversals.
Visualizing Capitulation in Action
Uniswap: Supply Redistribution at Local Bottoms
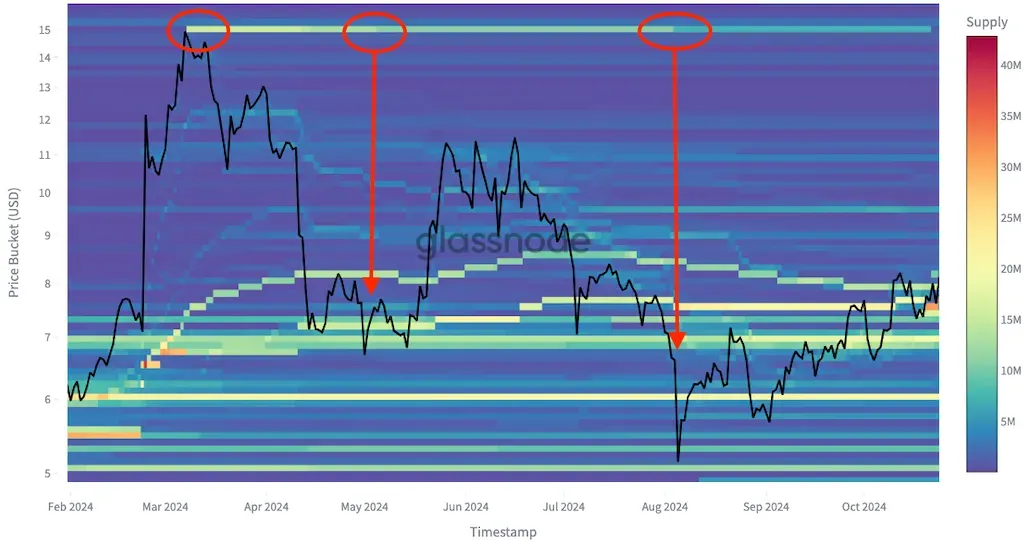
The Uniswap chart below illustrates a common CBD trend:
- Supply originally accumulated near the $15 peak gradually shifts from warmer to cooler colors over time.
- This color transition visually represents distressed investors selling their holdings at lower prices - a classic sign of capitulation.
- As this supply changes hands at depressed levels, it often finds buyers willing to step in, potentially forming a local bottom.
Maker: Repeating the Pattern
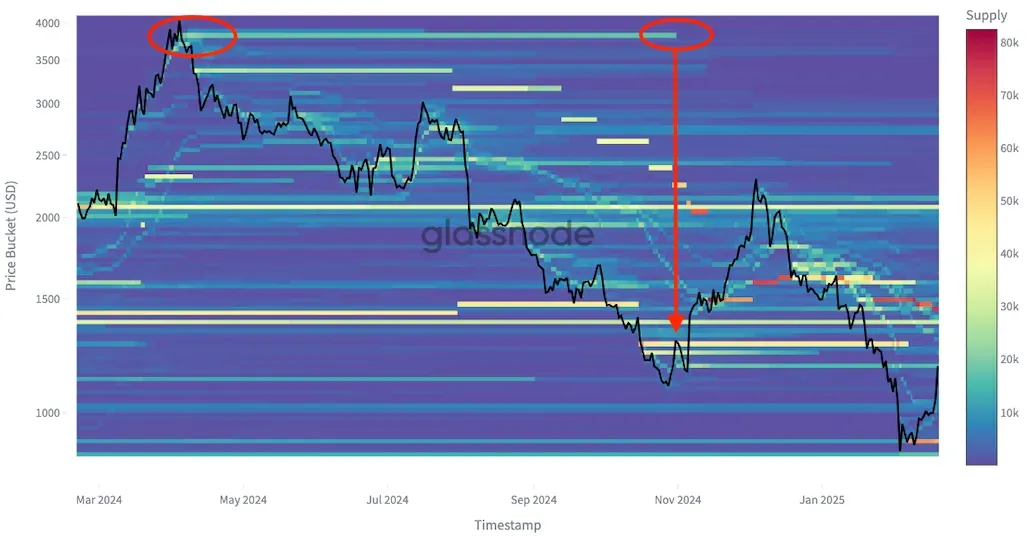
A similar pattern emerges with Maker (MKR):
- Supply that was previously accumulated at a local top is eventually capitulated at lower price levels.
- As market participants under extreme pressure liquidate their positions, we again see a turning point forming - suggesting that capitulation often coincides with local bottom formation.
AIOZ: From Confidence to Capitulation
Initially, AIOZ holders appeared confident near the $1 mark, steadily accumulating as prices hovered around a local peak. However, as the market began to decline, sentiment shifted dramatically:
- A wave of selling emerged, with investors gradually offloading their positions at each successive price drop.
- This progressive unwinding reflects a classic capitulation phase, where financial and emotional strain lead investors to "throw in the towel."
- As forced selling exhausts itself, market conditions may stabilize, potentially setting the stage for a turning point.

This pattern highlights the psychological cycles at play in the market - confidence at the top, distress-driven selling at the bottom, and eventual opportunities for contrarian buyers.
Why This Matters
Understanding these cycles of forced selling helps us identify potential inflection points in the market. When capitulation reaches its peak, supply transitions from weak hands to stronger hands, creating opportunities for contrarian buyers who recognize the psychological dynamics at play.
By tracking these behavioral shifts, we can gain a deeper understanding of how and when local bottoms might form across different assets.
Identifying Local Bottoms: A Data-Driven Approach
Market bottoms are often formed during periods of extreme distress - when forced selling reaches its peak and exhausted sellers finally capitulate. By identifying these zones of maximum pain, we can better understand where local bottoms might emerge.
To quantify this dynamic, we introduce a capitulation metric based on Cost Basis Dynamics (CBD) data. This metric aims to measure investor pain more accurately than traditional realized loss indicators.
Constructing the Capitulation Metric
Our approach to defining capitulation incorporates three key elements:
1. Weighted Sell Volumes
Not all losses are felt equally. A trader selling at a 50% loss experiences significantly more financial and emotional pressure than one selling at a 10% loss. To account for this, we apply a quadratic function to the difference between the average cost basis and the current market price. This weighting system amplifies severe losses, making them more prominent in our metric.
2. Smoothing for Clarity
Market data is noisy, and short-term fluctuations can obscure meaningful trends. To filter out this noise, we apply a 7-day exponential moving average (EMA) to the weighted sell volumes, allowing us to focus on sustained periods of distress rather than isolated events.
3. Non-Linear Economic ‘Pain’
Traditional realized loss metrics treat all losses proportionally in nominal terms. However, in reality, investors experience losses non-linearly—a deep drawdown feels exponentially worse than a minor dip. Our capitulation metric adjusts for this by emphasizing larger losses through quadratic weighting, better capturing the psychological burden of extreme sell-offs.
Visualizing Capitulation: What the Data Reveals
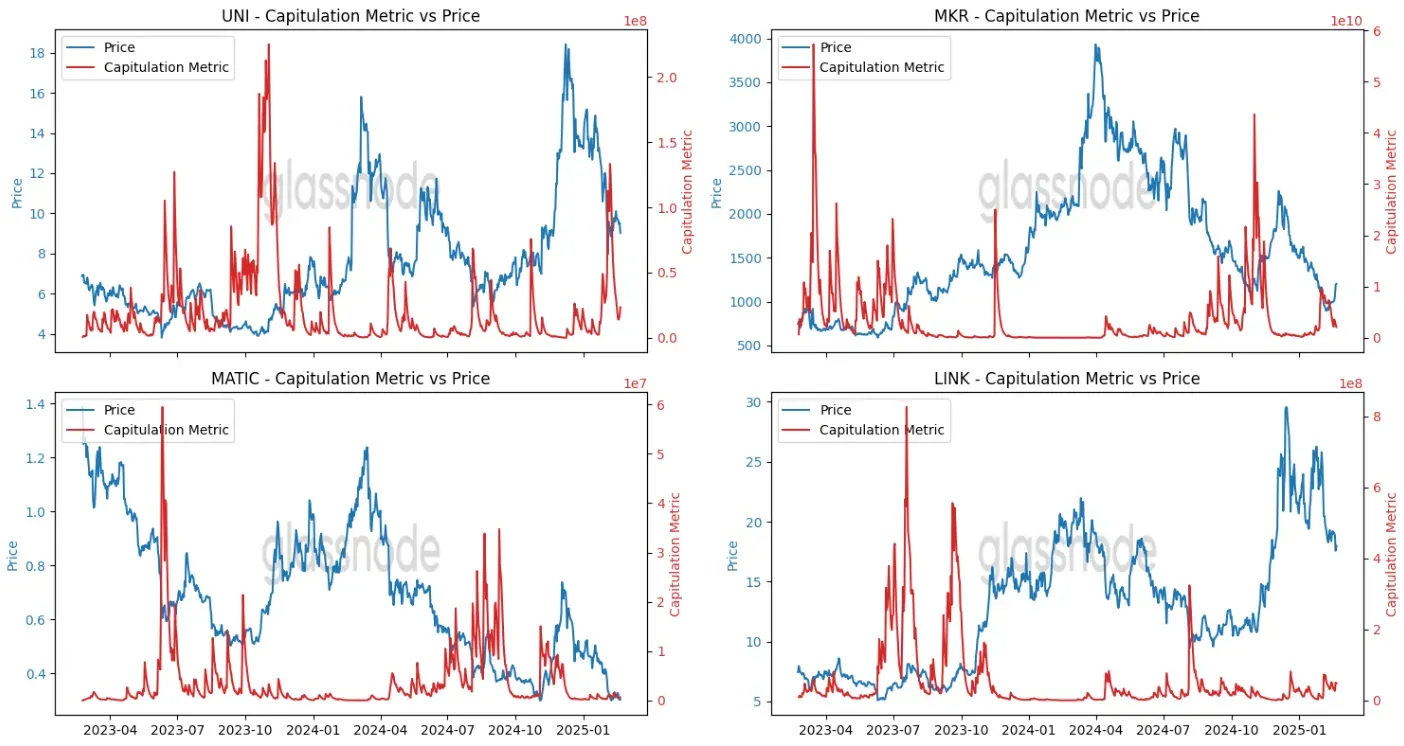
When plotted in red, the capitulation metric frequently spikes near major price lows, shown in blue. We observe this pattern consistently across a selection of cryptocurrencies, including Uniswap (UNI), Maker (MKR), MATIC, and LINK.
These spikes indicate moments when heavily underwater investors finally capitulate - selling at deep losses, often in response to panic or liquidations. Historically, such points have often marked local bottoms, presenting potential buying opportunities for risk-tolerant investors.
Why This Matters
Identifying Turning Points
By pinpointing zones of maximum pain, this metric offers a systematic way to identify local bottoms, where forced selling is likely reaching its final stages. This can be particularly useful for traders seeking high-risk, high-reward entry points.
Understanding Investor Psychology
Market cycles are driven by sentiment as much as fundamentals. This metric provides a quantifiable measure of capitulation, revealing when investors have lost confidence or exhausted their capital. These psychological turning points often coincide with market inflection points, where sentiment and price action begin to shift.
Conclusion
By refining how we measure market distress, the capitulation metric provides valuable insights into local bottom formation. While no single indicator guarantees precision, combining this with broader market context and technical analysis can improve timing for entries in volatile conditions.
Do you want to get access to the source code?
Attached you will find the Google Colab Notebook of the capitulation metric. You just need to plug your API key and run the notebook.