$500M of on-chain collateral will face liquidation if ETH falls to…

AmbcryptoPublicado em 2022-06-12Última atualização em 2022-06-12

Resumo

$500M of on-chain collateral will face liquidation if ETH falls to…

Ethereum [ETH], the world’s largest altcoin, might be losing its plot despite anticipation around the Merge. Rather, one can say that the token is seeing a delayed plot. Ethereum core developer Tim Beiko recently opined that the merge to proof-of-stake (PoS) would happen between August and November. This announcement follows more bad news for Ethereum enthusiasts hoping for the completion of the Ethereum 2.0 Merge in August.

Here comes another bomb…

Data on Coinbase revealed that Ethereum was priced at $1,519.03 to the U.S dollar at press time, having fallen by 11.53% over the past 24 hours. In fact, ETH remains well below its all-time high of $4,891.70. In the last week alone, the crypto fell by 14.04%.

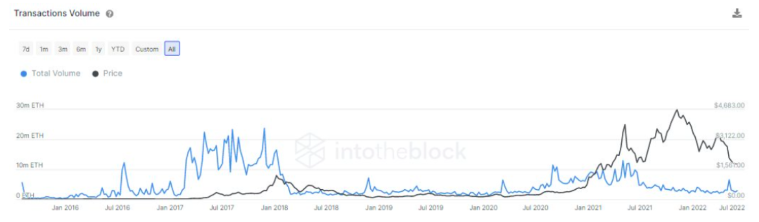
According to blockchain data explorer Blockchair, exactly 1,228,131 Ethereum transactions failed between 1 May and 31 May. Furthermore, the trend seemed to continue at the time of writing. Ergo, Ethereum’s transaction volumes have also dropped substantially given the current situation.

Towards the beginning of the week on 5 June, it went as low as 1.22 million ETH — A level not seen since mid-2020. At press time as well, the number stood in the one million to two million bracket. Indeed, a downtrend since May 2021.

While most cryptocurrency market participants continue to struggle with bearish days, HODLers of the second-largest asset by market capitalization are also facing record lows in profit. Indeed, the percentage of Ethereum addresses in profits is at its monthly low.

Also, as revealed by Glassnode’s on-chain alerts account on 12 June, HODLers in losses have significantly inclined.

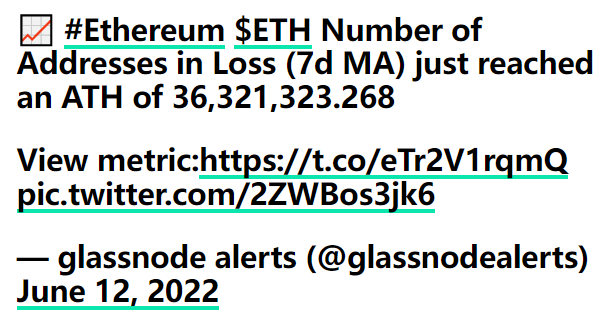
This is the after-effect of increasing Ethereum selling pressure as the price continues to trade down south.

Saving the best for the last?

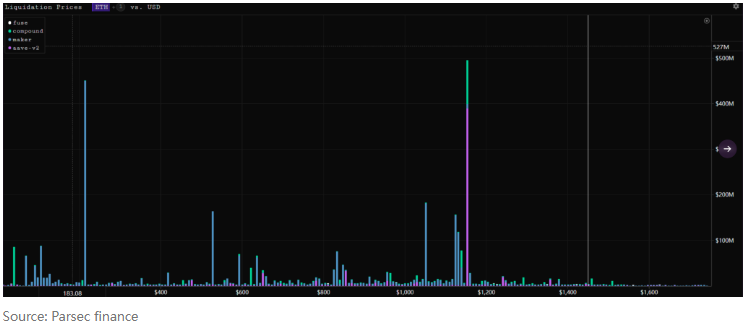
Another MAJOR concern for Ethereum is unprecedented liquidation at the moment. Around $230 million worth of ETH tokens were liquidated in a day as the price declined. This is now, but the sheer decline could have some serious implications soon. Consider this, for instance –

According to parsec finance, when ETH falls to around $1,150, nearly $500 million of on-chain collateral will face liquidation. wBTC will have more than $300 million of on-chain collateral near $21,600 or face liquidations.

Additionally, as per Curve, the stETH/ETH pool asset ratio is skewed, with ETH accounting for 24.11% and stETH accounting for 75.89%. stETH de-pegged slightly and the unbalanced pool signified that one of the assets, stETH in this case, is becoming more illiquid i.e. It would become difficult to sell as there isn’t enough ETH liquidity to incorporate sell orders of stETH at current prices.

Looks like we just have to wait and look for what’s in store next?

Leituras Relacionadas

Bitcoin Trading Strategy Breakdown: Celebrity Predictions and Classic Models All Fail, Only These Four Indicators Remain

Analysis of Bitcoin Trading Strategies: Why Celebrity Forecasts and Classic Models Fail, Leaving Only These Four Reliable Indicators This analysis examines the failure of common Bitcoin prediction methods and identifies four reliable indicators for constructing a trading strategy. The author reviewed all major BTC prediction approaches from 2017-2025, categorizing them into three groups: celebrity price targets (consistently over-optimistic), analytical models like Stock-to-Flow (broken post-2022), and on-chain signals. The key finding is that more data often creates confusion, not clarity. The strategy discards unreliable elements: celebrity predictions (incentivized to be extreme), pure models (invalidated by post-ETF market changes), and the Fear & Greed Index used alone (too many false signals). Four reliable indicators were selected: 1. **MVRV Z-Score:** Accurately identifies cycle bottoms when entering its green zone (e.g., 2018, 2020, 2022). Note: Its ability to call tops is now ineffective post-2024. 2. **SOPR (28-day MA):** Consistently signals bottoms when below 1.0, indicating holders are selling at a loss. 3. **ETF Net Flow:** A crucial post-2024 metric showing institutional momentum (e.g., sustained inflows = buying). 4. **Macro Liquidity (Fed policy & M2):** Sets the overall directional bias (e.g., bullish during easing cycles). The core strategy involves waiting for a multi-signal共振 (resonance). For example, a bottom signal requires MVRV in the green zone + SOPR < 1.0. A top signal requires overheated on-chain data + sustained ETF outflows. Macro policy sets the overall direction. The Fear & Greed Index is only used as a weighted confirmatory signal, never alone. Action is only taken when three or more indicators align. The author automated this into a monitoring system that sends Telegram alerts only when signals trigger. As of the article's date (April 15, 2026), the system showed a strong bottom signal: extreme fear (F&G=12), MVRV in the buy zone, and SOPR < 1.0. The only contrary signal was weak ETF flows. Historically, such triple on-chain共振 has preceded 100%+ returns. The conclusion emphasizes building a personal framework over relying on external predictions, allowing for iterative improvement and customization based on individual risk tolerance.

marsbitHá 1h

Bitcoin Trading Strategy Breakdown: Celebrity Predictions and Classic Models All Fail, Only These Four Indicators Remain

marsbitHá 1h

Trading

Spot
Futuros
活动图片