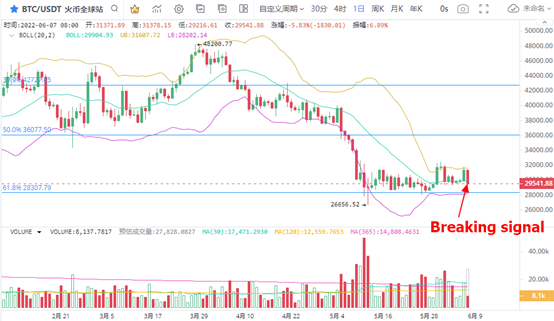
1. BTC falls below the middle rail of brin line
Before BTC's short-term rebound strength was significantly expanded, the range shock ended with price fall, suggesting a typical adjustment signal. At present, the transaction volume of BTC is still not fully enlarged, and the price fluctuation is limited to the range. Nevertheless, after the price falls below the medium rail signal of brin line, the closing point is very important and is the basis for confirming the further operation direction.
In terms of brin line, the upper and lower tracks of the indicator continue to shrink, making the shape of the bell mouth narrower, which means that the authenticity of the disc change at this time is higher.
Next, if the BTC in the K line can close below the $29904 corresponding to the middle rail of the brin line, it can be seen that the BTC trend is bearish. The USD 28201 corresponding to the middle track to the lower track of the brin line is the key position for short-term positions, which deserves investors' attention.
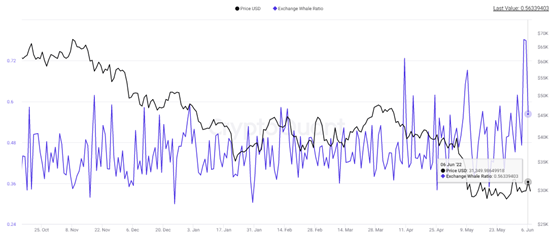
2. The proportion of main selling pressure increased rapidly
The selling pressure of BTC in the exchange has affected the price trend, which has been reflected in the price retreat stage on June 7.
Looking back at the proportion of main selling pressure in the recent exchange, the proportion of main selling pressure in the exchange can be as high as 0.727, 0.692 and 0.779 on April 10, May 9 and June 6, while the average value is below 0.5. This shows that the short-term main selling pressure is upward, and the selling points for improvement are relatively clear.
At present, when the main selling pressure has not dropped significantly, although the BTC price has been running at a low level within one year, there is no bottom reading signal.
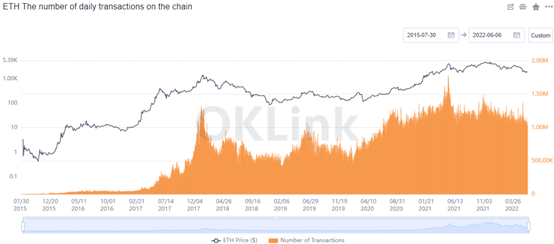
3. Decrease in the number of transactions on the ETH chain
The number of transactions on the ETH chain continued to decline, but the pace of decline remained at a certain frequency, so the expected price adjustment trend remained unchanged. Eth online trading volume peaked and retreated in May 2021, when the online trading volume was large. However, the current scale of on chain transactions is 58% of that in May 2021, and it is difficult to make a significant change in the short term after the decline of transaction volume. At the same time, the performance of the on chain trading volume is more characterized by the operation of the general trend. The short-term trend of Eth and the on chain data go down synchronously.
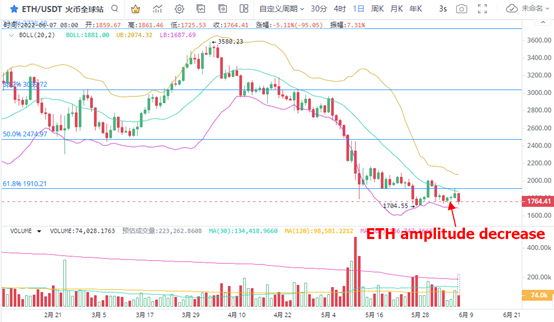
4. Sideways fluctuation of eth price
Although the short-term trend of eth is weaker than that of BTC, the callback trend is relatively clear. The price runs below the middle rail of brin line, and the short-term continues to show a bearish signal. From the closing price position, ETH has been running at the recent low price. The ETH price is not only lower than the lowest $1788 on May 12, but also $1700 has not shown a strong supporting effect. Therefore, in the process of price investigation, we should be alert to possible downside risks.
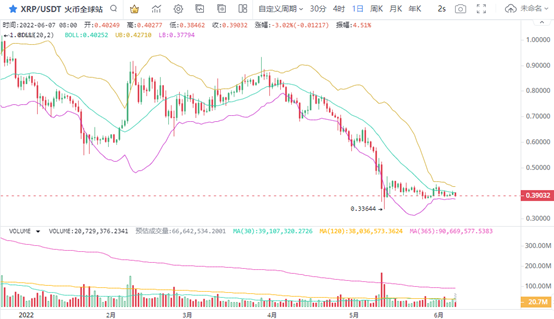
5. XRP weakness declines
Although the recent decline of most mainstream currencies narrowed, after the short-term decline of BTC, more currencies continued the price decline. XRP's short-term price volatility retreated, continuously digesting the recent buying energy, and the expectation of price decline increased.
Although there were large-scale fluctuations around May 10, bulls accumulated more buying energy in the same period. But at present, XRP has not been able to continue its heavy volume and stop falling performance in the near future. The trading volume is shrinking and the expectation of price adjustment is still strong. We can pay attention to the possibility of price changes in the near future. The trend of mainstream currencies will closely follow the change of BTC price, so the rise and fall will start after the BTC prompts a breakthrough signal.