Альткоины: главные гейнеры уходящей недели

cryptonews.ruPublicado em 2022-01-10Última atualização em 2024-08-10

Первая неделя августа 2024 года началась с масштабных движений на криптовалютном рынке. Многие криптовалюты пострадали, но были и те, кто сумел укрепить позиции

Несмотря на неблагоприятное развитие событий, некоторые альткоины показали заметный рост, особенно к концу недели. В этой статье мы рассмотрим наиболее успешные альткоины последних дней, включая Sui (SUI), Zcash (ZEC) и Helium (HNT).

Цена Sui (SUI) отреагировала на призыв Grayscale

SUI, основной токен блокчейна первого уровня, 8 августа пережил один из лучших дней, поднявшись до $0,83, и завершив первую неделю августа 2024 года с впечатляющим ростом на 28,77%.

Рост SUI связан с объявлением Grayscale: 7 августа компания сообщила, что добавила SUI и Bittensor (TAO) в список инвестиционных трастовых продуктов.

До объявления SUI продавался по цене $0,60. Однако новость спровоцировала вызвала волну положительных комментариев в интернете, которые подняли индекс настроений к годовым максимумам.

Индекс настроений по Sui. Источник: Santiment

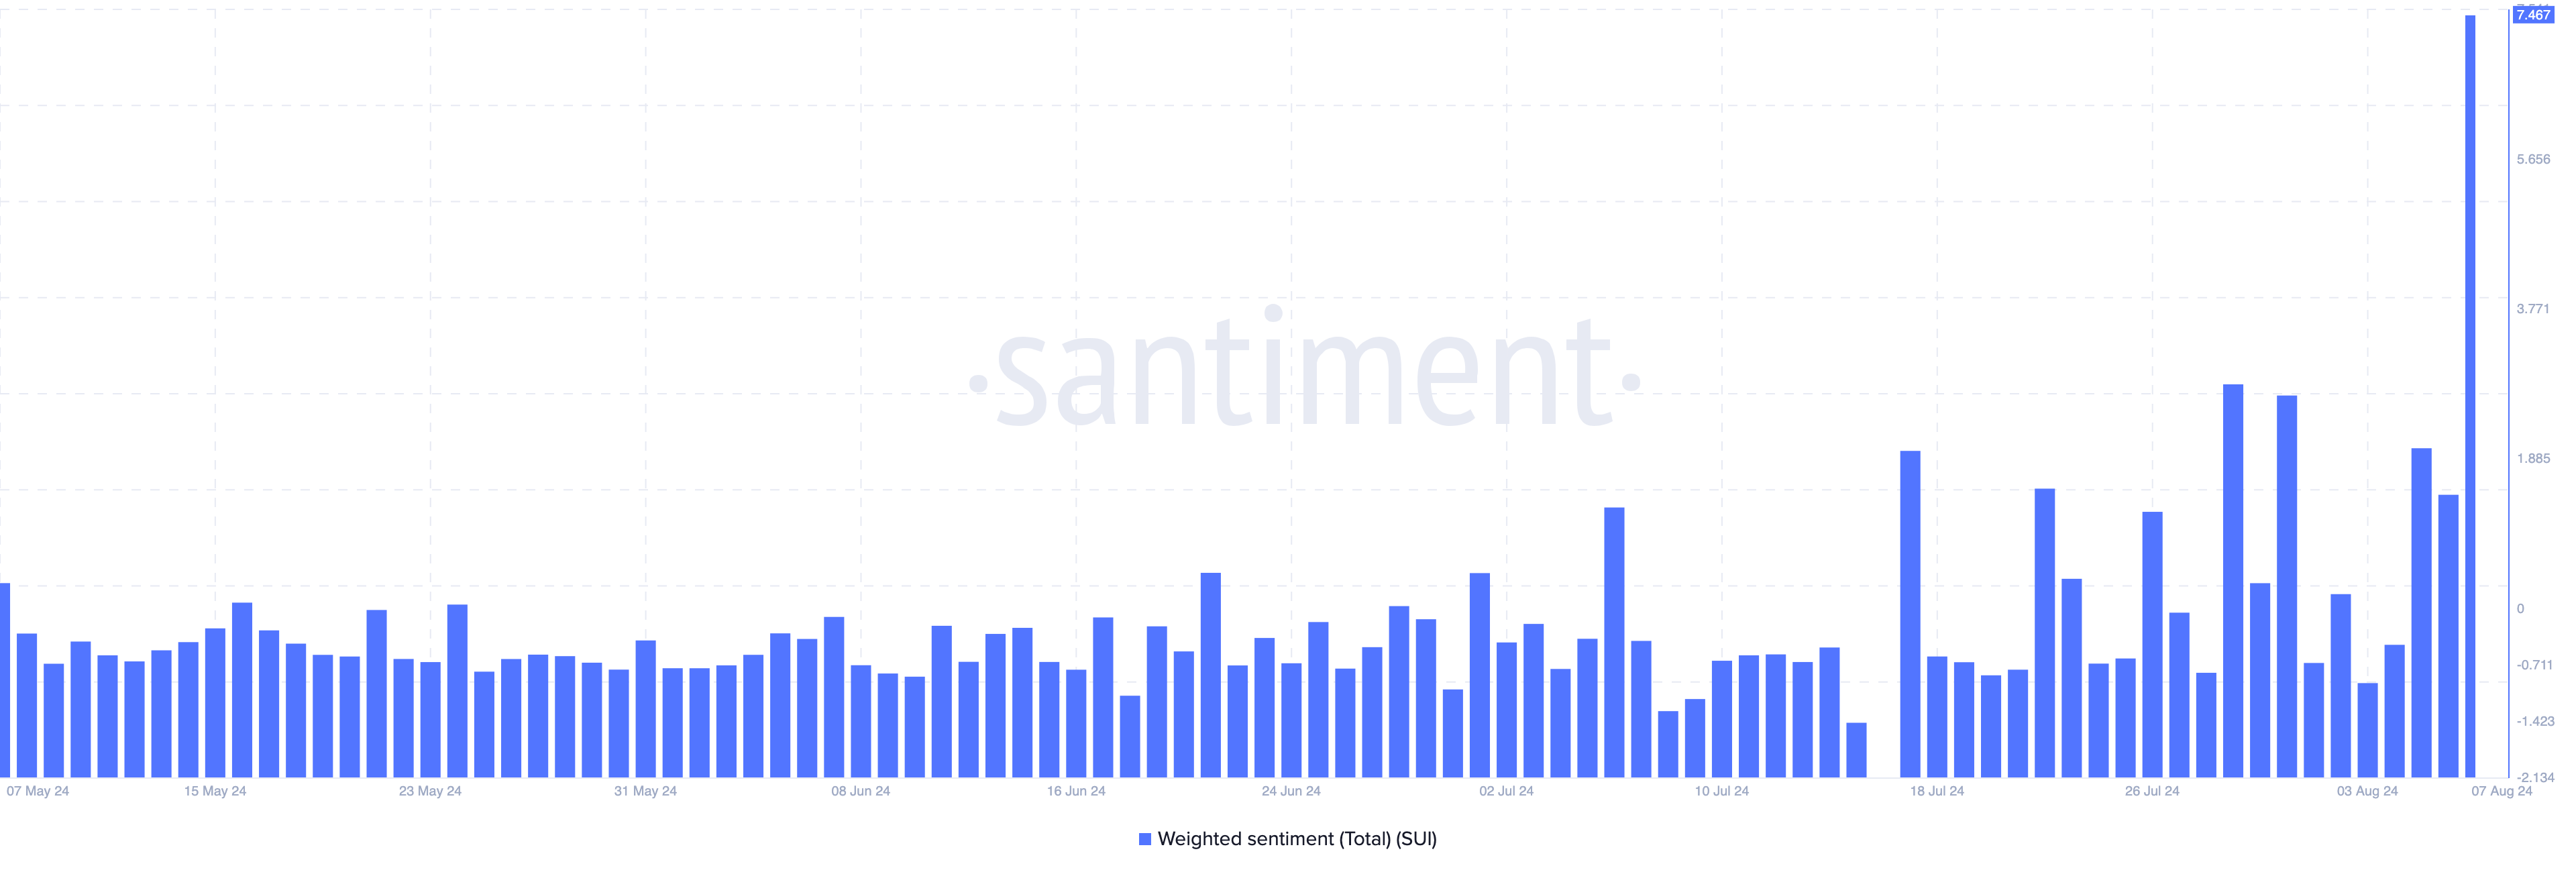
Ранее SUI подешевел на 42%. В частности, 5 августа цена упала до $0,46. Однако рост выше скользящих средних EMA 20 (синяя) и 50 (желтая) подтвердил бычий тренд.

Sui Daily Analysis. Источник: TradingView

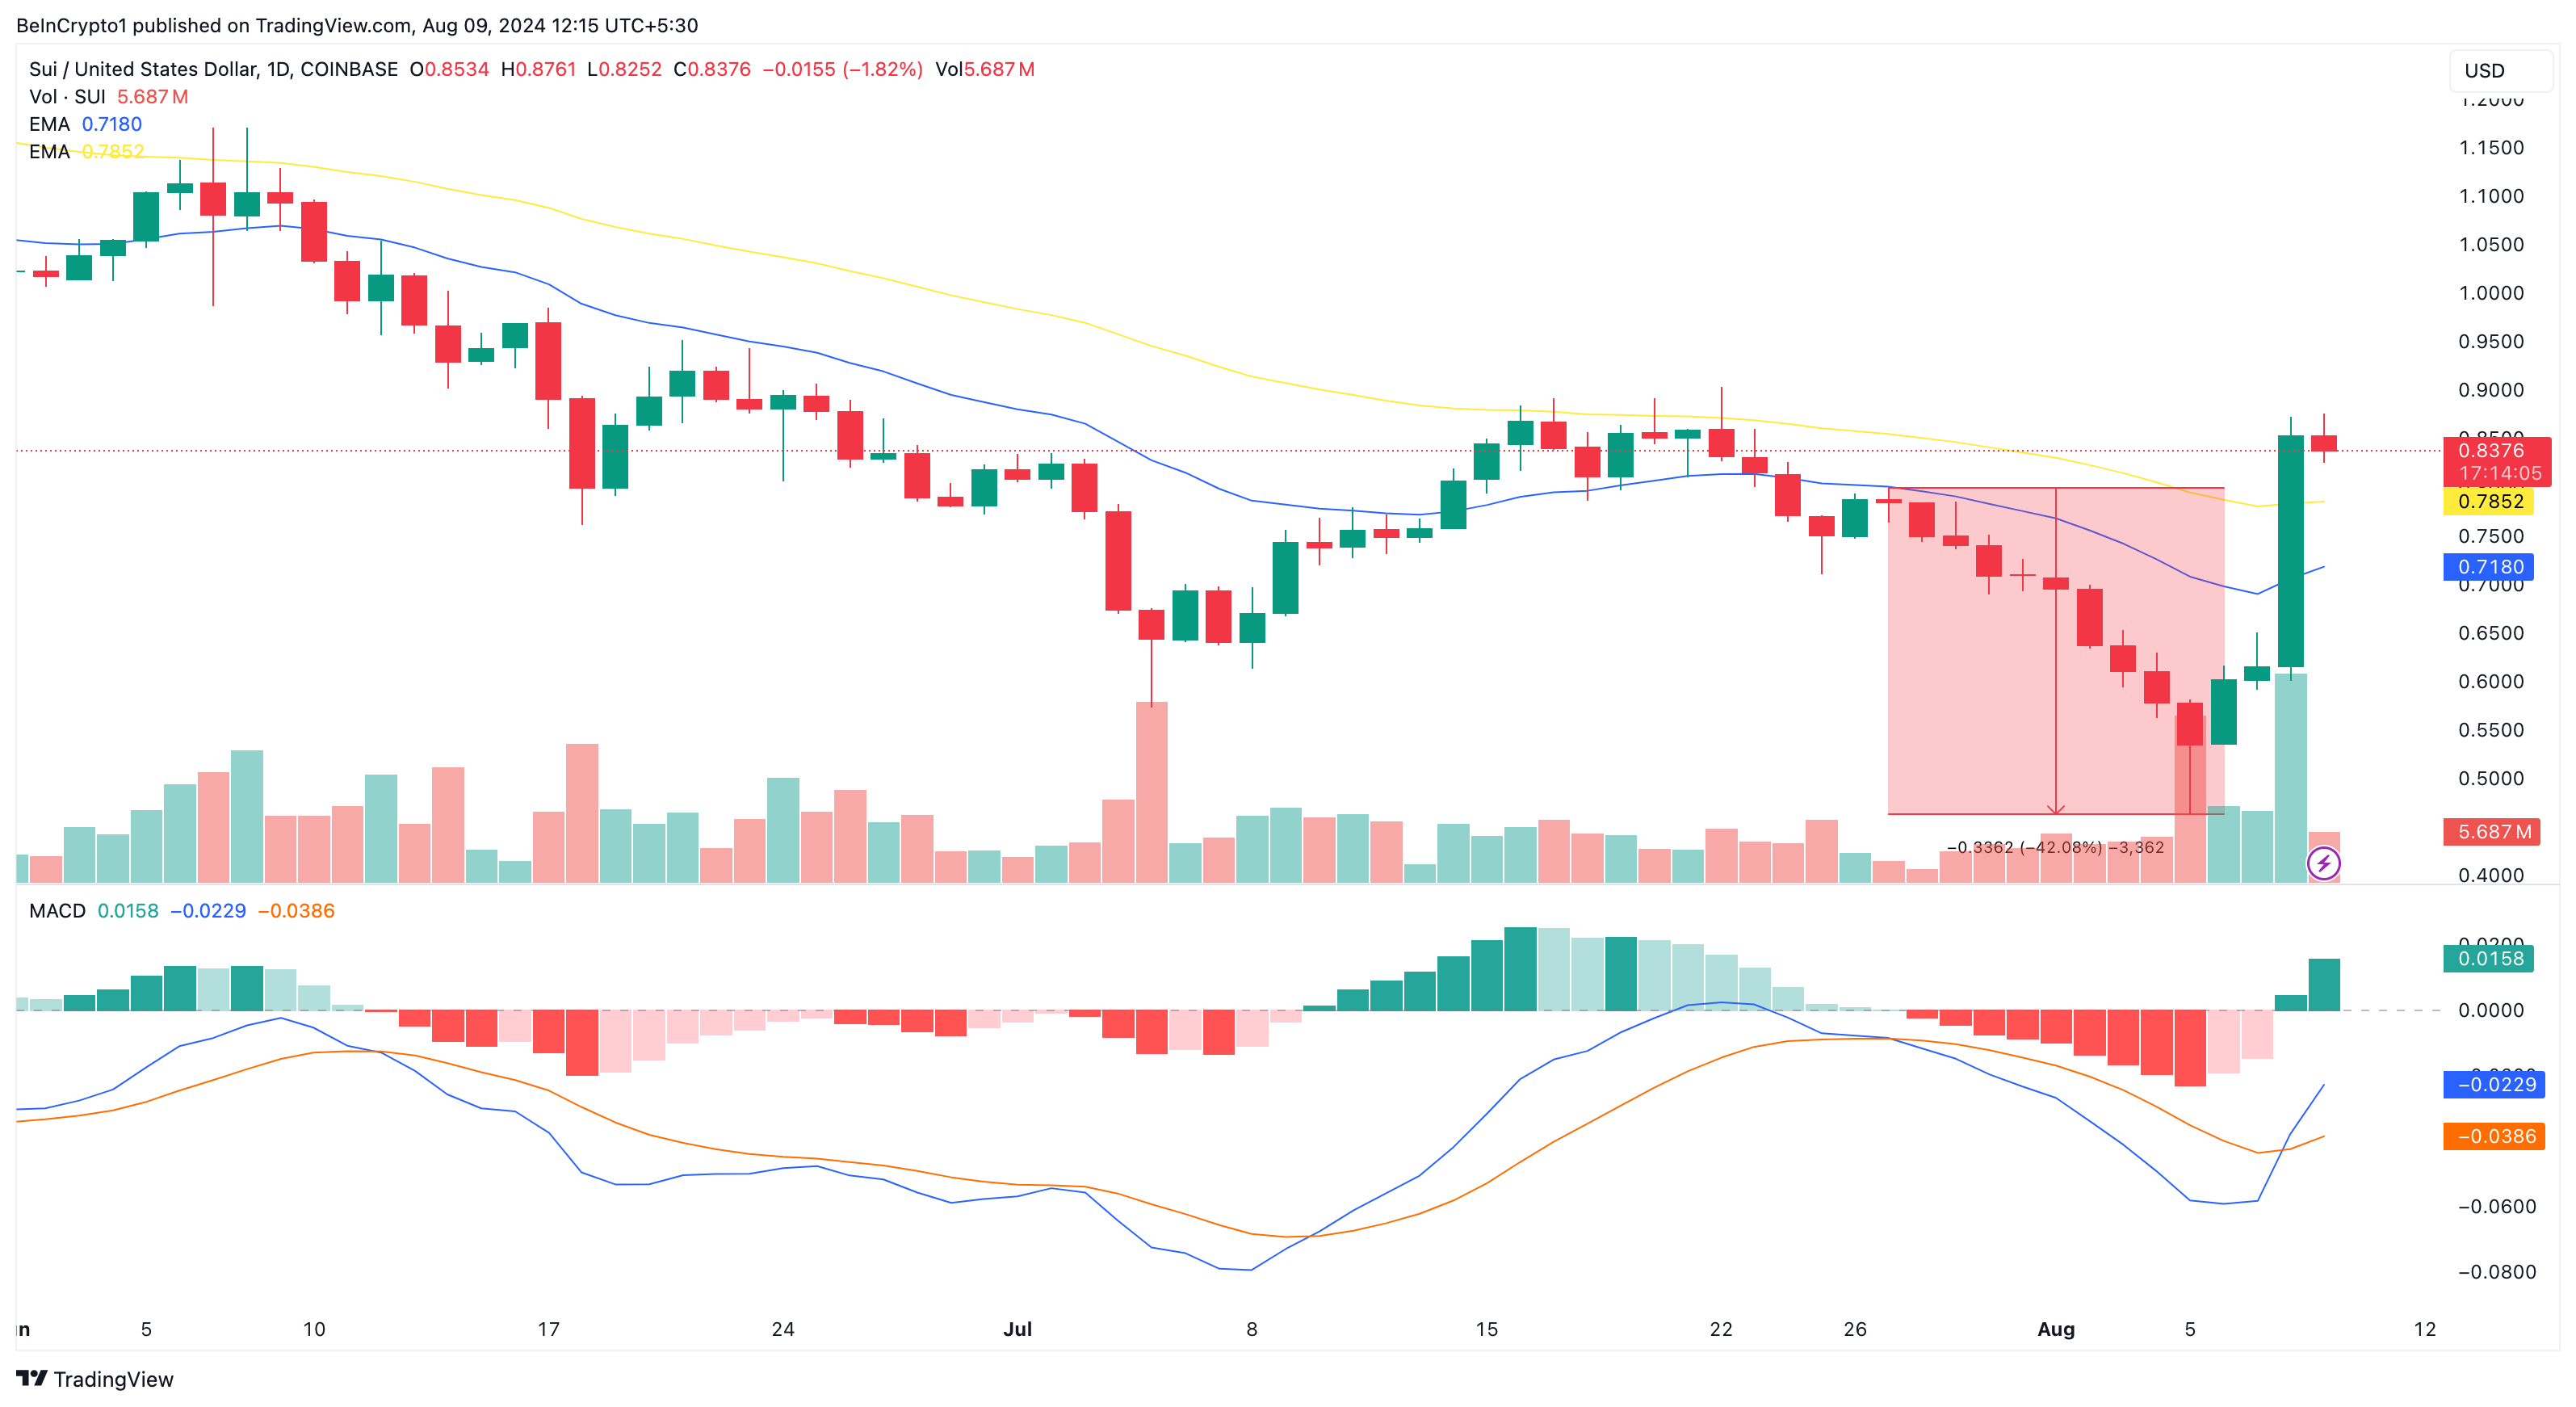
Экспоненциальная скользящая средняя (EMA) помогает оценить направление тренда во времени. Падение SUI ниже EMA, поставило бы бычий тренд под сомнение.

Несмотря на откат, индикатор MACD подтверждает возобновление восходящего тренда. MACD измеряет импульс, анализируя разницу между двумя скользящими средними.

Если показания MACD выше нулевой линии, как в случае с SUI, импульс направлен вверх. Если восходящий тренд продолжится, SUI может достичь $0,90. Однако, если токен столкнется с сопротивлением, цена может упасть до $0,71.

Читайте также: Где покупать альткоины — топ лучших бирж

Zcash (ZEC) формирует двойное дно

Zcash, децентрализованная криптовалюта с высоким уровнем конфиденциальности, занимает второе место в нашем списке. За последние семь дней ZEC подорожал на 24,50%.

На данный момент ZEC торгуется по цене $37,32. На дневном графике видно, что рост начался после формирования двойного дна. Этот паттерн, который предполагает разворот тренда, характеризуется движением в форме буквы W, когда цена растет после двукратного тестирования одного уровня поддержки.

Как показано ниже, ZEC подтвердил бычий разворот, прорвавшись через линию шеи около $32,54. Тем временем индекс относительной силы (RSI) на уровне 71,28 указывает на то, что токен перекуплен.

Ежедневный анализ Zcash. Источник: TradingView

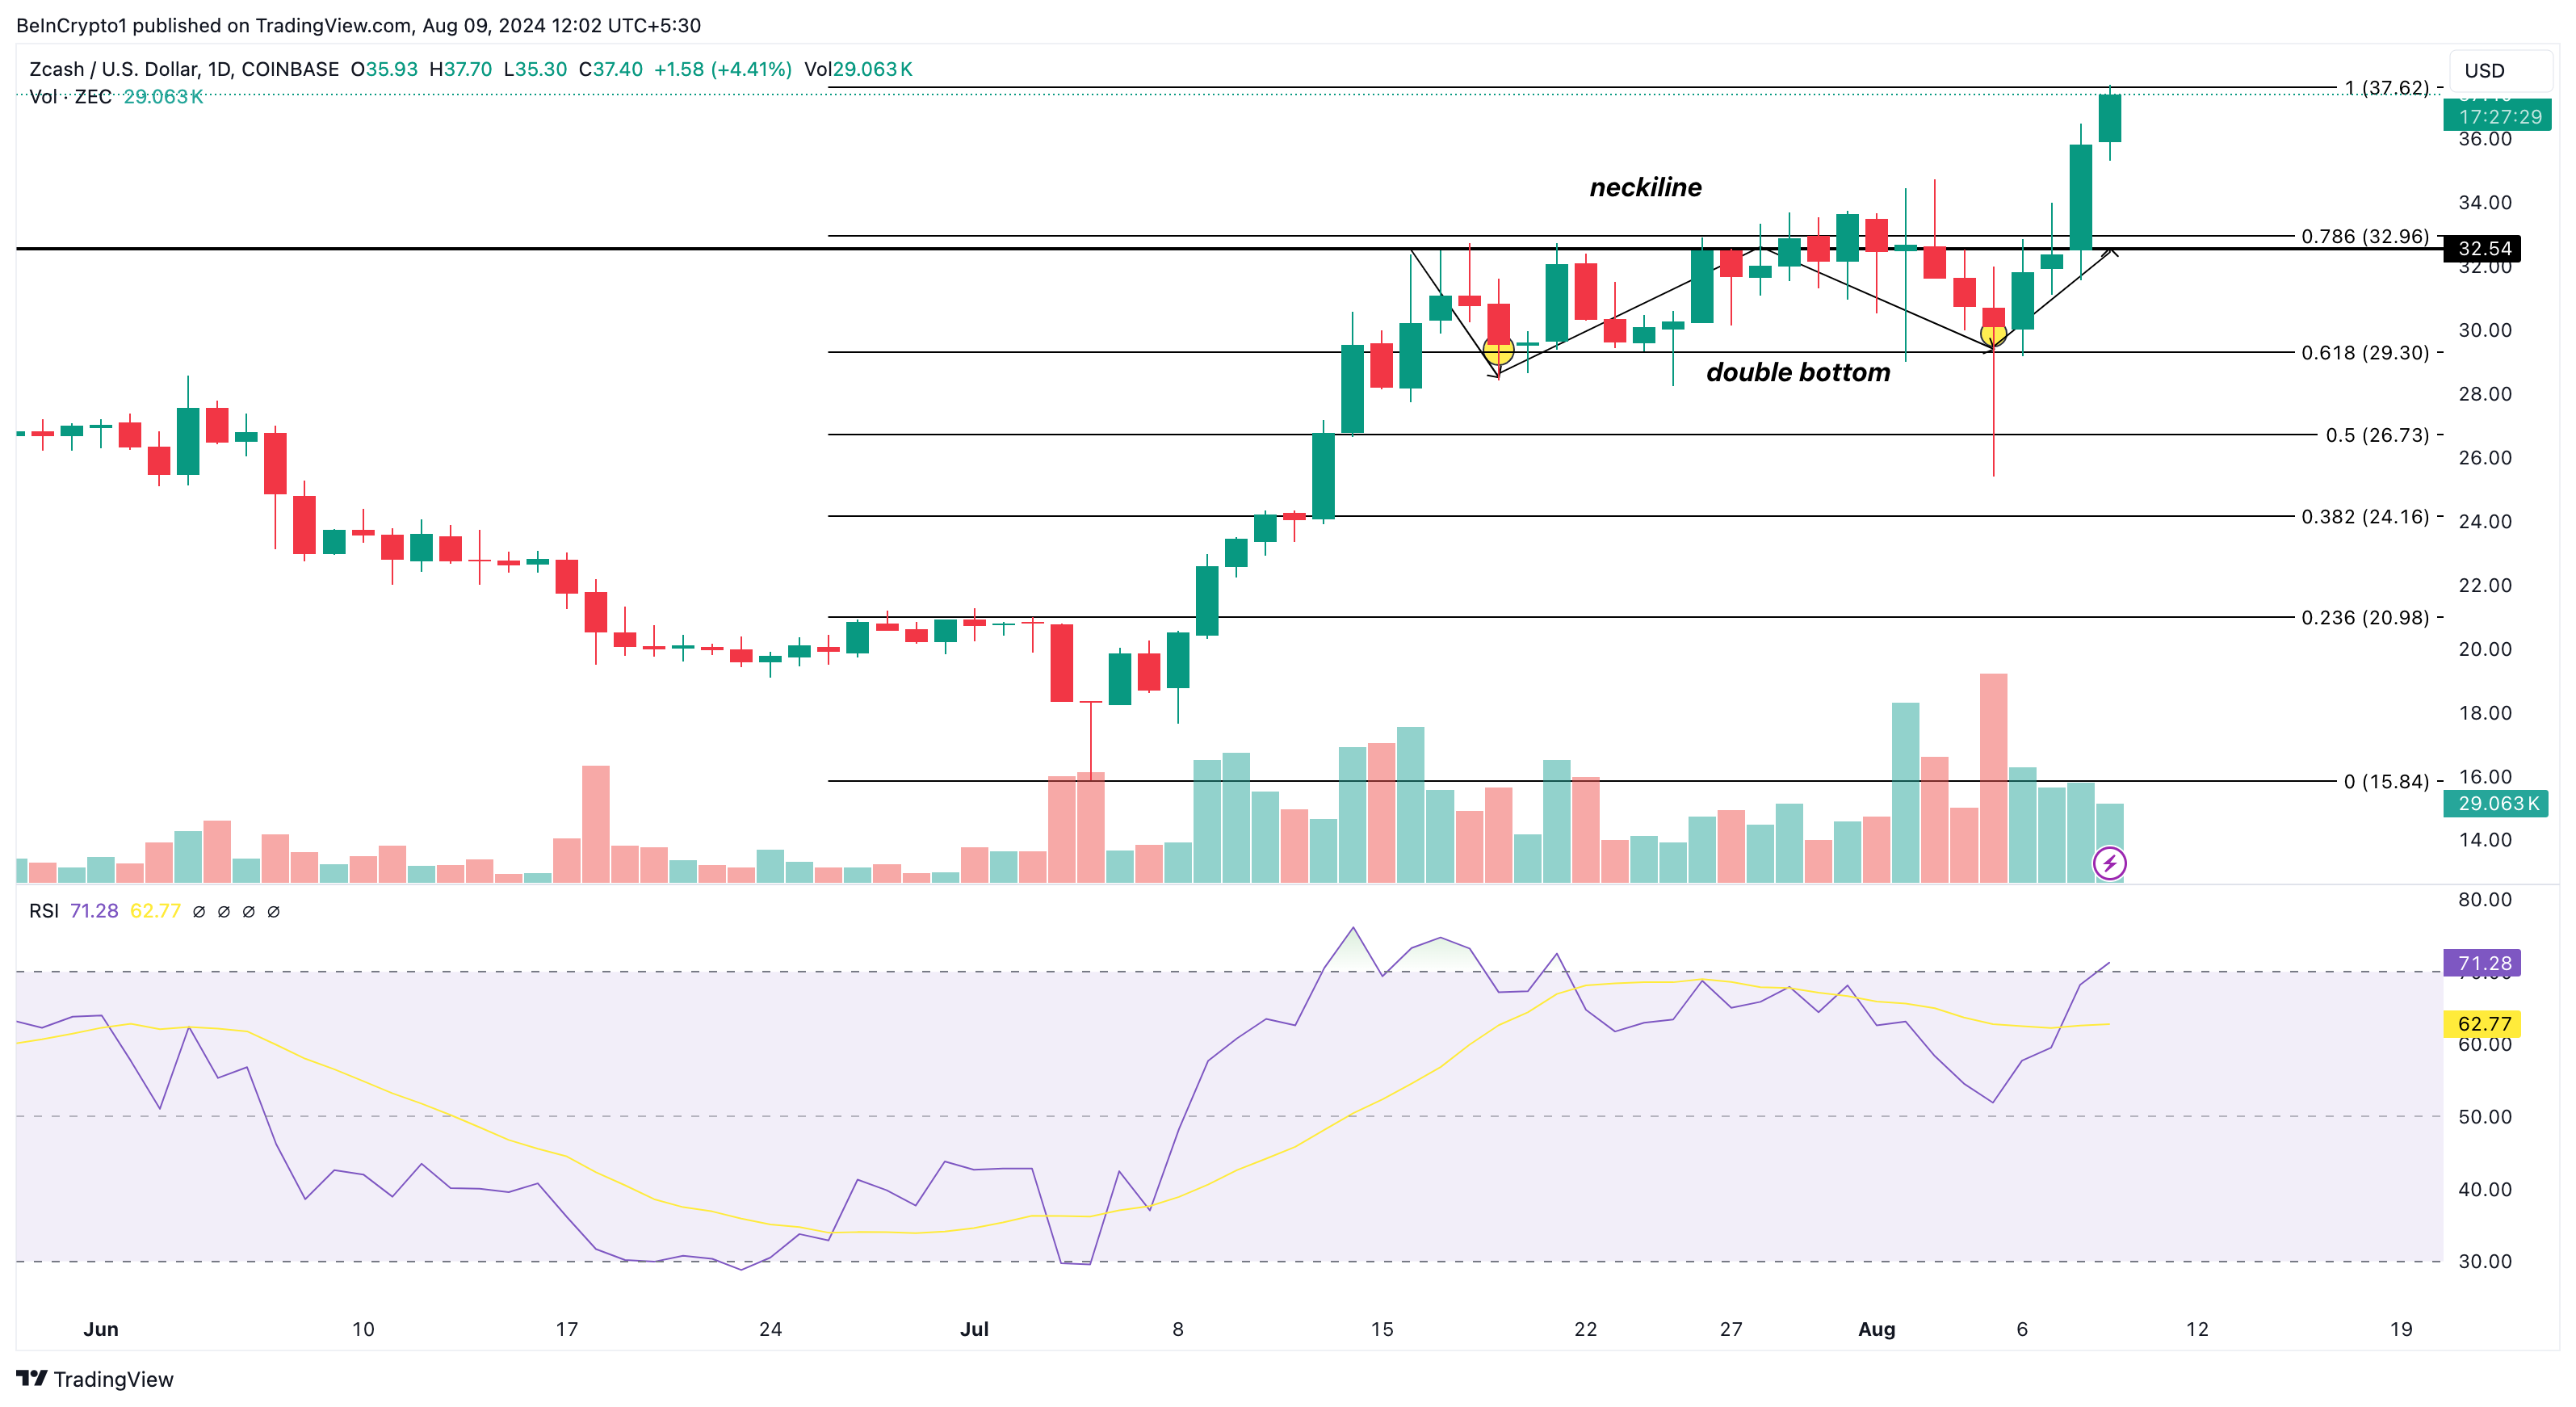
Значение RSI выше 70,00 свидетельствуют о состоянии перекупленности, что делает актив уязвимым для фиксации прибыли.

Если это случится, цена может опуститься до $32,96. Но если покупательное давление останется высоким, цена токена может подняться к отметке $40.

Helium (HNT) в числе лидеров вторую неделю подряд

На прошлой неделе токен DePIN-проекта стал одним из лидеров роста среди альткоинов. На этой неделе он продолжает удерживать позиции, показав прирост на 15,60%. Токен, занимающий 74-е место по стоимости среди криптовалют, работает на платформе Solana.

Читайте также: Топ DePIN-проектов для инвестиций 2024

После резкого падения на прошлой неделе Helium быстро восстановился, образовав V-образный паттерн, что свидетельствует о сильном отскоке.

Сейчас токен торгуется по цене $5,90. Однако индикатор OBV (On Balance Volume), который измеряет объемы покупок и продаж, предполагает, что рост еще не закончился. Увеличение OBV говорит о сильном покупательном давлении, а его падение — о доминировании продавцов.

График Helium. Источник: TradingView

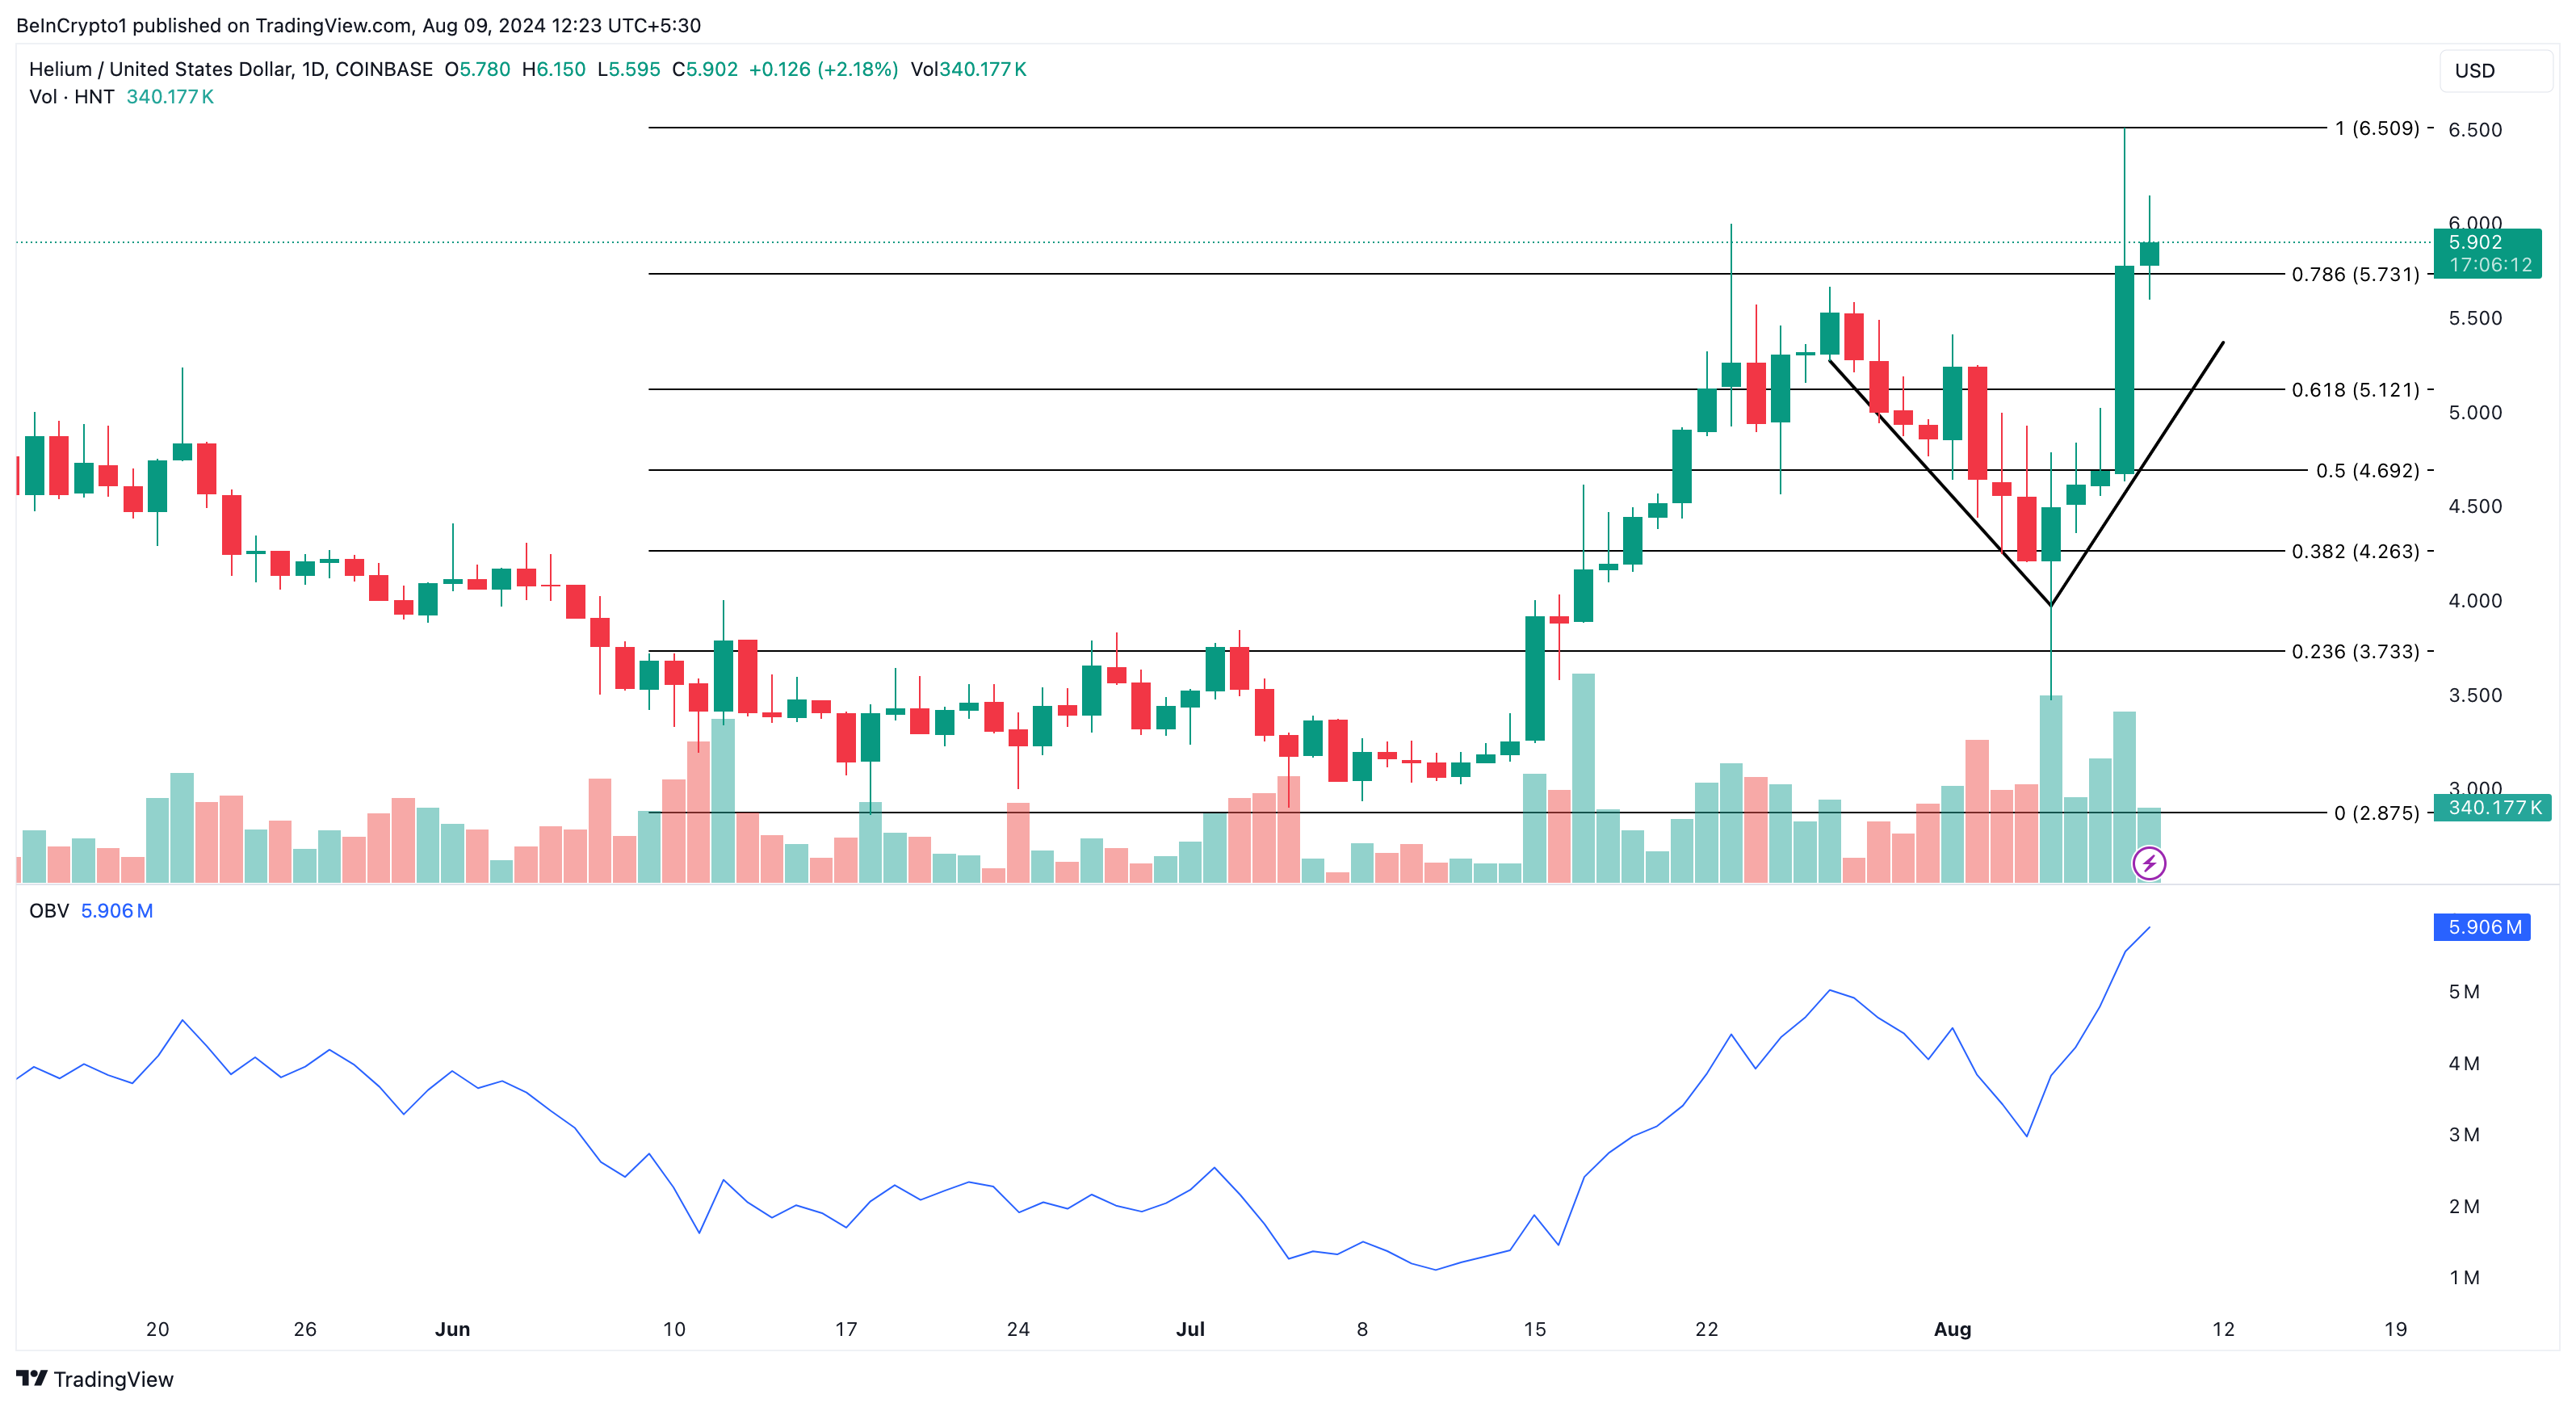
Если восходящее давление сохранится, HNT попытается достичь $6,50. Но если продавцы перехватят инициативу, цена может упасть до $5,73.

Leituras Relacionadas

Critical Game Week: BTC Retracement Confirmation vs. HYPE Support Battle | Guest Analysis

This weekly analysis outlines a critical juncture for BTC and HYPE markets, focusing on key price level confirmations. **BTC Analysis:** BTC is at a pivotal point after a five-wave rally from the June 5th low of $59,100. The price has broken below a short-term rising channel's lower boundary, with the current move seen as a pullback to test this breakdown. Failure to reclaim this level could lead to a retest of the $59,000-$60,000 support zone. The core scenario hinges on this channel retest outcome. * **Key Levels:** Resistance at $64,500-$65,000 (channel boundary) and $69,500-$70,500. Support at $59,000-$60,000 and $55,000. * **Strategy:** A core bearish stance is maintained (20% short from last week), with short-term plans for tactical trades. Three detailed contingency plans (A/B/C) are provided for short positions on resistance tests or breakdowns, emphasizing strict stop-loss discipline. **HYPE Analysis:** HYPE shows strong momentum but is currently in a corrective phase after hitting a new high of $76.94. The price is retesting the crucial $64-$66 support area. * **Key Levels:** Resistance near $77 and $80-$82. Support at $64-$66 and $52-$54. * **Strategy:** The short-term approach is "buy on dips, avoid chasing rallies." A long position is considered only if clear stabilization signals appear at the $64-$66 or deeper $52-$54 support zones, with tight risk controls. **General Risk Management:** A standardized trailing stop-loss protocol is emphasized: set initial stop, breakeven at +1% profit, then trail stops upward to lock in gains. *Disclaimer: All analysis is presented as a personal trading framework, not investment advice. Market conditions are complex and require dynamic adjustment.*

marsbitHá 2m

Critical Game Week: BTC Retracement Confirmation vs. HYPE Support Battle | Guest Analysis

marsbitHá 2m

Research Report Interpretation: Citi Attends AWS Summit, Bullish on Cloud Business Acceleration but Data Governance Remains Key Variable

Citi analyst Tyler Radke's team attended the AWS New York Summit (June 17-18), engaging with over 10 clients and partners. In a June 19 report, they highlighted the summit's focus on scaling agent AI for enterprise deployment. Citi maintains a "Buy" rating on Amazon, forecasting AWS revenue growth to accelerate to 37% in FY27 from 30% in FY26, noting this estimate may be conservative. Key takeaways: 1. **AWS Strategy Shift:** AWS is moving from proof-of-concepts to scalable deployment. New offerings like AWS Context (building enterprise knowledge graphs), Amazon Quick (cross-application AI assistant), and security tool Continuum address core enterprise pain points for AI adoption. 2. **Data Infrastructure Beneficiaries:** Data infrastructure companies like Snowflake, Elastic, Oracle, and ClickHouse are seen as direct beneficiaries of scaling AI workloads, as evidenced by strong growth and use cases presented. 3. **Critical Role of Data Governance:** As AI agents scale from hundreds to thousands, effective data governance becomes the key variable for deploying AI in core business processes. AWS Context represents AWS's strategic extension from providing compute/models to offering a data governance infrastructure layer. The report emphasizes that without solving data governance, AI will remain confined to pilot projects. The investment thesis focuses on AWS revenue acceleration and data infrastructure vendors' growth, while monitoring signals like AWS's quarterly revenue growth, Bedrock AgentCore task volume, and pricing impacts on companies like Elastic.

marsbitHá 8m

Research Report Interpretation: Citi Attends AWS Summit, Bullish on Cloud Business Acceleration but Data Governance Remains Key Variable

marsbitHá 8m

Crucial Week of Contention: BTC Tests Support and HYPE's Key Level Battle | Special Analysis

**Market Enters Critical Week: Bitcoin Pullback Test and HYPE Support Battle** The market enters a crucial phase of contention this week. The marginal shifts in Federal Reserve policy expectations continue to dictate the pricing rhythm for risk assets. Meanwhile, in the crypto market, following a period of sideways consolidation, the divergence between bulls and bears is becoming concentrated at key price levels. **Bitcoin (BTC) Analysis & Strategy** * **Technical View:** The 4-hour chart suggests BTC is in a five-wave structure since the June 5th low near $59,100. Price action shows a short-term rising channel. The recent drop below this channel's lower boundary is now being followed by a pullback attempt (wave 40-41). The outcome of this retest is critical. * **This Week's Outlook:** The core focus is whether BTC can reclaim and hold above the channel's lower boundary. * **Bullish Scenario:** A successful hold could lead to a continued rebound, potentially challenging the $69,500 - $70,500 resistance zone. * **Bearish Scenario:** Failure to hold may trigger a renewed test of the $59,000 - $60,000 core support area, with $55,000 as a deeper support level. * **Operational Strategy:** The author maintains a 20% mid-term short position initiated last week near $64,500, based on a model signaling a shift to a bearish structure. Short-term tactics involve using 30% capital for potential "spread" trades, with three contingency plans (A, B, C) outlined for reacting to resistance tests, breakouts, or support breakdowns. **HYPE Analysis & Strategy** * **Technical View:** On the 4-hour chart, HYPE shows strong momentum, having recently broken to a new high since January. The current pullback presents a clear three-wave correction structure, bringing the price back to the critical $64 - $66 support zone. * **This Week's Outlook:** The focus is on the battle for the $64 - $66 support area. * **Bullish Scenario:** Holding this support could signal a continuation of the uptrend from the June 10th low, leading to new highs. * **Bearish Scenario:** A breakdown could extend the correction, potentially testing the deeper $52 - $54 support band. * **Operational Strategy:** The recommended short-term approach is "buy on dips, avoid chasing rallies." A light long position (under 30% capital) could be considered if HYPE shows stabilization signals at the $64-$66 or $52-$54 support zones, confirmed by model signals. Strict stop-loss discipline is emphasized. **General Risk Management:** A strict trailing stop-loss protocol is advised: set an initial stop; move to breakeven at +1% profit; lock in profits progressively thereafter. *Disclaimer: All analysis is presented as the author's personal technical perspective and trading log, not as investment advice. Markets are complex and dynamic; risk control is paramount.*

Odaily星球日报Há 8m

Crucial Week of Contention: BTC Tests Support and HYPE's Key Level Battle | Special Analysis

Odaily星球日报Há 8m

AI Agents Also Need 'Credit Checks': ERC-8126 is Filling the Gap in On-chain Trust

The article discusses ERC-8126, a proposed standard designed to address the lack of trust and verification for AI Agents operating on-chain. While ERC-8004 provides AI Agents with a basic on-chain identity (answering "Who are you?"), it does not guarantee trustworthiness. ERC-8126 aims to fill this gap by establishing a verification layer (answering "Are you reliable?"). It standardizes how independent verification providers can assess an agent's associated risks across five key areas: Token/Contract Verification (ETV), Media Content Verification (MCV), Solidity Code Verification (SCV), Web Application Verification (WAV), and Wallet Verification (WV). These providers generate a standardized risk score (0-100) and proofs based on their checks, without acting as a single authoritative certifier. This allows wallets, marketplaces, dApps, and other agents to consume these risk signals—for example, to display warnings, filter listings, or make interaction decisions. The standard also incorporates concepts like Private Data Verification (PDV) and Zero-Knowledge Proofs (ZKP) to allow verification without exposing sensitive underlying data. Positioned alongside ERC-8004 (Identity) and ERC-8183 (Commerce for agents), ERC-8126 represents a step toward building a verifiable and accountable infrastructure for the emerging on-chain AI Agent economy, shifting trust assessment from purely user-based judgment to standardized, consumable signals.

marsbitHá 26m

AI Agents Also Need 'Credit Checks': ERC-8126 is Filling the Gap in On-chain Trust

marsbitHá 26m

Rented Conviction: How Much Real Money Is Behind the Bitcoin ETF Flows

Borrowed Belief: How much of Bitcoin ETF flows are real money? Weekly Bitcoin ETF flows, often interpreted as a measure of institutional conviction, are heavily influenced by a hidden arbitrage trade rather than genuine directional buying. A cash-and-carry arbitrage, where traders buy the ETF while simultaneously shorting Bitcoin futures on the CME to lock in a basis spread (the price difference between futures and spot), drives roughly half of the week-to-week flow volatility. This delta-neutral activity appears as ETF inflows but is unrelated to price views. Data shows a strong correlation (0.70) between weekly ETF inflows and increases in hedge fund short positions on CME futures, while Bitcoin’s weekly price returns have almost no explanatory power. However, this arbitrage activity dominates short-term *fluctuations*, not the cumulative *stock* of investments. Of the total ~$55 billion in net ETF inflows since launch, only about $1 billion currently represents net arbitrage exposure. The vast majority consists of steady, directional buying averaging around $400 million per week. The arbitrage trade has been unwinding for two years, with hedge fund short positions peaking near $14 billion in late 2024 and declining to ~$4.5 billion. Recent ETF outflows partly reflect this ongoing unwind as the basis compresses, not a loss of faith in Bitcoin. Thus, ETF flows overstate the *volatility* of belief, not its *level*. The headline number is more a gauge of arbitrage desk activity than conviction. For accurate interpretation, monitor the CME basis relative to Treasury yields and hedge fund net shorts—these reveal how much of the reported “demand” is truly directional.

marsbitHá 29m

Rented Conviction: How Much Real Money Is Behind the Bitcoin ETF Flows

marsbitHá 29m

Trading

Spot
Futuros
活动图片