Galaxy Digital Q2加密风投报告:反弹仍在持续,与上一轮牛市还有差距

Odaily星球日报Publicado em 2024-07-08Última atualização em 2024-07-08

Resumo

相较于第一季度比特币和流动性加密货币的强劲表现,第二季度的市场略有降温,但与去年同期相比仍有显著增长。

作者: Alex Thorn 和 Gabe Parker , Galaxy Digital 研究分析师

编译: Yangz , Techub News

相较于第一季度比特币和流动性加密货币的强劲表现,第二季度的市场略有降温,但与去年同期相比仍有显著增长。第一季度出现的加密货币风投反弹趋势似乎仍在持续。第二季度行业创始人和投资者们的表现意味着融资环境较前几个季度已更为活跃。只是,截至 7 月 1 日,数据表现略逊于市场普遍情绪。

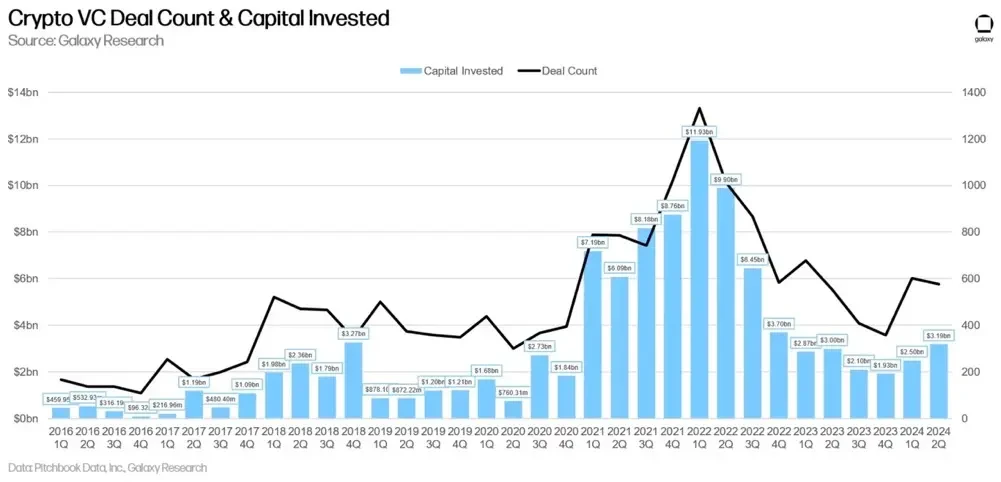
第二季度行业风投交易数量环比略有下降,从第一季度的 603 笔降至第二季度的 577 笔,而投资资本则从第一季度的 25 亿美元增至第二季度的 32 亿美元。交易规模的中位数从 300 万美元略增至 320 万美元,但投前估值中位数从 1900 万美元增至 3700 万美元,接近历史最高水平。这些数据表明,尽管与之前的高峰期相比,可用投资资本不足,但过去几个季度加密货币市场的复苏已为投资者们带来了激烈的竞争,也引发了他们的 FOMO 。

交易数量和投资资本

2024 年第二季度,风投向加密货币和区块链公司投资了 31.94 亿美元(环比增长 28% ),涉及 577 笔交易(环比下降 4% )。

Galaxy Digital Q2加密风投报告:反弹仍在持续,与上一轮牛市还有差距

投资资本与比特币价格

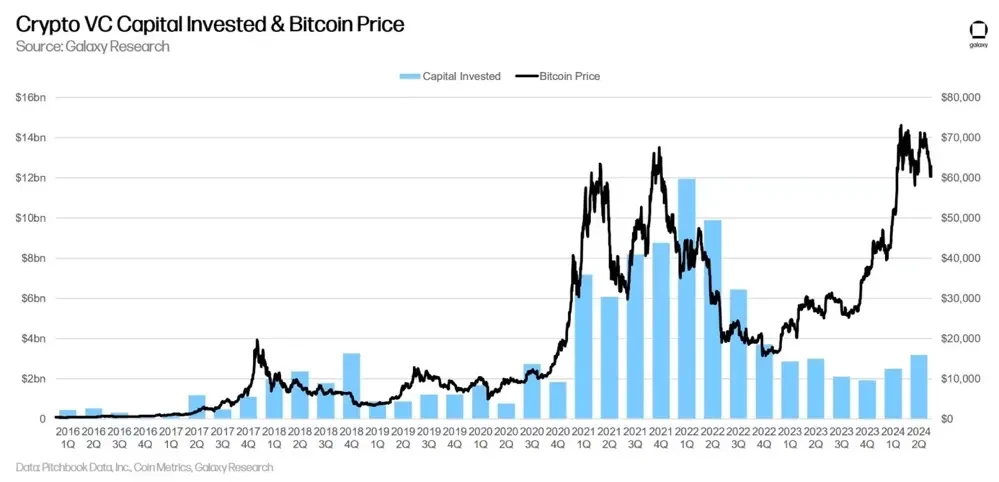
比特币价格与投入加密货币初创企业的资本之间的多年相关性已经打破。自 2023 年 1 月以来,比特币大幅上涨,而风投活动却没跟上节奏。虽然比特币在今年大幅上涨,且投入资本也有所上升,但仍远低于 2021-2022 年比特币突破 6 万美元时的水平。加密原生催化剂,如比特币 ETF 和新兴领域(如再质押、模块化、比特币 L2 ),以及加密货币初创企业破产和监管挑战带来的压力,再加上宏观经济逆风(利率),导致了这种明显的分歧。现在,随着流动性加密货币的复苏,风投们正准备回归,今年下半年的风投活动也将增加。

Galaxy Digital Q2加密风投报告:反弹仍在持续,与上一轮牛市还有差距

风险投资的阶段划分

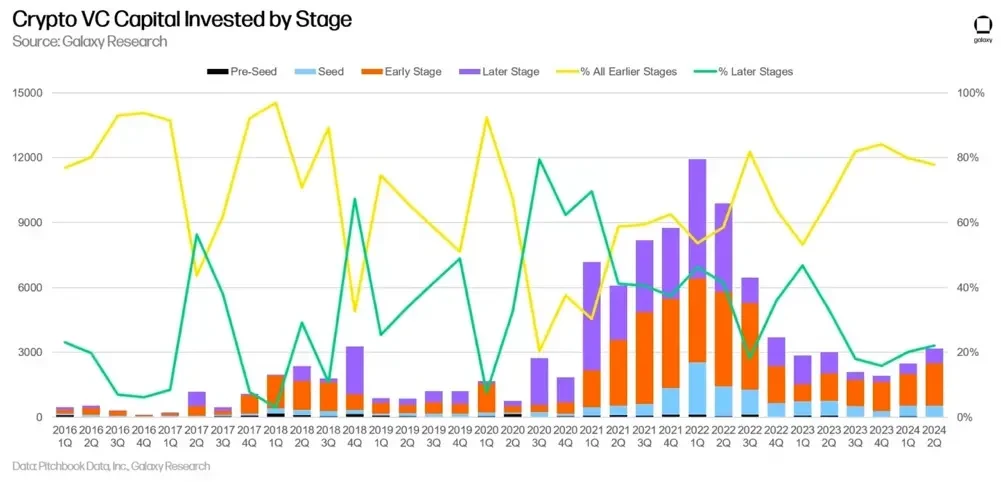
2024 年第二季度, 78% 的资金分配给了处于融资早期的公司, 20% 则分配给了处于融资后期的公司。尽管专注于加密货币的早期风险投资基金十分活跃,且手握 2021 年和 2022 年留下来的储备资金,但大型综合风险投资公司似乎已经退出行业或大幅缩减活动,使得处于融资后期的创业公司更难筹集资金。

Galaxy Digital Q2加密风投报告:反弹仍在持续,与上一轮牛市还有差距

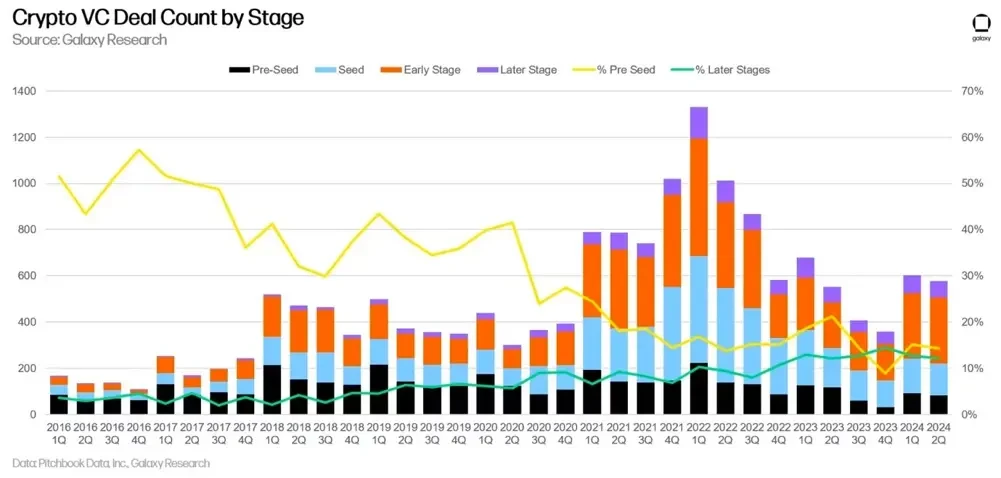
在交易数量上, Pre - Seed 轮交易的份额略有下降,但仍高于上一轮市场周期。
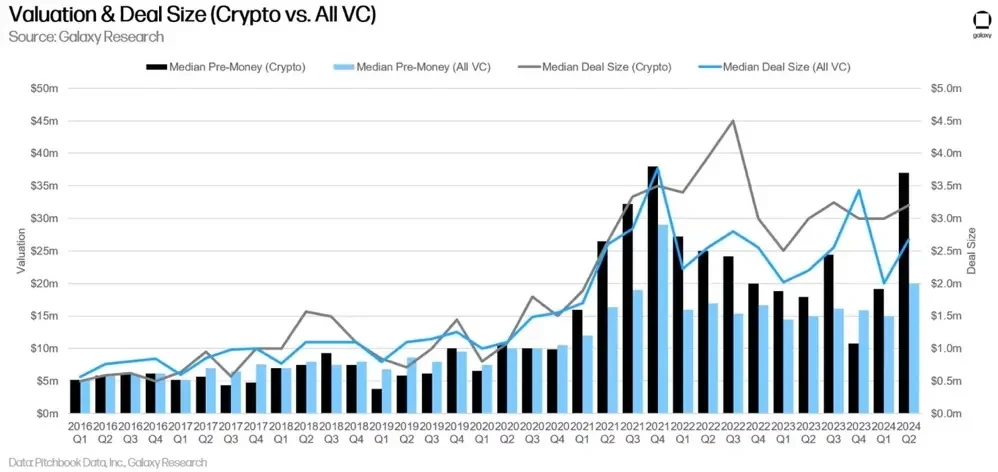
Galaxy Digital Q2加密风投报告:反弹仍在持续,与上一轮牛市还有差距

估值与交易规模

2023 年,风险投资支持的加密货币公司估值大幅下降,第四季度更是降至 2020 年第四季度以来的最低投前估值中值。不过,到了 2024 年第一季度,风投支持的加密货币公司的估值开始反弹,第二季度飙升至 3700 万美元(环比增长 94% ),达到 2021 年第四季度以来的最高水平。需要注意的是,随着更多数据的出现,报告的延迟性以及公开估值数据的缺乏会导致上述数据出现大幅波动。我们努力在季度结束后及时提供这些信息,因此数据可能会有修正,但这一峰值仍是一个信号。此外,交易规模的中位数环比略有上升(+ 7% ),达到 320 万美元,与过去五个季度基本持平。估值的上升源于市场情绪的改善;尽管投资资本没有显著增加,但创始人们抓住了现有投资者群体的兴趣和竞争。
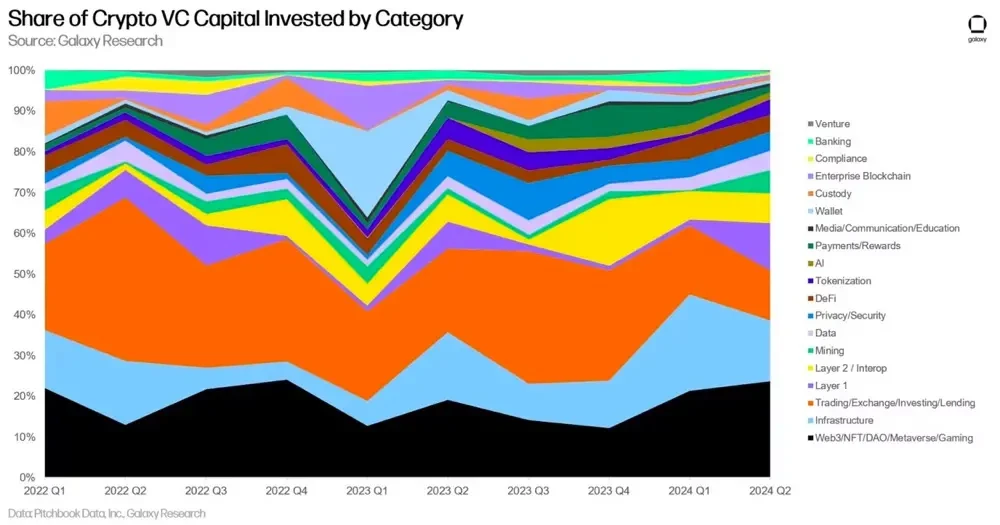
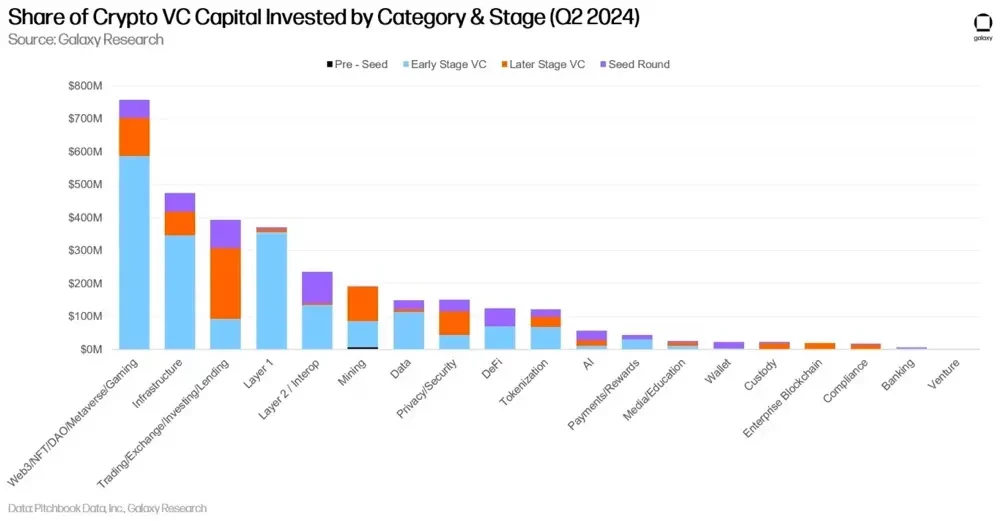
Galaxy Digital Q2加密风投报告:反弹仍在持续,与上一轮牛市还有差距

投资类别

2024 年第二季度,「 Web3 / NFT / DAO / 元宇宙 / 游戏」类别的加密货币公司和项目筹集到的加密风投总额达 7.58 亿美元,在所有类别中占比最大(24% )。该类别中最大的两笔交易是 Farcaster 和 Zentry ,分别筹集了 1.5 亿美元和 1.4 亿美元。

Galaxy Digital Q2加密风投报告:反弹仍在持续,与上一轮牛市还有差距

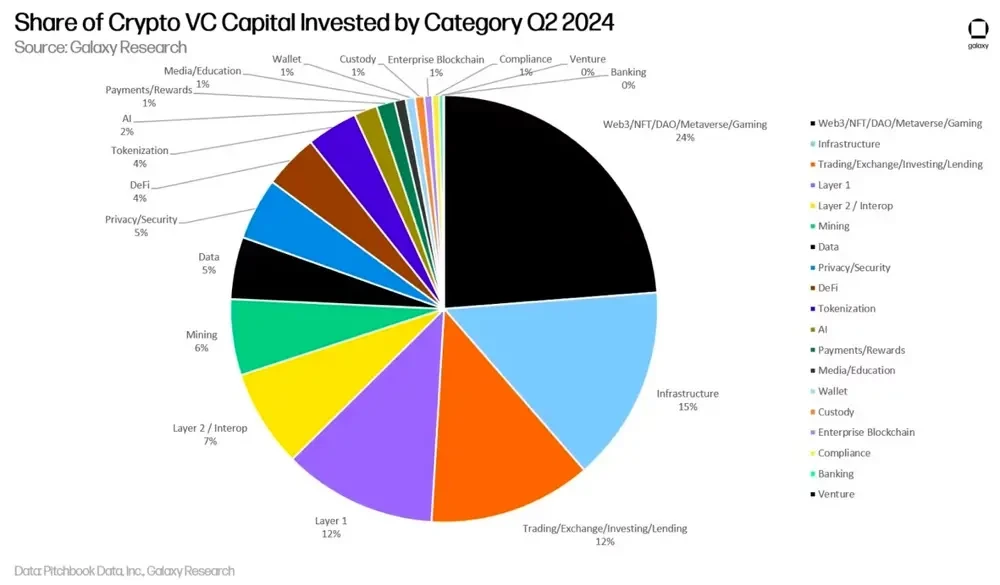
紧随其后的是与基础设施、交易和 L1 相关的公司 / 项目,投资额分别占 15% 、 12% 和 12% 。值得注意的是,由于 Monad 和 Berachain 分别筹集了 2.25 亿美元和 1 亿美元, L1 类别投资资本的市场份额增长了 6 倍多。此外,比特币 L2 在 2024 年第 2 季度筹集了 9460 万美元,环比增长 174% (第 1 季度为 3470 万美元)。
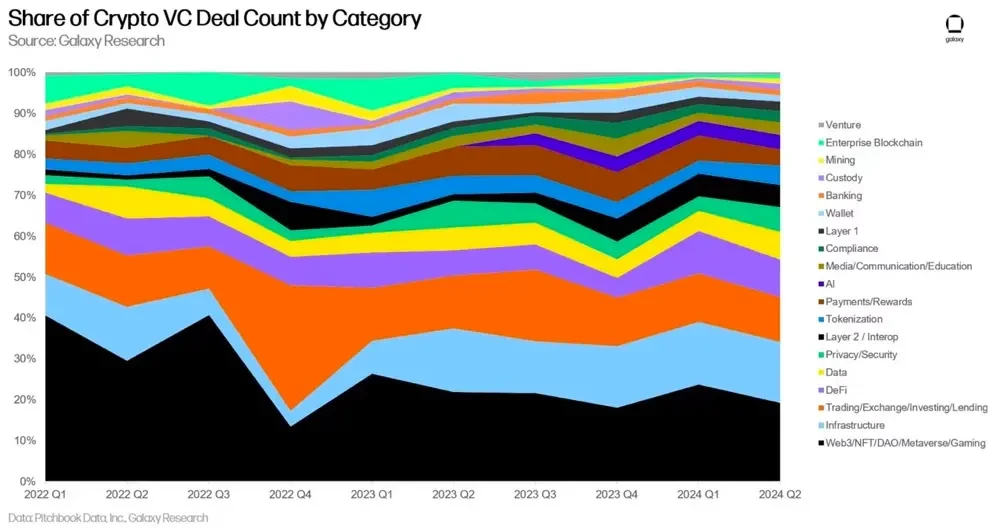
Galaxy Digital Q2加密风投报告:反弹仍在持续,与上一轮牛市还有差距

交易数量的类别划分

在交易数量方面,「 Web3 / NFT / DAO / 元宇宙 / 游戏」类别以 19% 的比例遥遥领先,这主要得益于去中心化社媒和游戏相关交易的增加。虽然 2024 年第二季度与再质押相关的加密初创公司进行融资的数量有所减少,但基础设施类别的交易数量在本季度排名第二,占 15% 。

Galaxy Digital Q2加密风投报告:反弹仍在持续,与上一轮牛市还有差距

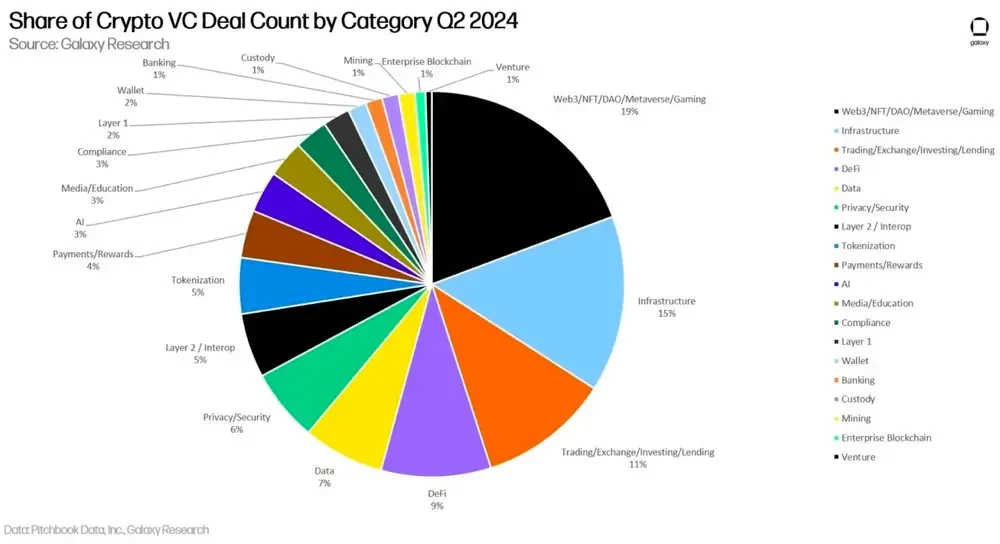
紧随其后的是与交易和 DeFi 相关的加密货币公司 / 项目,分别占 2024 年第二季度完成交易总数的 11% 和 9% 。
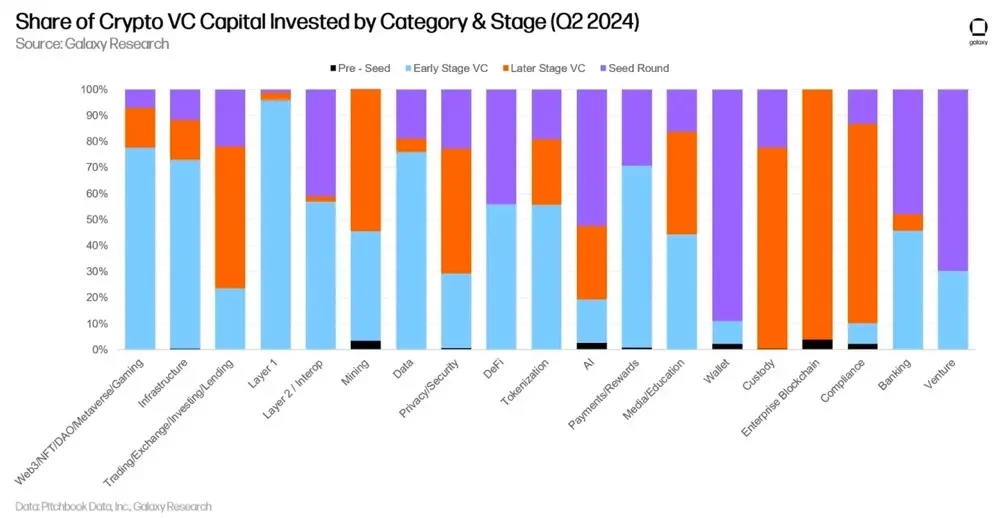
Galaxy Digital Q2加密风投报告:反弹仍在持续,与上一轮牛市还有差距

风投的阶段和类别划分

按阶段和类别细分投资资本和交易数量,可以更清楚地了解每个类别中哪些类型的公司正在筹集资金。2024 年第二季度, Web3 、 L1 和基础设施类别的绝大多数资金都投向了早期公司和项目,而交易类别的风险投资更多投向处于融资后期阶段的公司。

Galaxy Digital Q2加密风投报告:反弹仍在持续,与上一轮牛市还有差距

通过研究各阶段投资于各类别的资本份额,可以深入了解各类可投资资本的成熟度。

Galaxy Digital Q2加密风投报告:反弹仍在持续,与上一轮牛市还有差距

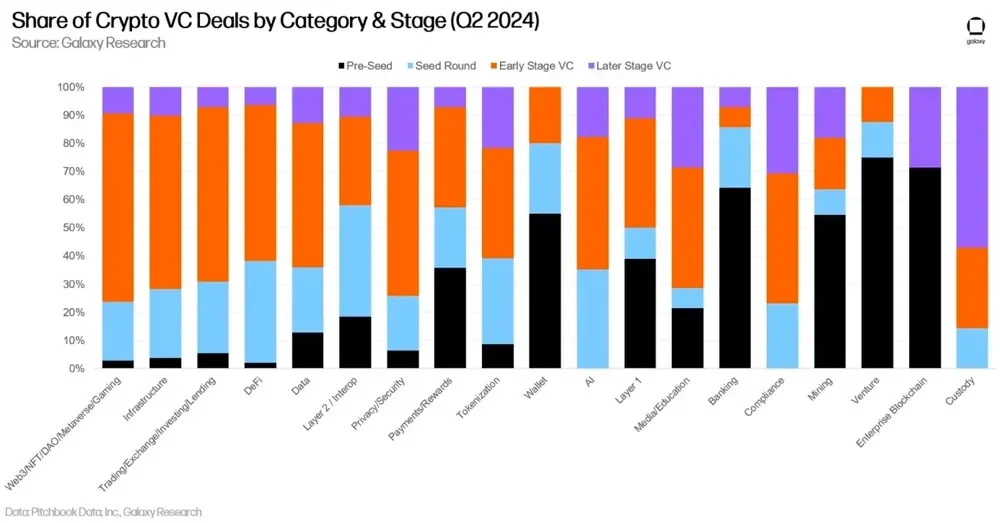
此外,交易数量也说明了类似的情况。几乎所有类别已完成的交易中,有相当一部分涉及早期公司和项目。

Galaxy Digital Q2加密风投报告:反弹仍在持续,与上一轮牛市还有差距

通过研究各类别中各阶段完成的交易份额,可以深入了解每个可投资类别的各个阶段。
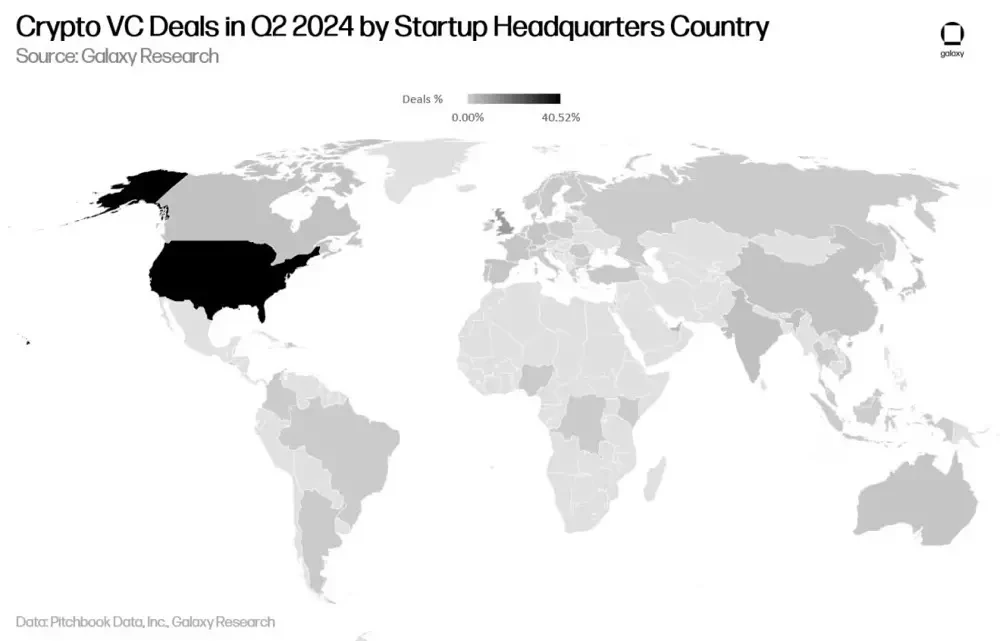
Galaxy Digital Q2加密风投报告:反弹仍在持续,与上一轮牛市还有差距

按地理位置划分投资

投资数量上, 2024 年第二季度,超过 40% 的风投投向了总部位于美国的公司。英国占 10% ,新加坡占 8.7% ,阿联酋占 3.13% ,香港占 2.78% 。

Galaxy Digital Q2加密风投报告:反弹仍在持续,与上一轮牛市还有差距

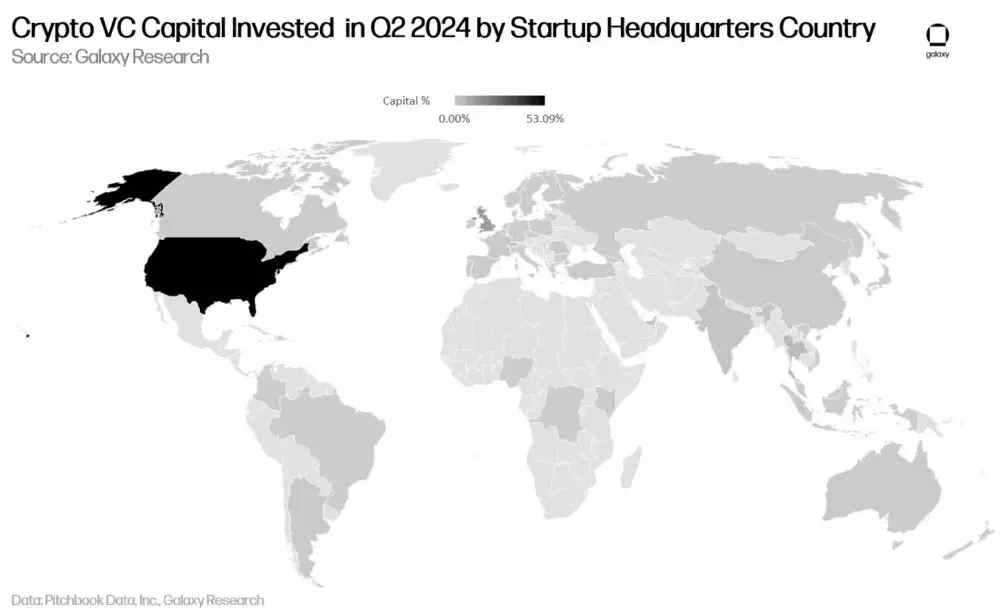
投资金额上,总部位于美国的公司吸引了 53% 的风投,环比增长 23.5% 。英国占 12.78% ,新加坡占 4.6% ,阿联酋占 4.39% 。
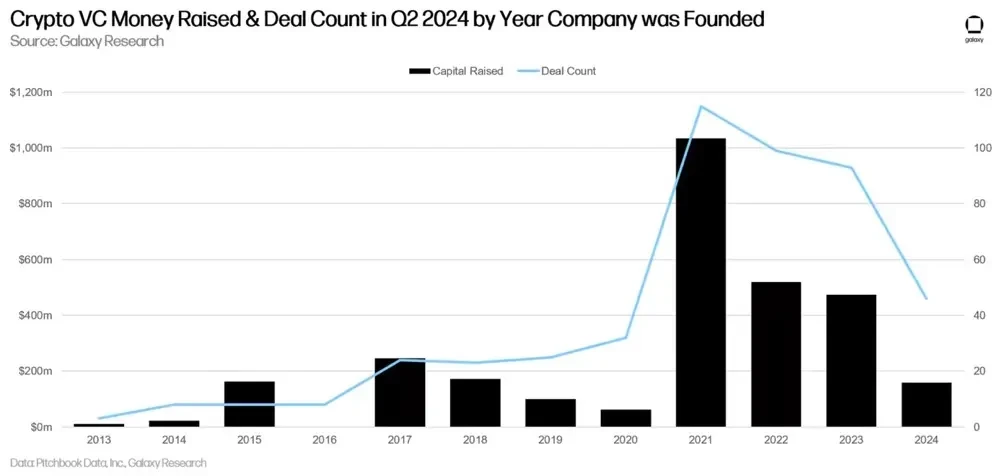
Galaxy Digital Q2加密风投报告:反弹仍在持续,与上一轮牛市还有差距

按群组划分投资

2024 年第二季度的绝大多数风投都投向了于 2021 至 2023 年间成立的公司。

Galaxy Digital Q2加密风投报告:反弹仍在持续,与上一轮牛市还有差距

总结

加密风险投资情绪继续改善,但水平仍明显低于 2021-2022 年的牛市。随着比特币和以太坊在今年上涨约 50% ,投资资本环比增长 28% ,而交易数量基本持平。如果这一增速持续到年底,那么 2024 年的投资资本和交易数量将仅次于 2021 年和 2022 年,位居第三。

Web3 和 L1 类别的投资引人注目。在 Farcaster (1.5 亿美元)和 Zentry (1.4 亿美元)的推动下, Web3 类别以约 7.5 亿美元的融资总额遥遥领先。而在 Monad (2.25 亿美元)和 Berachain (1 亿美元)交易的带动下, L1 以 3.71 亿美元的成绩位居第四。

获得风投的加密货币企业的估值中值大幅飙升,已达到 2021 年第四季度(上一轮牛市的顶峰)以来的最高值。受 2022 年熊市及宏观经济的不利因素影响,目前大多数普通风投机构仍处于观望状态,而专注于加密货币的风投机构则处于竞争加剧的环境中,为项目创始人们提供了更多谈判筹码。需要注意的是,该中位数是根据截至 7 月 1 日的可用数据得出的,随着第二季度交易信息的增多,中位数可能会有所更新,并有可能向下调整。

比特币 L2 继续获得大量投资,相关公司和项目共筹集 9460 万美元,环比增长 174% 。投资者们对比特币生态将出现更多可组合区块空间、吸引 DeFi 和 NFT 等模式回归生态的热情依然高涨。我们的内部研究表明,至少有 65 个项目自称是「比特币 L2 」。

早期交易在第二季度独领风骚,获得近 80% 的投资资本,且 Pre - Seed 轮交易占所有交易的 13% 。对早期交易的持续关注预示着更广泛的加密货币生态的长期健康发展。虽然一些处于后期阶段的公司在融资方面举步维艰,但企业家们正在为新的创新理念寻找愿意投资的投资者。

美国继续主导加密货币创业生态。虽然美国在交易和资本方面保持着明显的领先优势,但监管方面的不利因素可能会迫使更多公司转移到其他国家和地区。美国若想长期保持技术和金融创新中心的地位,政策制定者就需要意识到他们的作为或不作为会如何影响加密货币和区块链生态。

Leituras Relacionadas

Bitcoin at 59,000 Is Not the Bottom, One Last Drop Needed! Chain Data and Liquidity Analysis: Where is BTC's True Bottom?

Based on analysis by trader Mr. Beggar, Bitcoin's (BTC) recent low of $59k is likely not the final cycle bottom. He argues that while a bottom is near, a final downward movement is still probable to target liquidity below that level, making a deeper low healthier for a sustainable reversal. Mr. Beggar's framework combines on-chain data for long-term cycles and liquidity-based technical analysis for shorter-term trades. His "four deep bear buying models" include Cointime Price (market cost weighted by coin holding time) and AVIV (an enhanced MVRV indicator), which currently suggest prices are nearing cyclical bottom zones. While a PSIP (Percent Supply in Profit) signal has flashed below 50%, it alone is not considered definitive; typically, the first signal is not the final bottom. He presents three potential scenarios for the current market: 1) a direct drop from here, 2) an upward liquidity sweep (stop hunt) of the recent high near $67.3k before declining, and 3) a direct reversal without new lows. He heavily discounts the third scenario due to significant un-swept liquidity in the $59k-$62.3k range, suggesting the market must revisit these levels. Mr. Beggar shares that he used on-chain signals to identify potential cycle tops in late 2024/early 2025 and later established low-leverage BTC-denominated short positions. He emphasizes the importance of risk management and staying within one's expertise ("strike zone"), warning against investing in assets like AI/semiconductor stocks simply because they are rising.

marsbitHá 28m

Bitcoin at 59,000 Is Not the Bottom, One Last Drop Needed! Chain Data and Liquidity Analysis: Where is BTC's True Bottom?

marsbitHá 28m

From Signal Monitoring to Strategy Copy Trading: How PPP Lowers the Barrier to Trading on Polymarket?

From Signal Monitoring to Strategy Copy Trading: How PPP Lowers the Barrier to Polymarket Trading The surge in trading demand on prediction markets like Polymarket, especially during events like the World Cup, exposes a common challenge for novice users: emotional and impulsive trading due to a lack of stable strategies and reliable signals. Prediction Position Platform (PPP) addresses this by serving as a Telegram-based tool for strategy discovery and automated copy-trading on Polymarket. PPP offers a suite of features through a subscription model. Key functionalities include 24/7 market signal monitoring (tracking smart money movements and rapid probability shifts), an "AI Address Analysis" tool to evaluate trader performance metrics, and specialized sections like a "World Cup Zone" for quick access to related markets. Its core value lies in two curated lists: the "Strategy Square," which identifies addresses suitable for long-term tracking based on comprehensive metrics like returns, win rate, and drawdowns, and the "Trading Leaderboard," highlighting recently outperforming addresses for short-term opportunities. Users can manually analyze any address or set up automated copy-trading with customizable parameters like investment amount and stop-loss. After initiating copy-trades, users can manage all positions from a unified dashboard, adjusting parameters or stopping follows as needed, and review historical performance data. Crucially, PPP employs a non-custodial wallet model, meaning user funds remain in their own self-custodied wallets, enhancing security and trust. In summary, PPP aims to reduce the learning curve and trial-and-error cost for Polymarket users by aggregating signals, curating and analyzing profitable traders, and facilitating automated, yet manageable, copy-trading execution.

Odaily星球日报Há 28m

From Signal Monitoring to Strategy Copy Trading: How PPP Lowers the Barrier to Trading on Polymarket?

Odaily星球日报Há 28m

From the White-Haired Stock God to the Billion-Dollar Fund Titan: The Smart People Shorting NVIDIA Are Getting Rich Using the Same Framework

From "white-haired stock god" to billionaire fund manager, those profiting from shorting NVIDIA share a common framework. The article analyzes the critical bottlenecks in the AI hardware supply chain, which have become key investment focal points. The core argument is that the real constraint on the AI boom isn't software or algorithms, but fundamental physical infrastructure. The piece dissects nine major bottlenecks, organized around the lifecycle of an AI accelerator circuit board. *Before the Board*: The pre-manufacturing stage faces constraints in EDA tools, new materials (like GaN, SiC, InP) replacing silicon, and the critical, non-renewable supply of helium for semiconductor fabrication. *On the Board*: The primary bottlenecks are High-Bandwidth Memory (HBM), essential for unleashing GPU power, and advanced packaging (e.g., CoWoS), required to integrate components. Both are in severe shortage. *Between Boards*: Chip-to-chip communication is hitting limits with copper, pushing photonics and optical interconnects (CPO) as the next-gen solution, with NVIDIA heavily investing in this area. *Around the Board*: Power delivery requires new materials (GaN/SiC) for efficient voltage conversion from 48V to sub-1V. High-density AI racks (120kW+) are forcing a shift from air to liquid cooling as the standard. *Beyond the Board*: The ultimate bottleneck is electricity. AI data centers consume power equivalent to mid-sized cities, and grid expansion lags far behind demand, causing project delays and a scramble for power contracts. Prominent investors like Leopold and "white-haired stock god" are heavily betting on these infrastructure bottlenecks. Leopold's fund, for instance, holds no NVIDIA stock but uses massive put options to short the semiconductor sector while going long on power and physical infrastructure. His thesis is that while chip competition may eventually erode margins, the scarcity of foundational elements like electricity is more persistent. The framework's validity is tied to the supply-demand gap. Major new capacity in HBM and photonics is scheduled for 2027-2028, but demand continues to outpace it. Experts like Intel's CEO suggest no relief before 2028. However, the article warns of a potential reversal around 2028-2029 if AI capex slows and new capacity floods the market, turning scarcity into oversupply. Until then, the imbalance persists.

链捕手Há 59m

From the White-Haired Stock God to the Billion-Dollar Fund Titan: The Smart People Shorting NVIDIA Are Getting Rich Using the Same Framework

链捕手Há 59m

Trading

Spot
Futuros
活动图片