Bitcoin Supply In Loss Reaches Highest Value Since COVID Crash

BitcoinistPublicado em 2022-04-29Última atualização em 2022-04-29

Resumo

On-chain data shows the amount of Bitcoin supply in loss has now risen to the highest value since the COVID-19...

On-chain data shows the amount of Bitcoin supply in loss has now risen to the highest value since the COVID-19 crash.
Bitcoin Supply In Loss Now Measures Around 7.6M BTC
As pointed out by an analyst in a CryptoQuant post, the BTC supply in loss hasn’t shown such high values since the first half of 2020.
The “BTC supply in loss” is an indicator that measures the total amount of Bitcoin that’s currently being held at a loss.
The metric works by checking the on-chain history of each coin to see what price it was last moved at. If this earlier price was greater than the current value, then the coin is counted as being in loss.
When the value of this metric goes up, it means more investors are coming into the red. High values are usually observed following crashes in the price of the crypto.
On the other hand, a downtrend in the indicator would suggest more of the Bitcoin supply is coming into the green.
Now, here is a chart that shows the trend in the BTC supply in loss over the past few years:

Bitcoin Supply In Loss

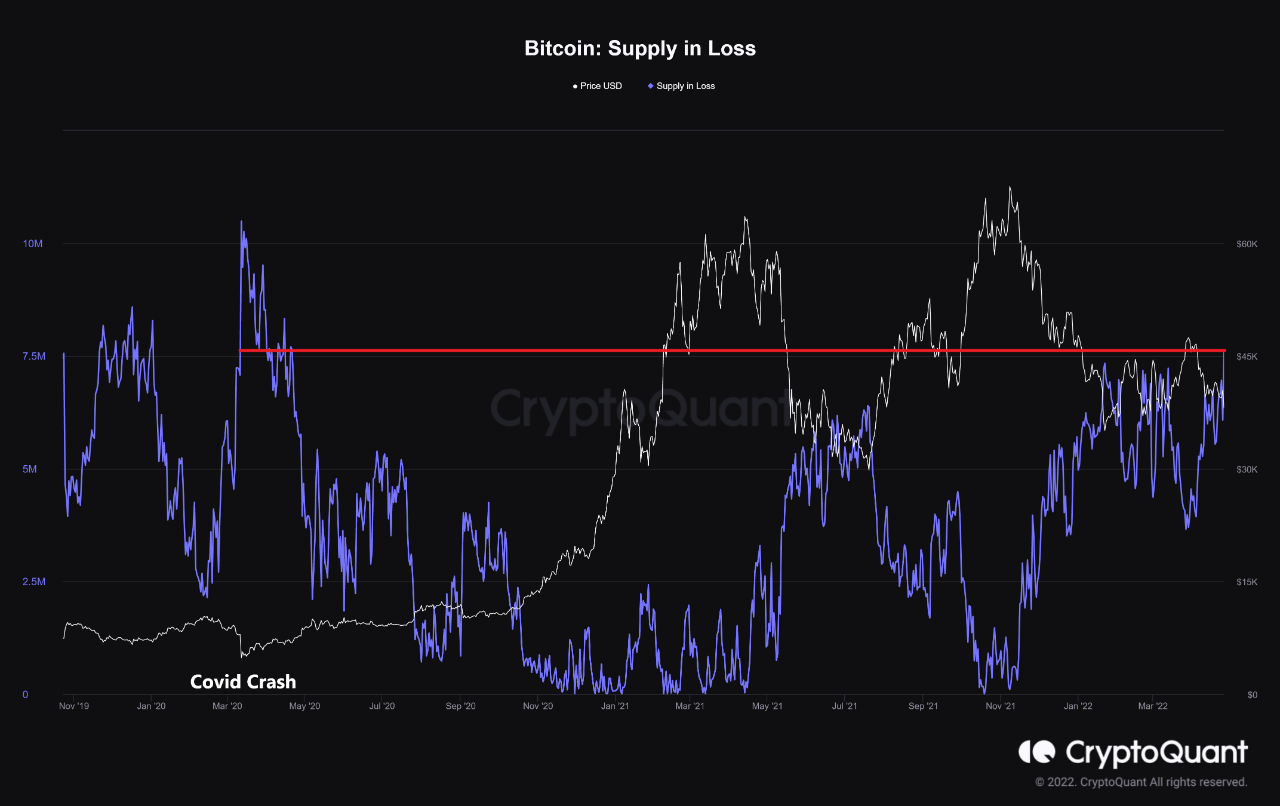
Looks like the value of the indicator has risen recently | Source: CryptoQuant
As you can see in the above graph, the Bitcoin supply in loss has observed an uplift in recent weeks. The metric’s value is now around 7.6 million BTC.
Such a high value hasn’t been seen since the first half of 2020, where the COVID-19 crash rapidly sent supply into loss.
Usually, as coins get more into the red, investors become more likely to capitulate in order to cut off their losses and exit the market.
It remains to be seen how holders react to such a large portion of the supply being in loss this time as it has been a while since the market last observed such a trend.
BTC Price
At the time of writing, Bitcoin’s price floats around $39.6k, down 6% in the last seven days. Over the past month, the crypto has lost 15% in value.
The below chart shows the trend in the price of the coin over the last five days.

Bitcoin Price Chart

The price of BTC seems to be slowly rebounding back from the plunge a couple of days back | Source: BTCUSD on TradingView
Bitcoin showed a brief sign of upwards momentum a few days back, but it wasn’t long until the coin dropped back to the below $40k levels.
At the moment, it’s unclear when the crypto may see any real recovery and escape this seemingly endless consolidation.

Leituras Relacionadas

Bitcoin Trading Strategy Breakdown: Celebrity Predictions and Classic Models All Fail, Only These Four Indicators Remain

Analysis of Bitcoin Trading Strategies: Why Celebrity Forecasts and Classic Models Fail, Leaving Only These Four Reliable Indicators This analysis examines the failure of common Bitcoin prediction methods and identifies four reliable indicators for constructing a trading strategy. The author reviewed all major BTC prediction approaches from 2017-2025, categorizing them into three groups: celebrity price targets (consistently over-optimistic), analytical models like Stock-to-Flow (broken post-2022), and on-chain signals. The key finding is that more data often creates confusion, not clarity. The strategy discards unreliable elements: celebrity predictions (incentivized to be extreme), pure models (invalidated by post-ETF market changes), and the Fear & Greed Index used alone (too many false signals). Four reliable indicators were selected: 1. **MVRV Z-Score:** Accurately identifies cycle bottoms when entering its green zone (e.g., 2018, 2020, 2022). Note: Its ability to call tops is now ineffective post-2024. 2. **SOPR (28-day MA):** Consistently signals bottoms when below 1.0, indicating holders are selling at a loss. 3. **ETF Net Flow:** A crucial post-2024 metric showing institutional momentum (e.g., sustained inflows = buying). 4. **Macro Liquidity (Fed policy & M2):** Sets the overall directional bias (e.g., bullish during easing cycles). The core strategy involves waiting for a multi-signal共振 (resonance). For example, a bottom signal requires MVRV in the green zone + SOPR < 1.0. A top signal requires overheated on-chain data + sustained ETF outflows. Macro policy sets the overall direction. The Fear & Greed Index is only used as a weighted confirmatory signal, never alone. Action is only taken when three or more indicators align. The author automated this into a monitoring system that sends Telegram alerts only when signals trigger. As of the article's date (April 15, 2026), the system showed a strong bottom signal: extreme fear (F&G=12), MVRV in the buy zone, and SOPR < 1.0. The only contrary signal was weak ETF flows. Historically, such triple on-chain共振 has preceded 100%+ returns. The conclusion emphasizes building a personal framework over relying on external predictions, allowing for iterative improvement and customization based on individual risk tolerance.

marsbitHá 2h

Bitcoin Trading Strategy Breakdown: Celebrity Predictions and Classic Models All Fail, Only These Four Indicators Remain

marsbitHá 2h

Trading

Spot
Futuros
活动图片