长推:2023年的RWA会是2019年的DeFi吗?

MarsBitPublicado em 2023-07-10Última atualização em 2023-07-10

Resumo

窃以为面向下一轮牛市的投资组合,应该将RWA和LSDfi 纳入资产配置表

注:本文来自@0xNing0x 推特,其是独立加密分析师,原推文内容由MarsBit整理如下:
2023年的RWA会是2019年的DeFi吗?
旧瓶装新酒,这是RWA在2023年给市场的普遍观感,这也恰是DeFi在2019年给市场的普遍观感
上一轮熊市,许许多多的加密投资者因为“旧瓶装新酒”的判断,而错过了DeFi的早期投资机会
那么错过2023年的RWA,会让我们再次在下个牛市拍断大腿吗?
这个问题很难回答。但作为一个市场经历两轮牛熊而幸存至今的老韭菜,我的直觉告诉我,需要首先放下傲慢和偏见,去认真调查研究 RWA,再审慎理性地加以判断
1 RWA的过去与现在:泛化==》具体
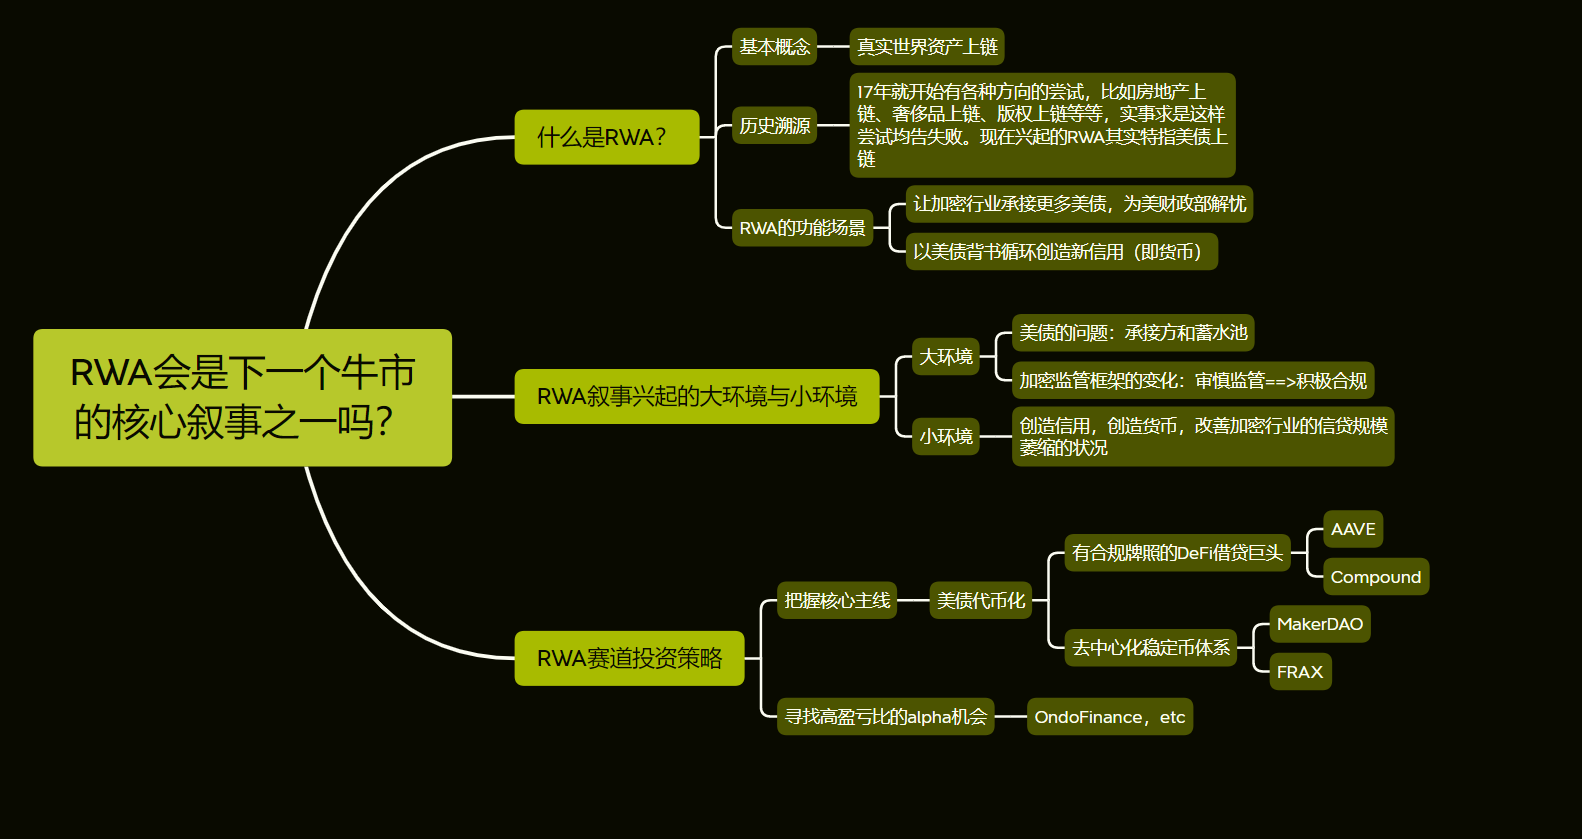
RWA(Real World Asset,真实世界资产)并没有一个权威的共识定义,我们这里使用指事法直接定义RWA,RWA即真实世界资产上链,Token化真实世界资产
它的一般架构分为链上和链下两部分:
--链上部分:支持智能合约的公链或者L2+获取真实世界资产价格和状态的预言机+实现RWA功能交互的一组智能合约等
--链下部分:真实世界资产托管机构、审计机制、保险机制等
如上所说,RWA并非是一个新概念,它在17年、18年的ICO风潮中就已经红极一时。当时有很多房地产上链、奢侈品上链、内容版权上链等项目,这些项目在各种方向上进行了尝试和探索,但后来均已被市场证伪
而23年再度兴起的RWA叙事,其内涵已非泛化的真实世界资产上链,而是局限于美债代币化
目前加密世界的美债代币化有3种路径:
--中心化稳定币的储备资产美债化。据公开信息,USDT、USDC、BUSD的发行方已经~80%的储备资产转换美债,估计这三家持有的美债总规模~$960亿美元,已经超越巴菲特的伯克希尔哈撒韦公司。这也是为什么加密KOL们戏称RWA龙头应该是USDT的原因。
--去中心化稳定币DAI在储备资产引入Token化美债。6月21日,MakerDAO动用协议金库资金买入$7亿美债,该行为被市场解读为协议金库的资产多元化配置
但其实据http://daistats.comhttp://makerburn.com网站平台数据,RWA早已纳入DAI的资产负债表,成为铸造DAI的抵押资产之一
目前狭义的RWA资产(代币化美债)在DAI抵押资产的占比为39.7%。如果我们把USDC和USDP也看做一种RAW资产的话,这一比例将上升至55%
--OndoFinance的美债代币化+货币市场基金。
OndoFinance是面向合规的专业投资者和机构的美债代币化平台
在通过严格的KYC和平台审核之后,投资者可以使用加密资产购买该平台发行的代币化美债$OUSG
$OUSG可以在OndoFinance旗下的去中心化货币市场FLUX借贷其它稳定币
但出于合规的需求,OndoFinance有意限制了$OUSG的自由度和可组合性
2 RWA再度兴起的大环境和小环境
--宏观大环境
6月1日,美国参议院通过债务上限法案,美债供给迅速突破$32万亿,10年期美债收益率(即折价率)持续攀升至4.05%高位,美国金融监管当局急需增发美债的承接力量
而环顾全球,只有两股可靠的力量有可能承接新发美债,一股力量是中国,这是主要的;另一股力量就是我们加密世界
而在3月银行危机结束之后,美国金融监管当局对加密的不友好政策逐渐清晰,监管原则从审慎监管转变为积极合规监管
在这样的宏观环境下,加密世界积极推动美债代币化,未尝不是一种变相地向美国金融监管当局“磕头”和输诚,是一种积极的生存策略
--行业小环境
事实上,我们可以将稳定币视作加密世界的基础货币,将DeFi借贷协议的TVL和CeFi借贷平台的AUM视作加密世界的信贷余额
在经历2022年的熊市洗礼后,中心化稳定币从高峰期的~$1400亿跌至目前的~$1200亿,跌幅14.28%,萎缩并不严重
但为什么我们会觉得市场的流动性萎缩非常严重呢?
这是因为加密世界的信贷规模在同期萎缩极为严重。这主要是因为LUNA\UST和Celsius的爆雷,引发加密世界两大信用创造神器算法稳定币和CeFi平台的全面崩盘
在3家美国加密友好银行破产关闭之后,在BUSD被美国金融监管格局勒令停止新增发行之后,在可预期的未来中心化稳定币规模很难重新恢复正增长
在加密世界基础货币增长受限的情况下,行业通过引入代币化美债尝试两个方向的探索:
--既然中心化稳定币扩张受限,那就优先恢复去中心化稳定币的扩张。如MakerDAO将代币化美债引入DAI资产端,创造新的DAI
--通过代币化被全球视作无风险资产的美债,为DeFi借贷协议增信和增厚收益,在合适的时机以代币化美债为基础重新启动DeFi乐高循环创造信用,恢复加密世界的信贷规模
3 RWA赛道的投资策略
如果我们以Gartner新兴技术成长曲线观察,2023年的RWA可能正处于2019年的DeFi所在的阶段,即从泡沫破裂谷底期==>稳步爬升复苏期
RWA和LSDfi一样是房间内的大象,是加密世界投资的两张明牌,却往往会被大家熟视无睹
窃以为面向下一轮牛市的投资组合,应该将RWA和LSDfi
纳入资产配置表
声明:以上内容不作为投资建议,仅供参考。

RWA

Leituras Relacionadas

Both Suffer Massive Losses Exceeding $90 Billion, Which Is in Greater Peril: Strategy or Bitmine?

Facing massive paper losses exceeding $90 billion each amidst a sharp market downturn, "Digital Asset Treasury" (DAT) giants Strategy and Bitmine find themselves in a precarious position, but with different underlying risks. Strategy, heavily invested in Bitcoin (BTC), faces significant financial strain. Its strategy relies heavily on debt, including convertible notes and preferred stock (STRC) requiring substantial dividend payments. With its cash reserves dwindling and BTC offering no staking yield for cash flow, Strategy's high leverage makes it vulnerable. A continued price decline could force asset sales to meet obligations, potentially creating a negative feedback loop. Its market value has already fallen sharply. In contrast, Bitmine, an Ethereum (ETH) holder, appears on firmer financial ground. It primarily funds its purchases through equity offerings (like ATM programs), avoiding debt pressure. It also generates income by staking a large portion of its ETH holdings. While not immune to market drops and shareholder dilution concerns, Bitmine maintains more flexibility, recently announcing a new preferred share offering to raise further capital. The core divergence lies in their financing: Bitmine uses equity (investor money), while Strategy uses debt (borrowed money). Consequently, Bitmine currently faces less immediate liquidity pressure than Strategy, which must navigate the dual challenge of servicing debt/dividends and a declining core asset (BTC) price.

marsbitHá 3m

Both Suffer Massive Losses Exceeding $90 Billion, Which Is in Greater Peril: Strategy or Bitmine?

marsbitHá 3m

Where the AI Bubble Really Is: Which Layer of Players Are Naked

AI Bubble: Where It Really Is and Who's Swimming Naked This analysis dissects the AI industry not as a single entity but as a five-layer pyramid, arguing that bubbles are concentrated in specific tiers, not uniformly distributed. **Key Distinction from the 2000 Dot-com Bubble:** Unlike 2000, where companies had stock prices before revenue, today's leading AI players have massive, contract-backed revenue driving their valuations. Core infrastructure demand is real, with every GPU running at full capacity for paying customers. **The Five-Layer Pyramid & Bubble Assessment:** * **L0 (Fab/Manufacturing) & Top L4 (Leading AI Apps): NO BUBBLE.** Companies like TSMC, NVIDIA, major cloud providers (Microsoft, Google, Meta, Amazon), and top AI labs have real revenues and orders. Supply is tightly constrained by TSMC's disciplined capacity control and physical limits like power/land for data centers, preventing a supply glut. * **L1 (Memory): BATTLEGROUND.** Sky-high HBM margins could signal a new structural cycle or a classic "boom before bust." The oligopoly of three major players may enforce supply discipline, making this a high-stakes bet. * **L2 (Interconnect/Optical Modules): BUBBLE TERRITORY.** Companies like Lumentum and AAOI have seen stock surges (4-10x) far outpacing revenue growth. This hardware segment has lower physical barriers to expansion than fabs, allowing speculation. It mirrors the 2000 bubble's epicenter—optics. * **L3 (Infrastructure/"GPU Landlords"): VULNERABLE.** GPU leasing companies profit from the current compute shortage but own no long-term moat. Their business model relies on a temporary bottleneck that will ease as big tech expands and new tech (e.g., potential space-based data centers) emerges. * **L4 Long Tail (VC-backed Startups): STRONG BUBBLE SIGNALS.** VC funding concentration in AI is twice that of the 1999 peak. Many startups with little revenue use the valuation logic of successful giants to justify their own, creating high risk of a "valuation crunch" when funding dries up. **Critical Risks to Monitor:** 1. **GPU Depreciation & Accounting:** Companies extending the assumed useful life of GPUs artificially boost profits. The true economic life depends on future generational leaps from NVIDIA. 2. **"GPU Credit" & Off-Balance-Sheet Leverage:** Emerging structures where shell companies borrow to buy GPUs and lease them out (with chipmakers sometimes investing) move debt off major balance sheets. This echoes the "vendor financing" of 2000 and the securitization risks of 2008, though currently small-scale. 3. **TSMC Abandoning Caution:** If the primary supply bottleneck (TSMC's conservative capacity planning) breaks, runaway supply could trigger a bust. 4. **Algorithmic Efficiency Breakthrough:** A major leap in software efficiency could drastically reduce the need for raw compute hardware, undermining the investment thesis. **Conclusion:** The AI boom is expensive and has frothy areas, but its core is underpinned by real demand and physical supply constraints. The bubble risk is layered: most present in optical components, GPU leasing, and the long-tail startup ecosystem, while the foundational chip manufacturing and leading application layers remain relatively solid—for now.

marsbitHá 16m

Where the AI Bubble Really Is: Which Layer of Players Are Naked

marsbitHá 16m

Standing in the Light: A Comprehensive Guide to the Optical Module and CPO Supply Chain

"Standing in the Light: Understanding the Optical Module and CPO Industry Chain" This article analyzes the critical role of optical communication technology, specifically optical modules and Co-Packaged Optics (CPO), as the "nervous system" for modern AI data centers. With exponential growth in AI computational demands (e.g., NVIDIA's Vera Rubin architecture), traditional electrical interconnects using copper cables face severe bottlenecks in bandwidth, power consumption, and signal integrity over distance. The core function of an optical module is to act as a "translator," converting electrical signals from chips into optical signals for transmission over fiber (and vice-versa). Key internal components include lasers, modulators, photodetectors, drivers, and DSP chips. The industry is currently transitioning from 800G to 1.6T modules. However, the future lies in CPO. This next-generation technology integrates the optical engine directly with the switch ASIC/XPU on the same package substrate, drastically reducing power consumption (by ~3.5x according to NVIDIA), overcoming bandwidth density limits, and minimizing signal attenuation compared to traditional pluggable modules. Key challenges for CPO include advanced packaging capacity (dominated by TSMC), thermal management, repairability, and standardization. The article details the broader technology landscape, including Near-Packaged Optics (NPO, a pragmatic intermediate step), Linear-drive Pluggable Optics (LPO), Optical I/O (OIO for chip-level integration), and Optical Circuit Switches (OCS). A comprehensive CPO industry chain is mapped, highlighting shifting power dynamics: * **Architecture Definers:** NVIDIA, Broadcom, and Marvell now hold greater influence. * **Advanced Packaging & Manufacturing:** TSMC is central; Fabrinet is a key EMS player. * **Lasers ("The Heart"):** A strategic bottleneck. EML lasers are led by Lumentum and Coherent (both receiving major NVIDIA investments). CW lasers, favored for CPO/silicon photonics, see strong Chinese players like Source Photonics and Sicoya. * **Silicon Photonics Chips:** The mainstream path for CPO engines, with key players like Broadcom, Intel, Marvell, and China's Accelink. * **Fiber Connectivity Components:** A major new, high-growth market created by CPO, including Fiber Array Units (FAU), Polarization-Maintaining Fiber (PMF), and MPO connectors. Companies like Tianfu Communication and US Conec are leaders. * **Fiber & Cable:** Experiencing a super-cycle (e.g., Corning, Yangtze Optical Fiber). * **PCB/Substrates:** Requiring advanced materials (e.g., Shengyi Tech). * **DSP & SerDes:** Functions are integrated into switch ASICs in the CPO era (e.g., Broadcom, Astera Labs). * **Optical Module Makers:** Transitioning from standalone module suppliers to providers of optical engines and NPO/LPO solutions while riding the current pluggable boom (e.g., Zhongji Innolight, Eoptolink). The investment timeline is segmented: Short-term (2026-2027) features the "last feast" for pluggable modules and CPO's initial rollout. Medium-term (2027-2029) will see CPO expand and NPO peak. Long-term (2029-2032+) involves CPO/OIO penetration into intra-rack scaling. In conclusion, optical interconnects are fundamental to AI infrastructure. The competitive landscape sees US firms leading in architecture and high-end chips, TSMC in advanced packaging, and Chinese firms holding strong positions in modules, connectivity components, CW lasers, and fiber/cable. The future belongs to companies that can navigate the technological shift from "selling shovels" (modules) to "building highways" (CPO/OIO infrastructure).

marsbitHá 26m

Standing in the Light: A Comprehensive Guide to the Optical Module and CPO Supply Chain

marsbitHá 26m

Trading

Spot
Futuros
活动图片