Data Shows Bitcoin Investors Afraid To Take Risk As Leverage Remains Low

newsbtcPublicado em 2022-04-01Última atualização em 2022-04-01

Resumo

On-chain data shows Bitcoin investors have been afraid to take risk recently as the leverage ratio has remained low in the last few days. Bitcoin Leverage Ratio Remains Low In...

On-chain data shows Bitcoin investors have been afraid to take risk recently as the leverage ratio has remained low in the last few days.
Bitcoin Leverage Ratio Remains Low In Past Few Days
As pointed out by an analyst in a CryptoQuant post, investors haven’t taken much risk since the surge in the crypto’s price a few days back as leverage in the market is low at the moment.
A relevant indicator here is the “open interest,” which shows the total amount of Bitcoin futures contracts currently open on all derivatives exchanges.
The “estimated leverage ratio” is a metric that’s defined as the ratio between this open interest and the total amount of coins present on all derivatives exchanges (exchange reserve).
What this ratio tells us is the average amount of leverage that each Bitcoin futures investor is currently making use of.
When the value of the indicator is high, it means users are taking on a lot of risk right now. Such values can result in higher price volatility.
On the other hand, low values of the ratio indicate investors aren’t using much leverage currently as they look to avoid risk.
Now, here is a chart that shows the trend in the Bitcoin leverage ratio over the past few days:

Bitcoin Leverage Ratio

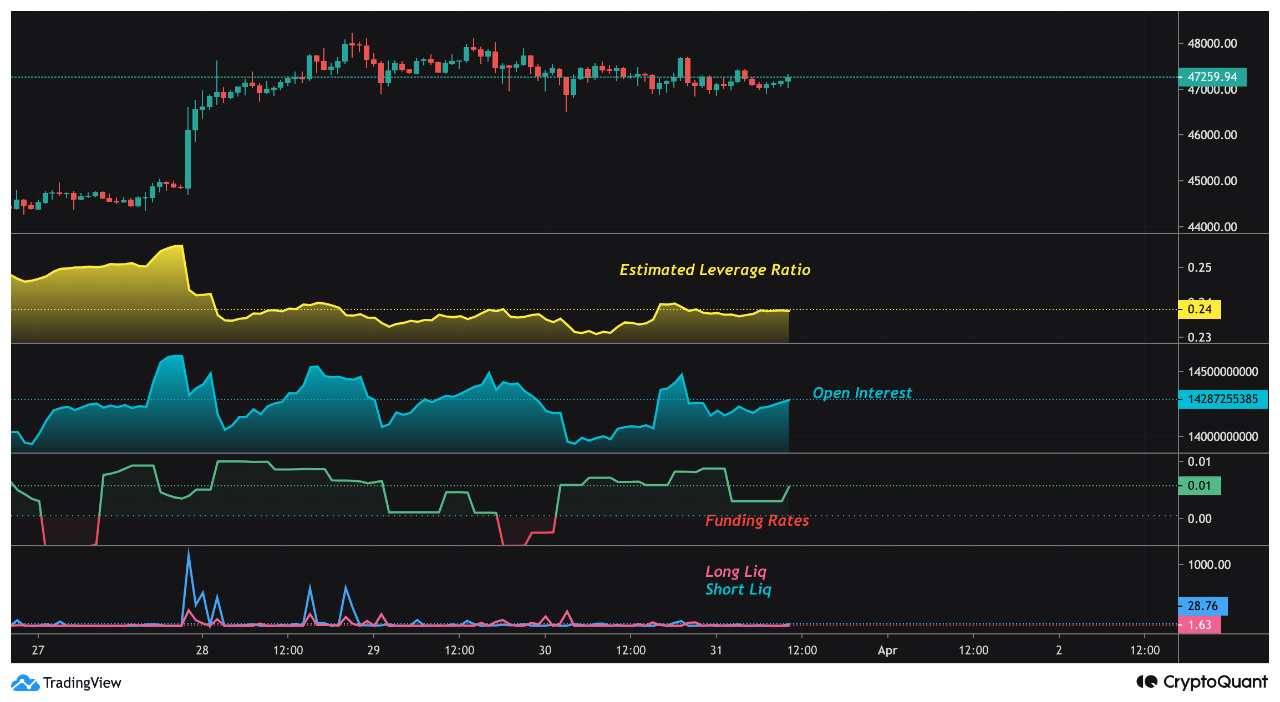
Looks like the value of the metric is low at the moment | Source: CryptoQuant
As you can see in the above graph, the Bitcoin leverage ratio had a high value a few days back, but the sharp uptrend in the crypto’s price brought it back down as it liquidated shorts.
Since then, the indicator’s value has remained at these low levels. The open interest, on the other hand, is still at a high value, implying investors have still been opening new positions in the market.
Related Reading | Time To Be Fearful? Bitcoin Index Reaches Greediest Point Since Peak
These new positions, however, have low average leverage attached to them as the ratio suggests. This shows that investors have been unsure about the crypto recently, opting to take less risk.
The chart also shows the curve for the funding rates, an indicator that tells us about the ratio of longs and shorts in the market. Currently, the metric seems to be positive, which means there are more long positions in the market.
BTC Price
At the time of writing, Bitcoin’s price floats around $47k, up 10% in the past week. The below chart shows the trend in the price of the coin over the last five days.

Bitcoin Price Chart

BTC's price seems to have moved sideways in the last few days | Source: BTCUSD on TradingView

Leituras Relacionadas

How Far Are We from the End of the Crypto Bear Market?

How Much Longer Until the Crypto Bear Market Ends? A persistent negative Coinbase Bitcoin Premium Index, reaching a record 46 consecutive days of negative values, underscores the ongoing crypto bear market. The downturn accelerated in late May/early June when MicroStrategy (referred to as "Strategy" in the text), a major BTC holder, sold a small amount of Bitcoin (32 BTC), shattering market confidence and triggering sharp declines in BTC, ETH, and SOL. This was compounded by sustained net outflows from US spot Bitcoin ETFs. June saw Bitcoin briefly fall below $60,000, its worst weekly performance since 2022, breaking below the critical 200-week moving average—a signal some analysts consider confirmation of a bear market. While some institutional analyses in mid-June suggested the bottom might be near (e.g., around $53,600 based on realized price, or a potential end during the 2026 World Cup summer), further price drops quickly disproved these optimistic forecasts. Key bear market indicators include: the severe de-pegging of MicroStrategy's preferred shares (STRC) from their $100 NAV, which later recovered partly due to company stabilization plans; a record number of BTC (over 10.83 million) and a significant portion of long-term ETH holders now in unrealized loss; and Bitcoin's price trading below its 200-week moving average. Predictions for the bear market's end vary. Some, like investor Yilihua, suggest July-August 2026 could present a final buying opportunity. Others, like miner Jiang Zhu'o'er, predict a bottom between $42,000-$44,000 in October-December 2026, based on the historical lag between MicroStrategy's mNAV ratio bottom and Bitcoin's price bottom. Technical indicators like the BTC 4-year average price index dipped briefly below 1, and the Coinbase Premium Index remains negative, suggesting a need for a price rebound to around $77,000 for a return to positive territory. In the absence of major external catalysts, the consensus leans toward the bear market persisting for another 2-3 months, with late September to early October 2026 being a potential turning point window.

Odaily星球日报Há 1h

How Far Are We from the End of the Crypto Bear Market?

Odaily星球日报Há 1h

Solana Ecosystem Shows Signs of Recovery: On-Chain Governance Upgrade, Tokenized Stocks and Meme Coins Heat Up

Solana Ecosystem Shows Signs of Revival: Governance Upgrades, Tokenized Stocks, and Memecoins Heat Up While the broader crypto market faces a downturn, Solana has shown relative strength with its price rising nearly 15% recently. This resilience is attributed to warming ecosystem activity, particularly in tokenized stocks and memecoins, coupled with a major upgrade to its on-chain governance. In the Real World Assets (RWA) sector, Solana now leads all public chains in both the number of unique holder wallets and the quantity of RWA assets. Its tokenized stock weekly trading volume has surged to a record $1.42 billion, capturing about 96% of the market share, largely driven by the Backpack exchange. Simultaneously, the Solana memecoin sector has reignited, fueled by the rapid ascent of the ANSEM token following endorsements from a prominent crypto influencer. This has boosted activity across platforms like Pump.fun and increased fee revenue for several Solana-based exchanges. A key development is the launch of Solana Governance Proposals (SGP), a new on-chain mechanism. It allows validators with at least 100,000 SOL delegated to submit proposals for community vote, enhancing decentralized decision-making. SGP will operate alongside the existing technical proposal process (SIMD), focusing on broader ecosystem governance. Despite these positive signals in specific areas, overall on-chain activity and transaction volumes still lag behind previous bull market peaks, indicating the recovery remains partial rather than ecosystem-wide.

marsbitHá 2h

Solana Ecosystem Shows Signs of Recovery: On-Chain Governance Upgrade, Tokenized Stocks and Meme Coins Heat Up

marsbitHá 2h

Trading

Spot
活动图片