Mr4Beast
05/21 11:40
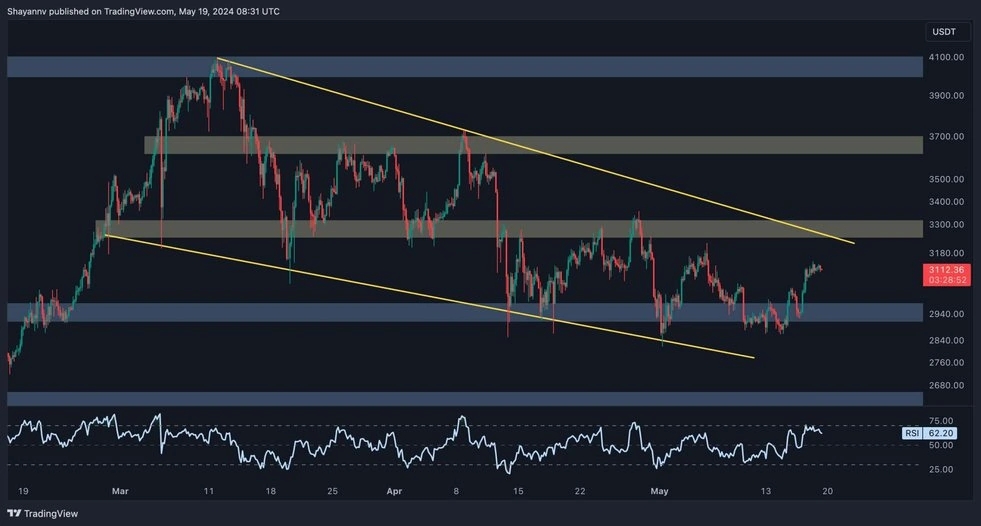
ETH The 4-Hour Chart
This indicates a slight increase in market demand.
If buyers successfully breach the wedge’s upper trendline at the $3.2K resistance level and the bullish momentum strengthens, a strong bullish trend could emerge in the mid-term.
However, if buyers fail to push the price above this threshold, a reversal may occur, leading to the continuation of the current sideways range phase towards the $2.9K support.
#Win 200 USDT: Share Your Plan to Save Ethereum#Hit March's Interaction Leaderboard#BTC price hits a new high of $120,000!
6Partilhar
Todos os comentários0Mais recentePopular