asiftahsin
06/22 01:27
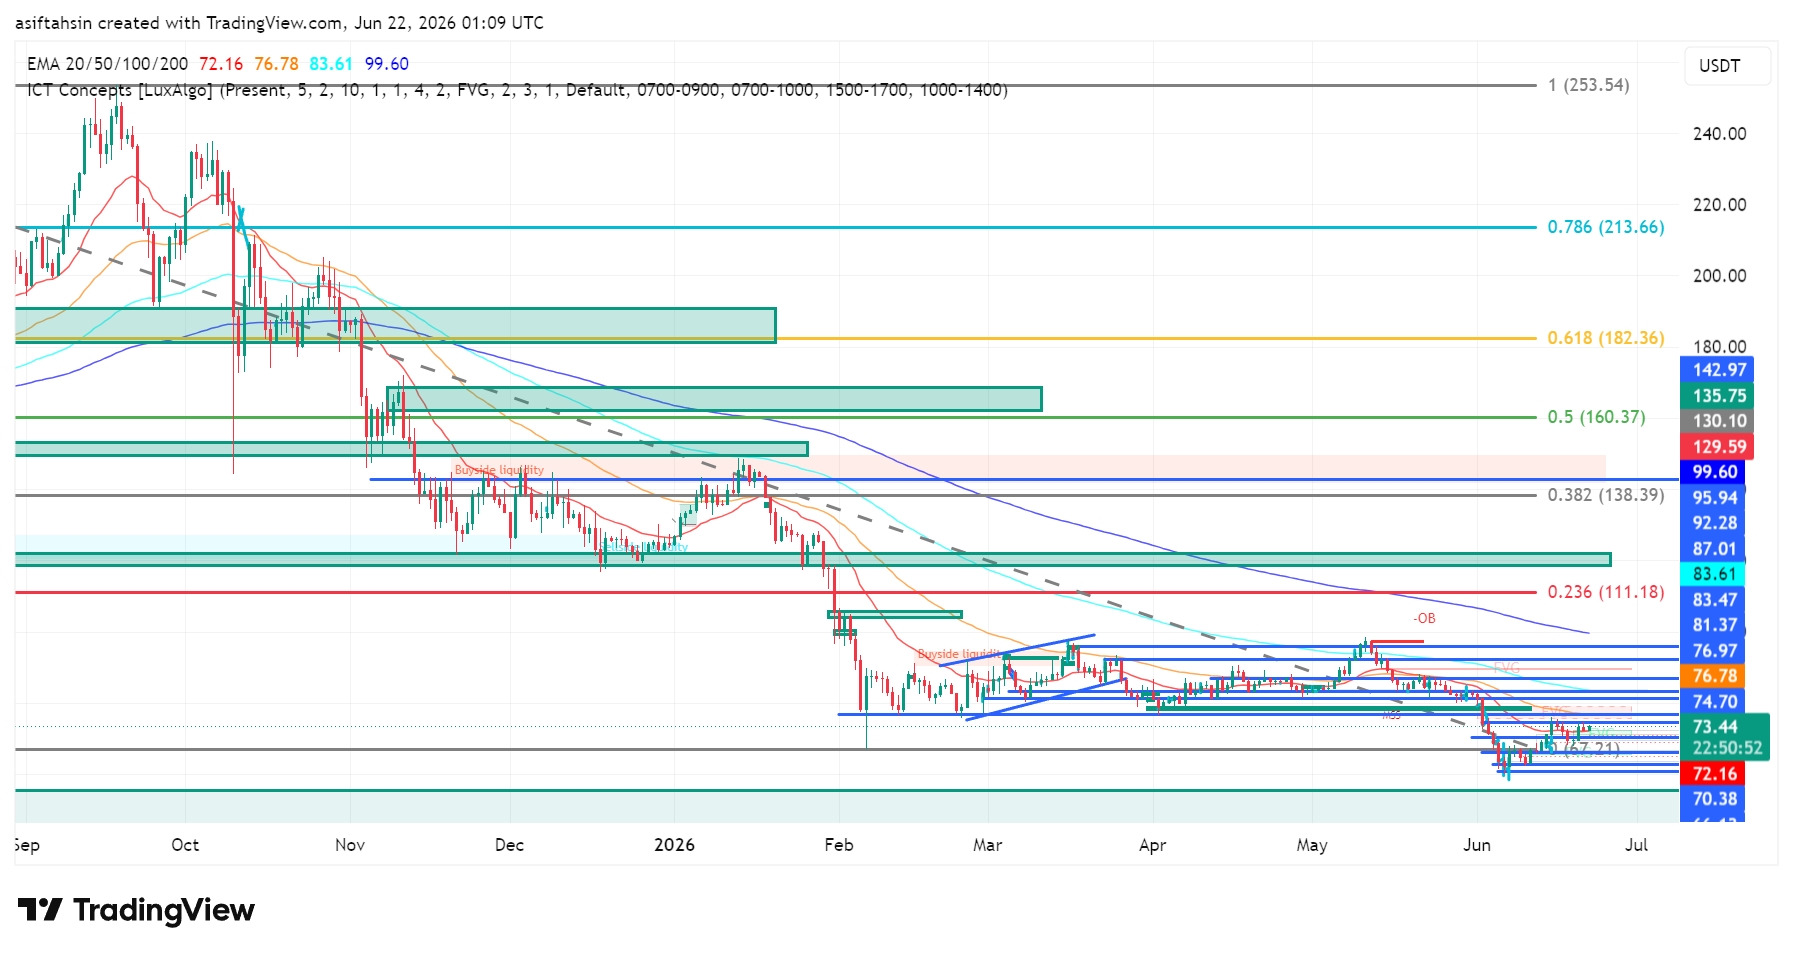
Technical Outlook: SOL Stabilizes Above Key Support — Bulls Face Major Resistance Ahead
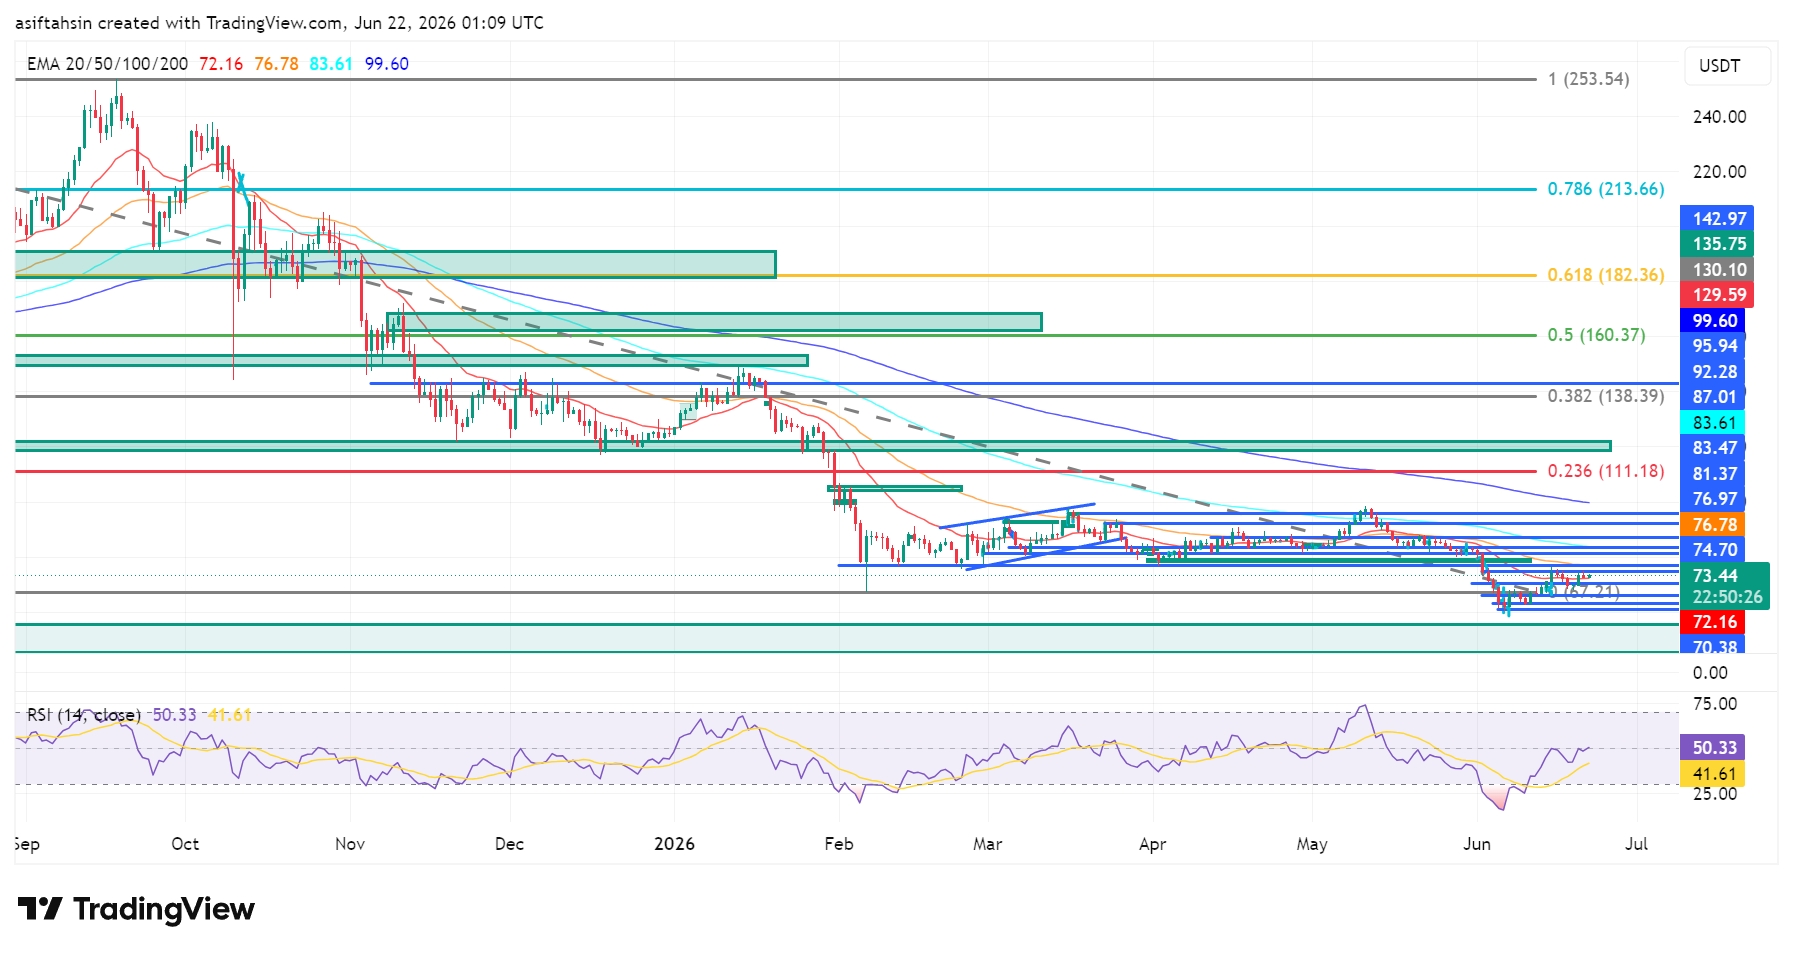
Solana has shown encouraging signs of stabilization after defending the major support region around $65–$70. The recent rebound has improved short-term momentum, but SOL continues to trade beneath all major moving averages and key Fibonacci resistance levels, keeping the higher-timeframe trend bearish.
While buyers have regained some control near the cycle lows, a confirmed trend reversal will require SOL to reclaim several important resistance zones overhead.
📈 EMA Structure (Bearish)
20 EMA: $72.16
50 EMA: $76.78
100 EMA: $83.61
200 EMA: $99.60
Price remains below all major EMAs ❌
20 EMA is acting as immediate dynamic resistance
50 & 100 EMA continue limiting recovery attempts
200 EMA remains the primary long-term trend barrier
👉 SOL must reclaim the EMA cluster before any sustainable bullish reversal can be confirmed.
📐 Fibonacci & Market Structure
Price remains below the 0.236 Fibonacci level at $111.18
Long-term descending trendline remains intact
Recent selloff swept liquidity below the previous trading range
Current rebound remains corrective within the broader downtrend
👉 Any relief rally could target:
$72.2 → Immediate resistance / 20 EMA
$76.8 → 50 EMA resistance
$83.6 → 100 EMA resistance
$99.6 → 200 EMA resistance
$111.2 → 0.236 Fibonacci resistance
👉 Failure to hold current support could expose:
$70.4 → Near-term support
$65.2 → Critical macro support
Below $65 → Increased downside risk and potential liquidity sweep
🧠 ICT / Smart Money View
Recent decline swept significant sell-side liquidity below range support
Price is attempting to build a base above the liquidity sweep
Multiple Fair Value Gaps (FVGs) remain overhead and unfilled
Market structure continues to print lower highs despite the recent bounce
SOLUSDT
永续
----%
#Claim1,200 USDT in the Monthly Creation Challenge
5Partilhar
Todos os comentários0Mais recentePopular