MZH Zee
08/06 02:03
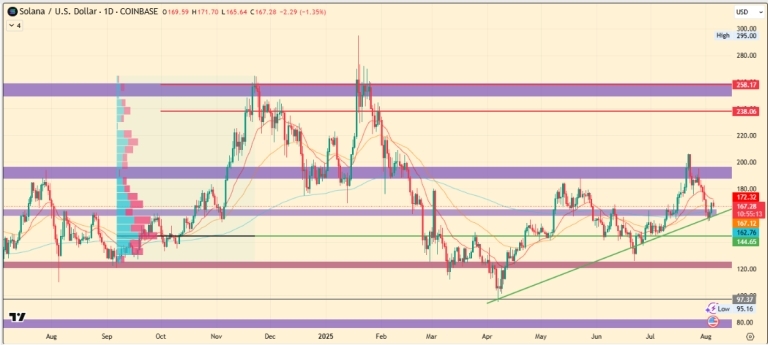
SOL Price Chart Shows Technical Breakout Potential
SOL Price Chart Shows Technical Breakout Potential
Technically, the SOL price today is attempting to reclaim critical EMAs. The asset has already breached the 50-day Exponential Moving Average and is now approaching the 20-day EMA band.
This move higher is notably occurring after the Solana price rebounded from a well-respected trendline support in early August.
The trendline, which has acted as a springboard multiple times before, once again proved reliable, with the current surge validating its strength.
Looking at the SOL price chart, a successful move above the $195 resistance zone is needed to revisit July’s highs near $206. Should this level be cleared, the Solana price prediction range stretches to $238-$258.
1Partilhar
Todos os comentários0Mais recentePopular