加密货币最佳
07/16 02:43
XLM/USDT on TradingView
XLM/USDT on TradingView
The weekly chart of XLM showed a firmly bullish structure. The first bullish structure break (orange) cane in May.
A higher high (green) at $0.334 was established later that month, and a higher low (white) at $0.216 was set in June.
The past week’s trading saw XLM rocket past the $0.334 high, challenging the $0.515 level from early 2025.
This was a strong sign of bullish conviction, but the rejection measured just over 11% at the time of writing. This could see XLM correct further. How deep should you expect the dip to go?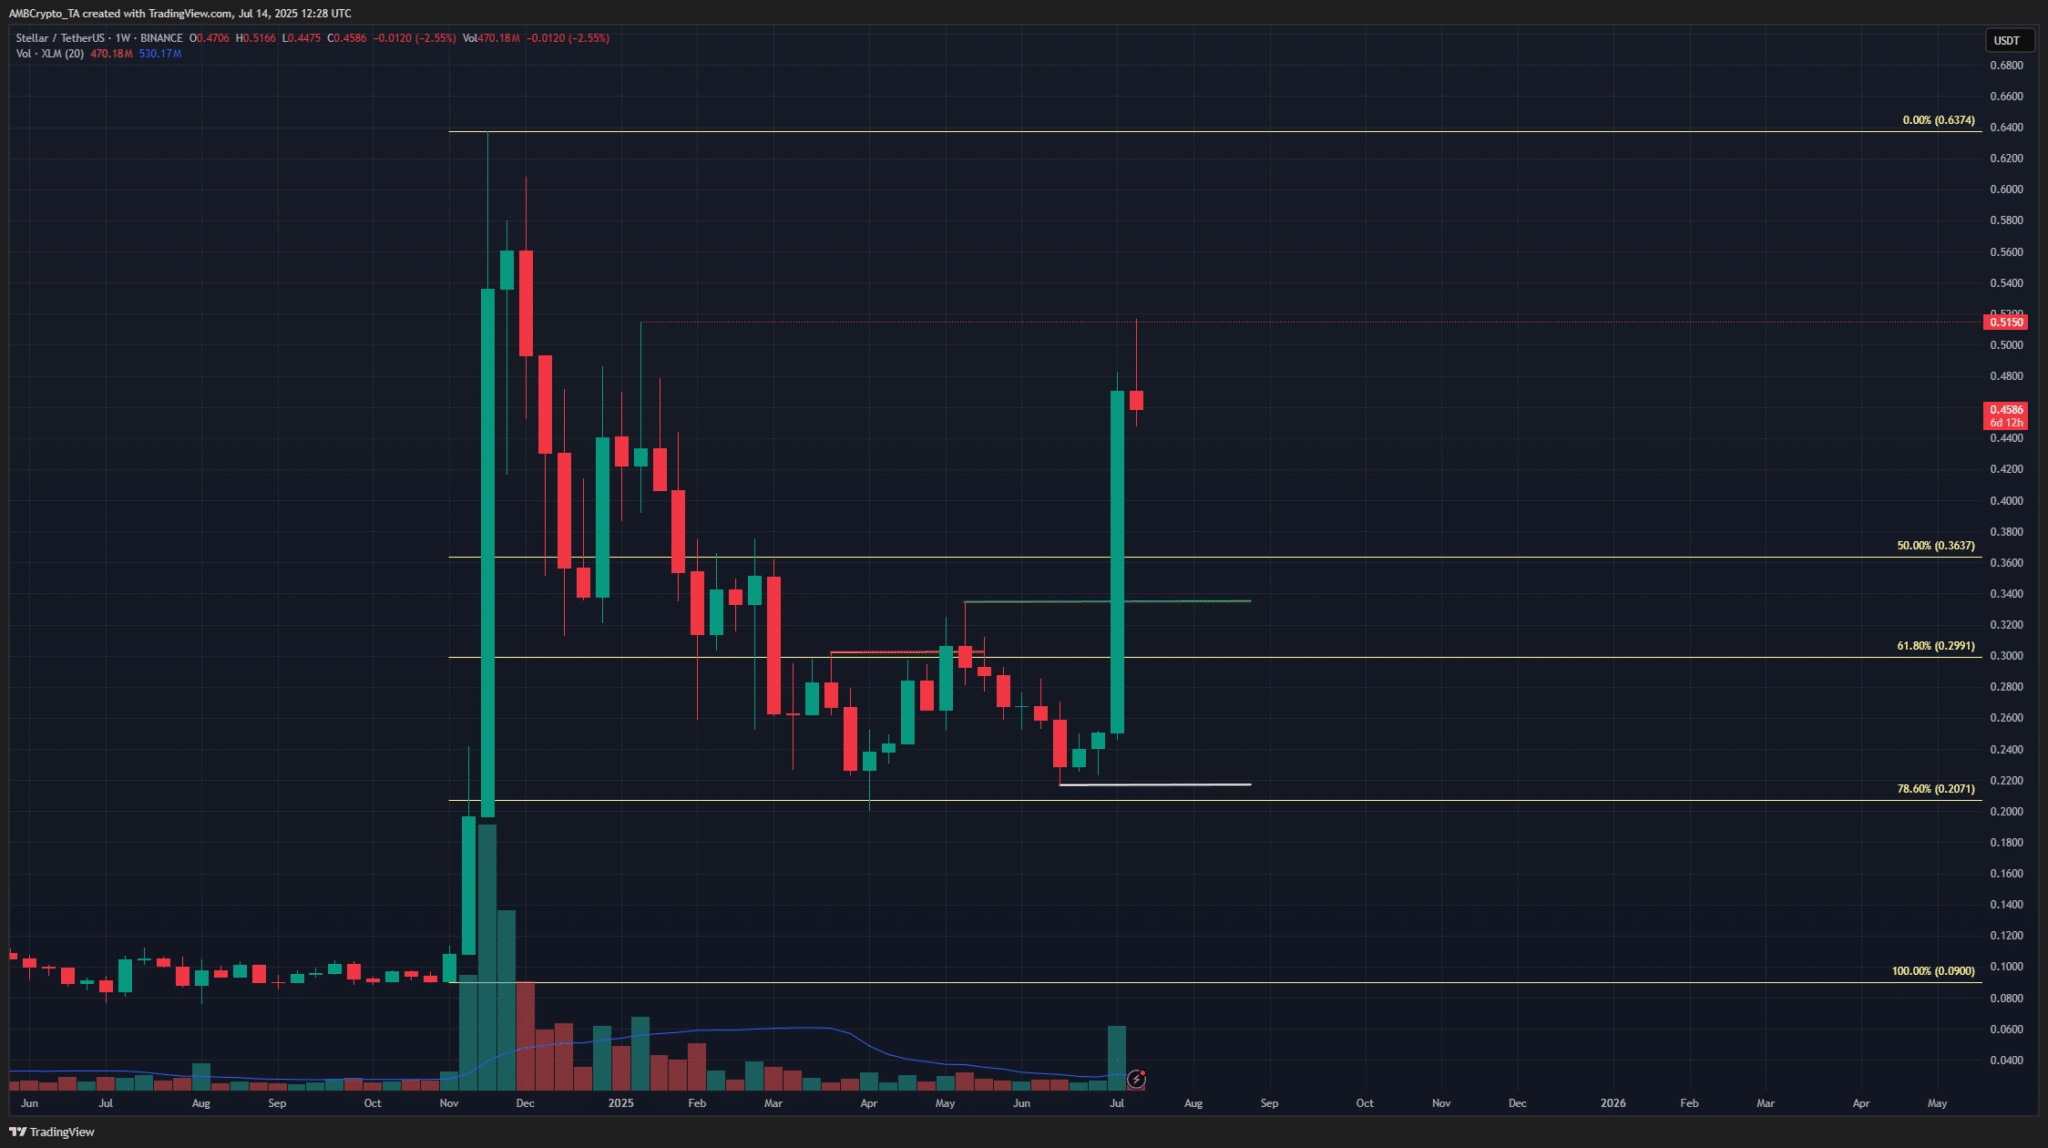
#HTX 12th-Anniversary Carnival#BTC price hits a new high of $120,000! #Claim1,200 USDT in the Monthly Creation Challenge#Do you think Tanssi is promising? #Do you think DELOREAN is promising?
21Partilhar
Todos os comentários0Mais recentePopular