BTC Trading Bots

HTX Holo Analysis

Tailored for BTC, these trading bots provide optimized spot and futures trading plans by precisely analyzing the asset’s market trends, liquidity, and volatility patterns. The bots master the market’s pulse, map out entry points and TP/SL levels, and enforce strict position management.

btc

BTCBitcoin Price

$0.99+0.22%

Live BTC Chart (BTC/USD)

Last Updated:

  • 1H
  • 24H
  • 1W
  • 1M
  • 1Y
  • All
No data

BTC Trading Bots

Sign up and trade to win rewards worth up to 1,500 USDT.Join Now

Top Markets for Grid Trading

Curated hot cryptocurrency markets for grid trading to help you seize arbitrage opportunities in market fluctuations.

BTC Articles

Bitcoin stable as Fed fave PCE inflation sees first monthly drop in six years

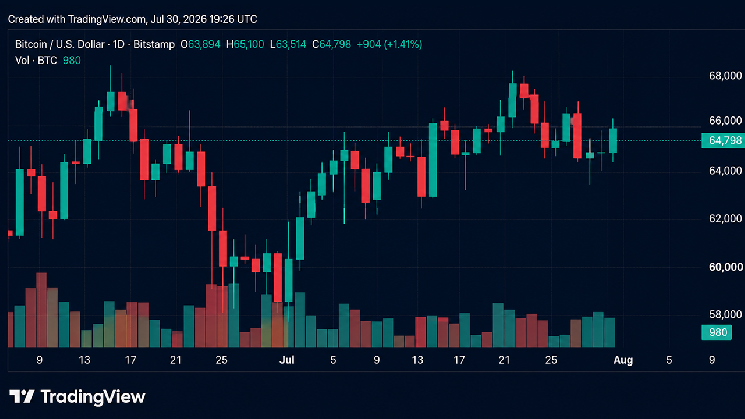
Bitcoin remained stable around $64,500 despite the release of key U.S. inflation data. The June Personal Consumption Expenditures (PCE) index, the Federal Reserve's preferred inflation gauge, showed a year-on-year increase of 3.7%, matching expectations and ending a recent uptrend with its first monthly decline since 2020. However, analysts cautioned that inflation remains nearly double the Fed's 2% target. Concurrently, U.S. stock markets rebounded, easing pressure on crypto assets. Following the Fed's decision to leave interest rates unchanged, Bitwise CIO Matt Hougan predicted Bitcoin will become less sensitive to future Fed rate changes, anticipating more modest policy adjustments ahead.

Bitcoin stable as Fed fave PCE inflation sees first monthly drop in six years - cointelegraph

Expect news tomorrow: this time the Bank of Japan will announce its interest rate decision! What impact will this have on Bitcoin?

A day before the Bank of Japan's (BOJ) interest rate decision announcement, the Japanese yen surged nearly 3% against the US dollar. The sharp move in the currency market fueled speculation that the Japanese government may have intervened again to support the yen. The USD/JPY pair fell over 400 pips to 158.5, its steepest daily drop since Japan's currency intervention earlier this year. Market participants suspect the rapid, strong yen appreciation could be due to direct foreign currency sales by Japanese authorities, though the Ministry of Finance has made no official statement. The yen had previously fallen to its weakest level against the dollar in nearly 40 years. In late April and May, the government intervened with roughly 9.6 trillion yen to prevent the USD/JPY from rising sustainably above 160, but the yen faced renewed selling pressure afterward. Investors are now focused on the BOJ's rate decision and its signals on future monetary policy. Potential hawkish signals from the BOJ are seen as a factor that could support further yen strength. A sharp yen appreciation could create short-term selling pressure on Bitcoin by increasing the risk of unwinding carry trades, where investors borrow low-yielding yen to invest in Bitcoin and other risky assets. This pressure could intensify if the BOJ takes a hawkish stance or raises interest rates.

Expect news tomorrow: this time the Bank of Japan will announce its interest rate decision! What impact will this have on Bitcoin? - cryptonews.ru

Analysts: "Another Bitcoin Drop Could Lead to a Reboot"

Crypto analysis firm DeFi Report, in its latest macroeconomic analysis, warns that a potential final wave of decline for Bitcoin could restructure the market and set the stage for a new bull cycle. While the US economy appears strong on the surface, bond market signals and economic indicators suggest the Federal Reserve may not be finished raising interest rates. Key vulnerabilities include a cooling labor market, low personal savings, and a significant drop in housing starts. Although Bitcoin has shown resilience around $65,000 compared to equities, analysts warn that a broader sell-off in risk assets, reflected in an 8-9% drop from the NASDAQ's peak, could impact crypto markets. The report suggests the crypto market has largely weathered its bear season but may face a final "rocky landing" capitulation wave under macroeconomic pressure. In this scenario, analysts anticipate Bitcoin could retreat to the $55,000 level. Such a decline, they argue, would fully clear market excesses and create a solid foundation for a sustained future uptrend.

Analysts: "Another Bitcoin Drop Could Lead to a Reboot" - cryptonews.ru

Stocks of Companies in Bitcoin Mining and AI Infrastructure Soar, Short Sellers Face Losses

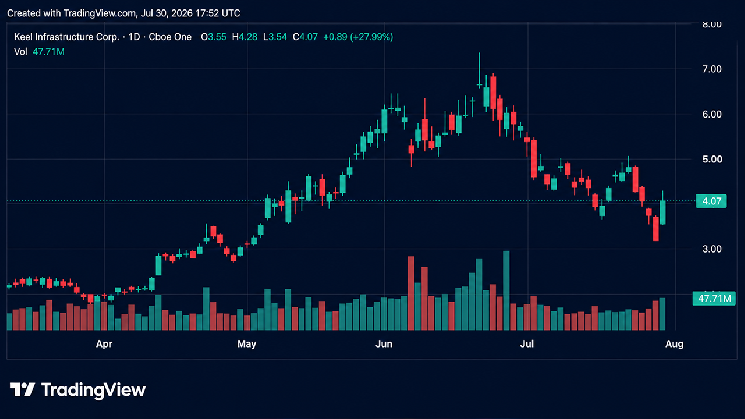
Shares of companies involved in Bitcoin mining and AI infrastructure surged, causing losses for short sellers. On Thursday, July 30, 2026, Keel Infrastructure (formerly Bitfarms) led the gains, rising 29.13%, followed by Nebius Group, Cipher Digital, and IREN Limited with jumps over 27%. Other notable gainers included Riot Platforms, Bitdeer, Core Scientific, Hut 8, and Cleanspark, with increases mostly ranging from 17% to 24%. The rally was attributed to a short squeeze triggered by a hedge fund's forced liquidation of its holdings, which were largely bought by Citadel. Additionally, Bitcoin trading above $64,000 and strong Microsoft earnings, highlighting AI's profitability, boosted market sentiment. Coreweave also announced a deal to provide AI cloud services for U.S. defense and intelligence agencies. This surge reflects a broader, longer-term trend of Bitcoin miners pivoting to AI data centers, leveraging their existing energy infrastructure and land. Recent multi-billion dollar deals by companies like Hut 8, IREN, and Terawulf for AI cloud services underscore this strategic shift. Other gainers, including Sandisk, Micron, Bloom Energy, and Cerebras, are suppliers critical to the AI infrastructure build-out. While the rally provided relief after July's losses, questions remain about capital expenditures, power availability, and long-term AI demand. The sustainability of these gains depends on these companies successfully converting their energy contracts and AI service deals into stable revenue streams.

Stocks of Companies in Bitcoin Mining and AI Infrastructure Soar, Short Sellers Face Losses - cryptonews.ru

Bitcoin Surpasses $65,000 Again; July Gains Exceed 10% After Fed Pauses Rate Hikes

Bitcoin briefly reclaimed the $65,000 level on Thursday, continuing a gradual recovery fueled by the Federal Reserve's decision to pause interest rate hikes. The price action was volatile following the announcement, dipping to $63,199 before a sustained rally to a daily high of $65,100. Although the move solidified a monthly gain exceeding 10% for July, profit-taking later pulled the price back to around $64,700. The broader crypto market saw over $243 million in leveraged position liquidations in the past day. Beyond monetary policy, markets digested U.S. macroeconomic data including 1.5% Q2 GDP growth and a 3.2% rise in the core PCE index, signaling persistent household demand. However, ongoing Middle East geopolitical tensions, highlighted by recent Iranian strikes, pose an inflation risk by potentially pushing crude oil above $90 per barrel. Sustained high oil prices could lead to renewed inflationary pressure, increasing the likelihood of further Fed tightening—a potential headwind for risk assets like Bitcoin.

Bitcoin Surpasses $65,000 Again; July Gains Exceed 10% After Fed Pauses Rate Hikes - cryptonews.ru

Join Grid Trading Community

Join the grid trading community to exchange strategies with millions of traders and receive real-time alerts.

Grid Trading Tutorials for Beginners

3 steps to get started with grid trading: select a trading pair, set parameters, and launch bots with one click.

01

Select Pair

USDe employs a delta-neutral hedging strategy to earn yield, offering stronger value pegging and a low-volatility experience.

02

Set Parameters

USDe supports transparent, professional third-party custody, and undergoes audits to provide robust asset protection.

03

One-Click Creation

No lockups or staking are required. Holding USDe in any account will earn you rewards, accrued daily and distributed weekly.

FAQs

QWhy is Bitcoin a good asset for grid trading?

ABitcoin is one of the most popular assets for grid trading for three reasons. First, it has consistently high volatility — even during relative calm Bitcoin regularly oscillates 3–8% within weekly ranges, providing frequent grid triggers. Second, Bitcoin has the deepest liquidity among all cryptocurrencies, ensuring buy and sell orders fill quickly without slippage. Third, BTC's price history shows recurring oscillation patterns around well-defined support and resistance zones, making it easier to set a meaningful grid range. On HTX, BTC/USDT is consistently among the most-copied and highest-volume grid strategies on the platform.

QWhat price range and grid count works best for BTC/USDT grid trading?

AFor BTC/USDT grid trading, a practical starting framework uses the 30 to 60-day recent high and low as your price boundaries. This covers a realistic oscillation band without being so wide that each individual grid level rarely triggers. For grid count, 20–50 levels works well for most capital sizes; each grid step should represent at least 0.5–1% of the price to cover trading fees and generate meaningful net profit per trade. HTX's AI parameter tool analyses current BTC volatility and automatically suggests an optimised range and grid count based on your investment amount — recommended for first-time BTC grid deployment.

QHow does Bitcoin's halving cycle affect grid trading strategies?

ABitcoin's approximately four-year halving cycle creates distinct market phases that affect optimal grid configuration. In the 12–18 months following a halving, Bitcoin historically enters a bull phase with strong upward trends — standard neutral grids may sell Bitcoin too early and miss the full upside. A Long Grid biased toward accumulating on dips is more appropriate during these phases. During the accumulation phase before a halving or in bear conditions, neutral or slightly short-biased grids perform better. The 2024 halving occurred in April 2024, placing us in a mid-to-late bull phase as of mid-2026 — grid configurations should be biased accordingly toward long-oriented parameters with wider upside range.

QWhat is the difference between BTC spot grid and BTC futures grid trading?

ABTC spot grid and BTC futures grid share the same buy-low-sell-high logic but differ in four key dimensions. Asset ownership: spot grid buys give you actual BTC; futures grid holds perpetual contract positions. Liquidation risk: spot has none — even a 50% drop just means holding BTC at a higher cost; futures with leverage can be liquidated if margin falls below the maintenance level. Funding rates: futures incur or earn funding rate payments every eight hours based on premium or discount to spot. Leverage: futures can amplify returns 2–10× but losses proportionally. For BTC grid trading beginners, spot is recommended as the lower-risk starting point; futures suits traders comfortable with leverage and margin management.

QWhat technical indicators help identify good entry timing for a BTC grid?

ASeveral technical indicators signal favourable conditions for deploying a BTC grid. Bollinger Bands: when BTC is trading inside a tightening Bollinger Band squeeze, compressed volatility often precedes a range-bound phase ideal for grid entry. ATR (Average True Range): low ATR values suggest price moves are small and contained, suitable for grids; high ATR with directional momentum suggests waiting. RSI between 40 and 60 indicates BTC is in a neutral zone without strong directional bias — the ideal deployment window. High-volume price zones from Volume Profile analysis provide natural grid boundaries where the market is likely to oscillate. HTX's AI market summary integrates these signals to provide daily grid suitability assessments for BTC.

QCan I run a BTC grid on pairs other than BTC/USDT?

AYes. On HTX you can run grid strategies on multiple BTC trading pairs. BTC/USDC behaves similarly to BTC/USDT but uses Circle's USDC as the quote currency. BTC perpetual futures are available in both USDT-margined and BTC-margined variants. In coin-margined (BTC-margined) contracts, profits and losses are denominated in BTC rather than USDT — this benefits you in bull markets as your BTC balance grows, but amplifies losses in bear markets since the collateral itself is declining in value. For most grid traders, BTC/USDT remains the most straightforward and liquid choice.

QWhat realistic annual returns can I expect from a BTC grid strategy?

ARealistic annual returns from BTC grid trading depend heavily on market conditions during the period. In high-volatility, range-bound markets, well-configured spot grids have historically demonstrated 25–70% after-fee annual returns on major exchanges. In low-volatility or strongly trending markets, returns may fall to 5–20% or turn negative if price moves strongly outside the grid. Futures grids with 3–5× leverage can amplify these returns proportionally but with higher risk. These ranges reflect historical outcomes under specific conditions and are not guaranteed. Use HTX's backtest tool to see what a specific parameter set would have earned over any chosen historical period before deploying real capital.
QCan BTC grid trading work during a bear market?

AGrid trading can still work during a BTC bear market but requires a different strategic approach. The key shift is strategy direction: instead of a neutral grid centred on current price, a Long Grid configured toward the lower end of a falling price range is more appropriate. This approach accumulates BTC at progressively lower prices — similar to DCA — while sell orders placed at higher grid levels recapture some profit on any rebounds. The critical risk is that the accumulation continues if the decline goes deeper than your grid's lower boundary, and with no stop-loss, exposure grows. Best practices for bear market BTC grids: use only spot (no leverage), set wider grid ranges with fewer levels, maintain an explicit stop-loss, and keep 20–30% of intended capital as reserve rather than deploying it all upfront.

QCan on-chain Bitcoin metrics help me set better grid parameters?

AYes. Several on-chain metrics provide useful context for BTC grid parameter setting. MVRV Ratio (Market Value to Realised Value): values above 3.5 historically indicate overvaluation — the grid's upper boundary should be set more conservatively; values below 1 suggest undervaluation — wider downside room is appropriate. NVT Ratio (Network Value to Transactions): acts like a P/E ratio for BTC; high NVT with declining on-chain activity signals overvaluation risk relevant to your upper grid limit. Puell Multiple: measures daily issuance value relative to the 365-day average; high values indicate elevated miner selling pressure, relevant to your lower grid boundary. Free data for these metrics is available on Glassnode's basic tier, CryptoQuant, and LookIntoBitcoin.com. While no metric precisely predicts price, they provide a probabilistic context for setting boundaries aligned with broader market valuation.

QHow do I choose a good BTC grid strategy to copy on HTX?

AWhen browsing BTC grid strategies on HTX's leaderboard to copy, evaluate five key metrics. Runtime: prioritise strategies running for at least 7–14 days to ensure the track record reflects real market conditions rather than an initial lucky run. Drawdown: the 7-day max drawdown should be below 15% for conservative investors and below 25% for moderate risk tolerance. ROI consistency: look for strategies with steady realised PnL growth rather than a single large spike — consistent daily growth indicates a working grid while a spike may reflect one unusual price move. Grid parameters: check that the current BTC price still sits within the strategy's active range. If current price is at or near the range boundary, the strategy may be about to stop trading. Minimum investment: ensure the copy minimum matches your available capital.