Original | Odaily Planet Daily (@OdailyChina)
Author | DingDang (@XiaMiPP)

During the black swan event on October 11th, the leveraged loan whale, who was forcibly liquidated of 32,000 AAVE at approximately $101, did not exit the market. On the contrary, starting from November 24th, this address began accumulating AAVE again through leveraged loans. As of now, its total holdings have increased to 333,000 AAVE, valued at approximately $62.59 million at the current price, with an average entry cost of around $167.
Almost within the same time window, the well-known crypto investment firm Multicoin Capital also began steadily building a position in AAVE: starting from October 17th, they gradually increased their holdings through Galaxy Digital's OTC channel. Their current holdings are approximately 338,000 AAVE, with a market value of about $65.3 million.
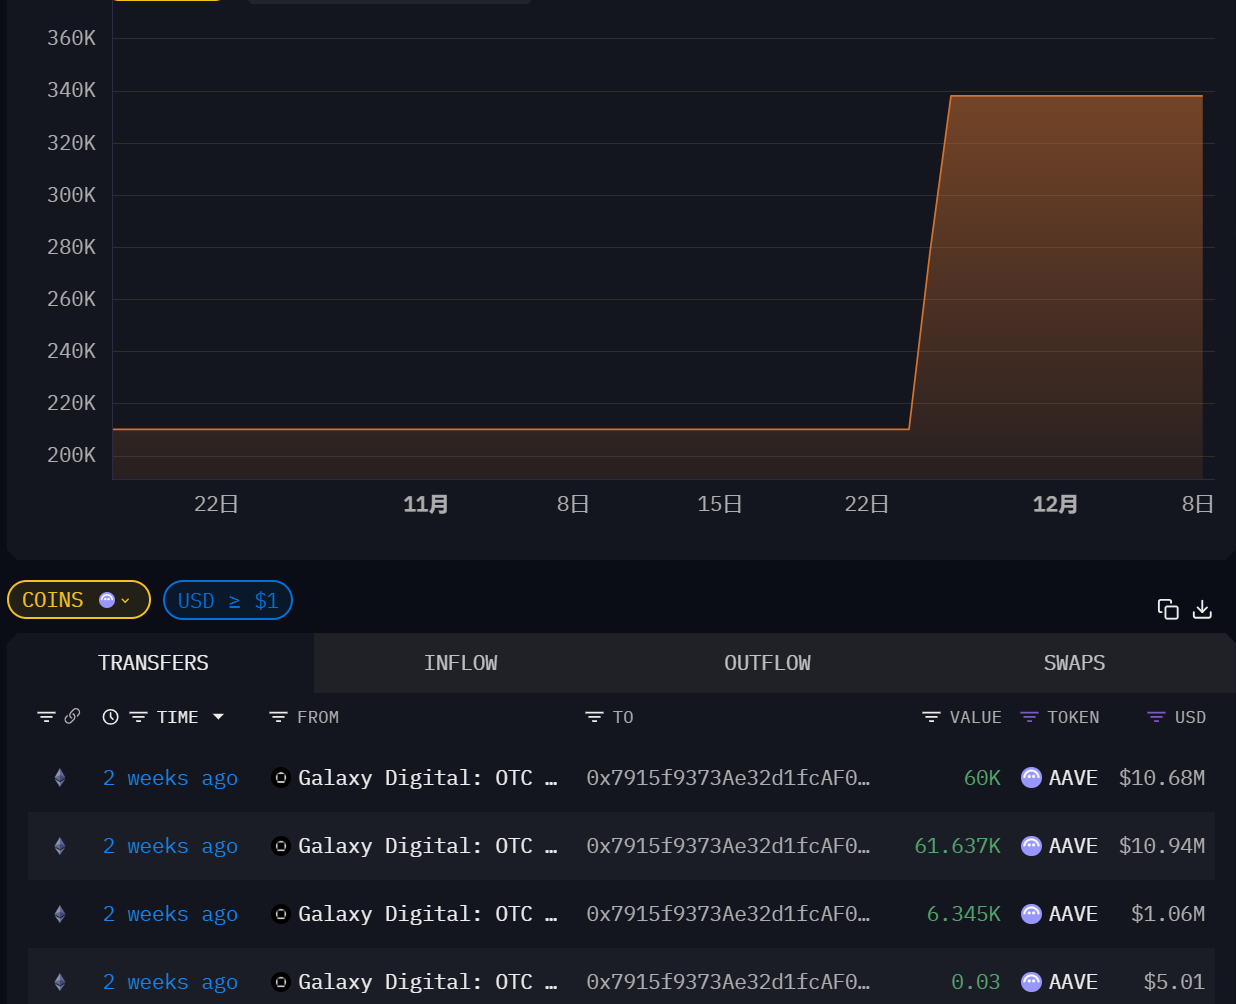
Image source: Arkham
These transactions all occurred within the past month and a half. Can these clear signs of capital accumulation be interpreted as "smart money" building a structural foundational position around AAVE? And is AAVE itself a worthwhile investment?
Aave Protocol: The "Quasi-Infrastructure" of On-Chain Lending
If on-chain lending is considered the DeFi sector closest to "native finance," then Aave has almost become the公认标准 (de facto standard) in this field. Metrics such as TVL, revenue, market share, and borrowing/lending activity all attest to Aave's success.
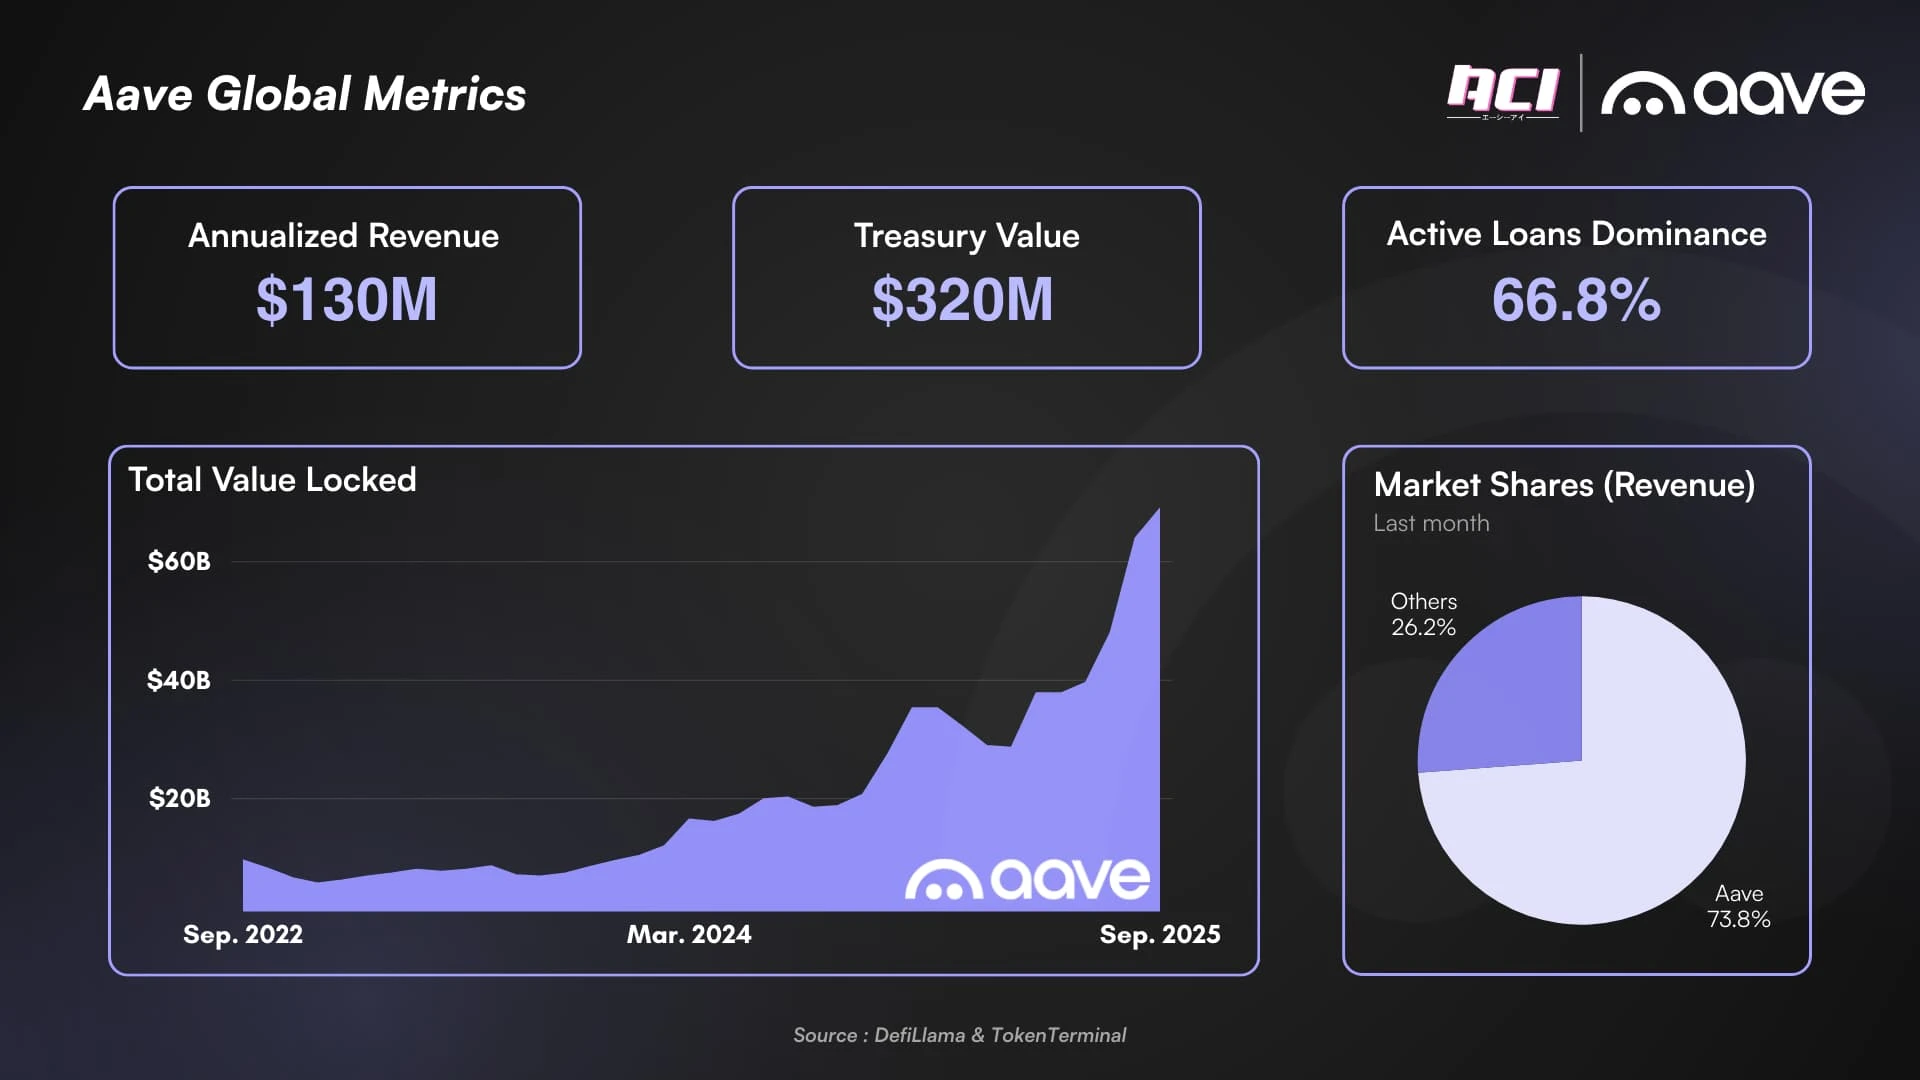
Especially in terms of revenue. As the core metric for measuring the value of a DeFi protocol, Aave holds a dominant position in the lending market. Approximately 79% of the lending market's revenue comes from the Ethereum mainnet, and 87% of *that* belongs to Aave itself.
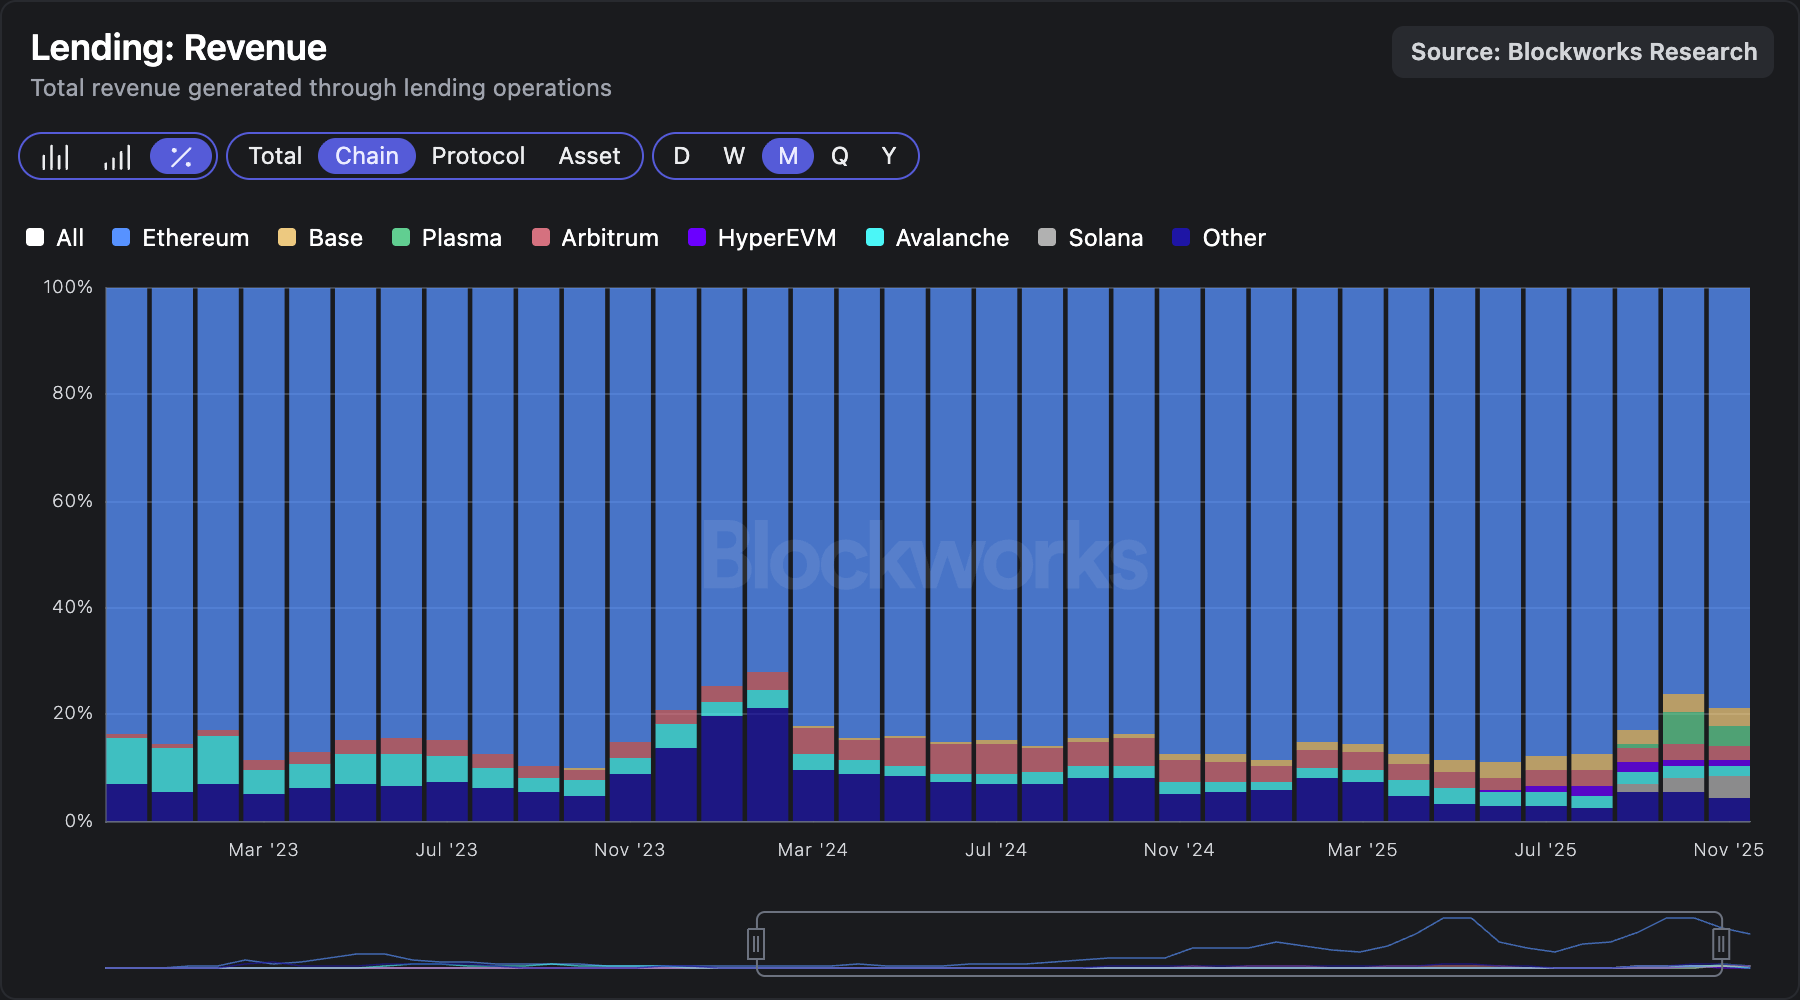
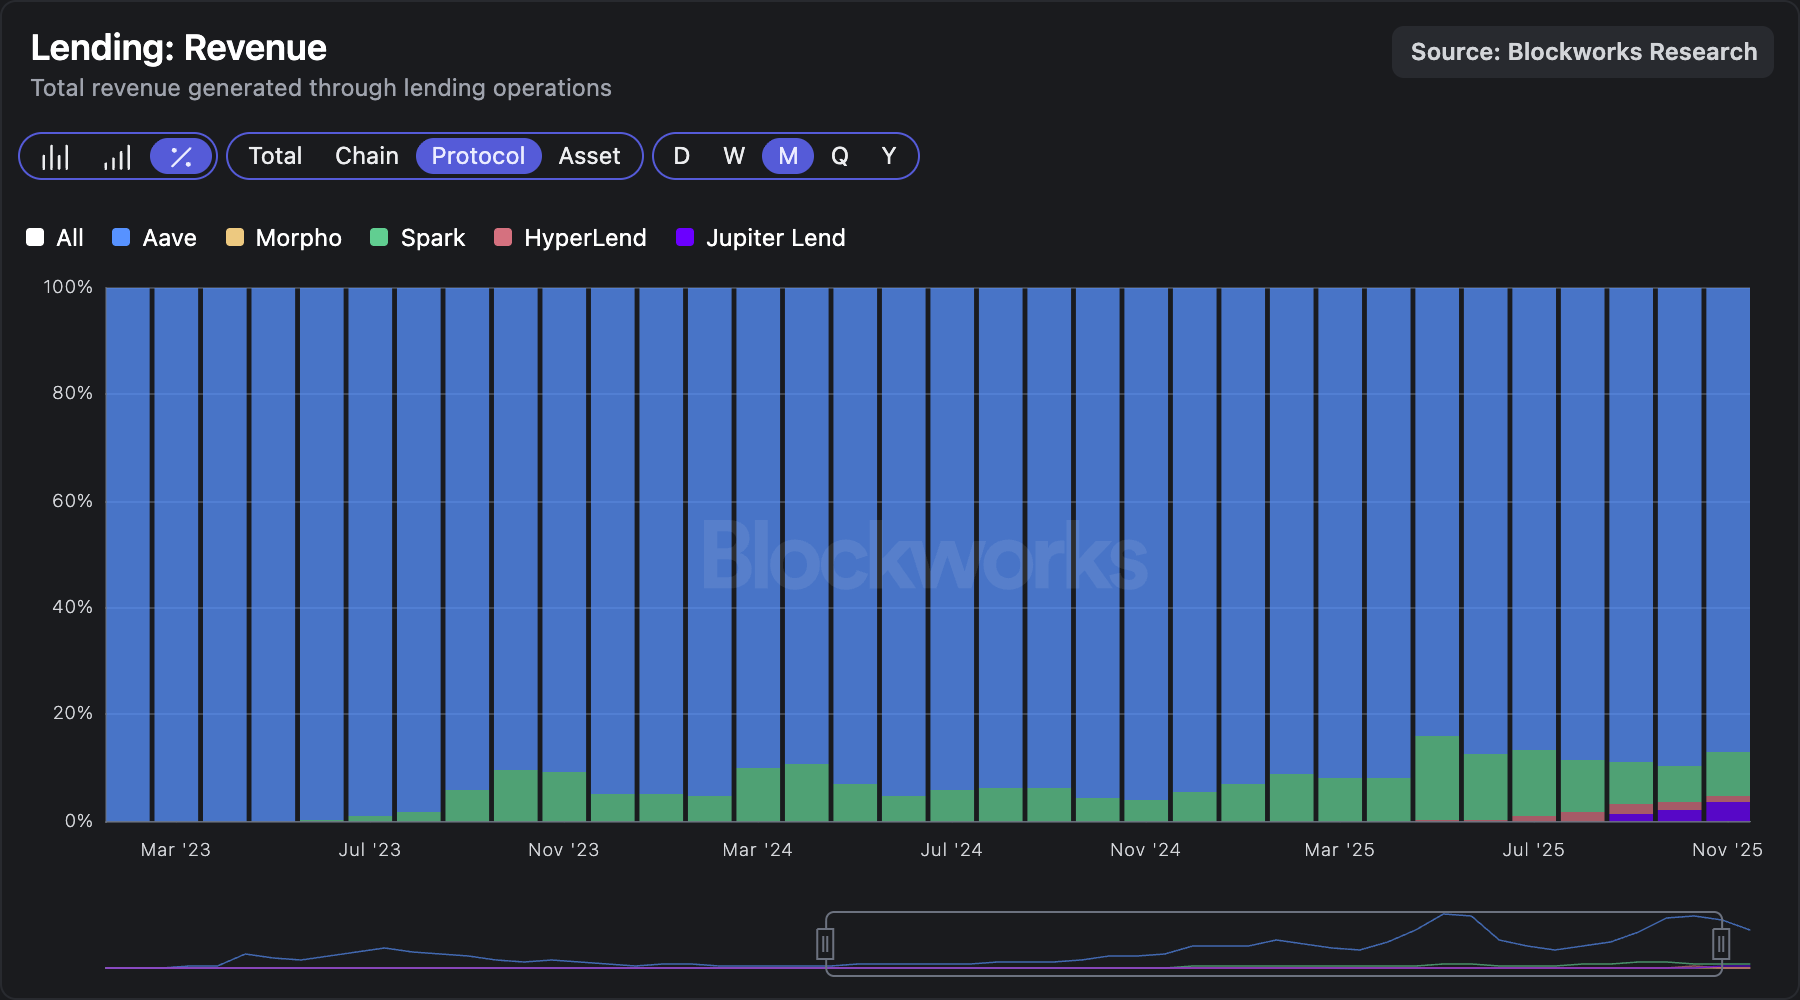
Data from Blockworks
This structure implies: Aave is not just a "leading project," but closer to a foundational protocol默认为 (defaulted to as) the default liquidity layer by the market. But the question is: Can this advantage translate into a more deterministic cash flow logic, thereby supporting AAVE's investment value?
To avoid being misled by market noise, crypto user @intern_cc systematically deconstructed Aave's long-term financial structure, starting from the "protocol's own ability to generate revenue" to evaluate whether its current growth is structural or merely a cyclical rebound.
The core analytical framework includes: 1) A revenue forecasting model, built based on historical rolling multiples and specifically adjusted for diminishing marginal returns in mature markets; 2) Product integration capability, assessing the stability of GHO and its role in vertically integrating protocol revenue; 3) Capital efficiency metrics, reviewing the execution effectiveness of the token buyback plan and comparing it with annual targets.
Odaily Planet Daily has compiled the key data as follows:
Revenue Structure: Still Highly Cyclical, but the "Bottom" is Rising
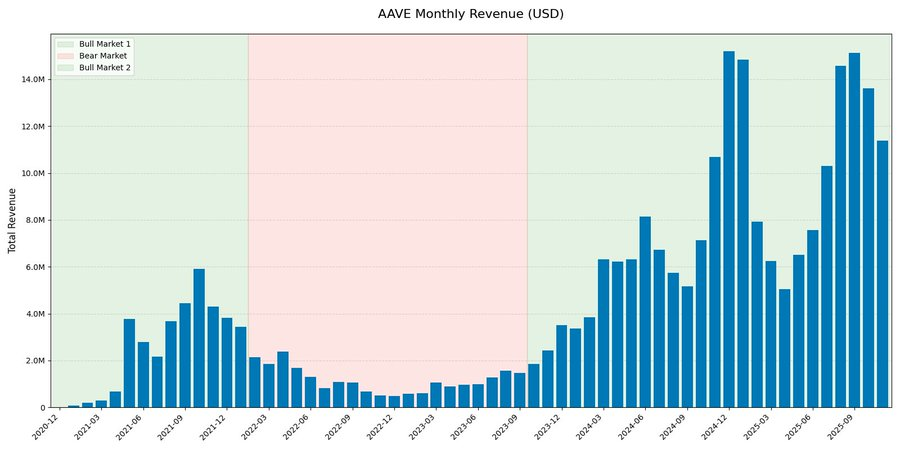
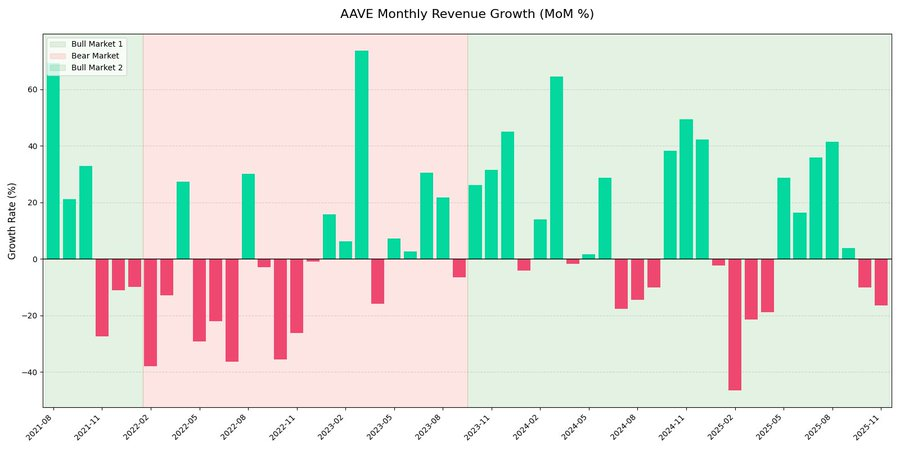
Looking back at Aave's monthly revenue data, it shows a strong cyclical characteristic. But more notably, a clear structural shift has occurred.
In the current cycle ("the second bull market"), Aave's monthly revenue experienced explosive growth, peaking at nearly $15 million, which is more than double the peak in 2021. Despite the significant growth, the month-over-month revenue chart clearly shows: Revenue remains highly volatile, primarily driven by market activity, rather than showing a linear, steady expansion.
This data also indicates that protocol revenue exhibits a clear reflexive characteristic between different market cycles.
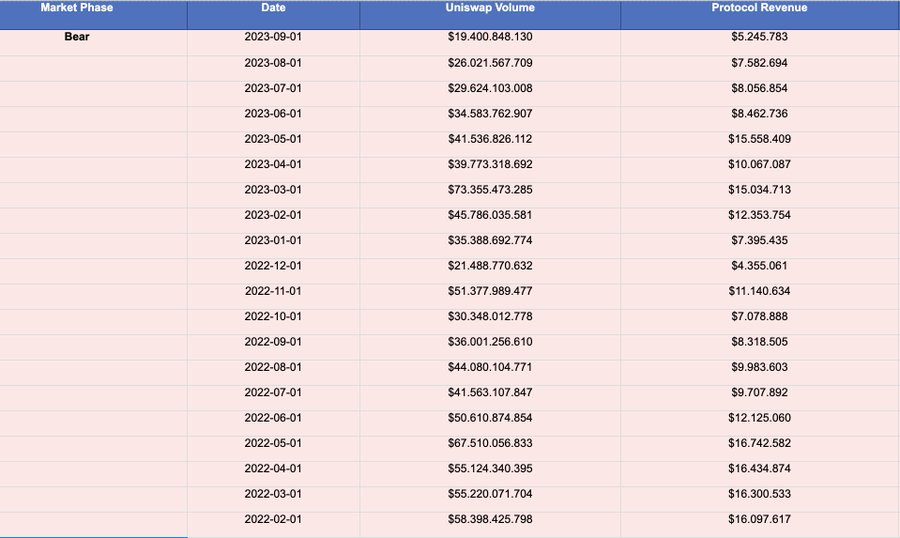
The author also points out that even for blue-chip DeFi protocols like Aave, it is difficult to completely eliminate cyclical fluctuations in future bear markets. Newer protocols like Ethena and Pendle might face more severe survival tests in future bear markets but will experience high prosperity during bull cycles. Uniswap is virtually the only blue-chip DeFi protocol that shows relatively moderate declines in trading volume and revenue during bear markets.
GHO: The Key Variable for Aave's Shift from "Horizontal Expansion" to "Vertical Integration"
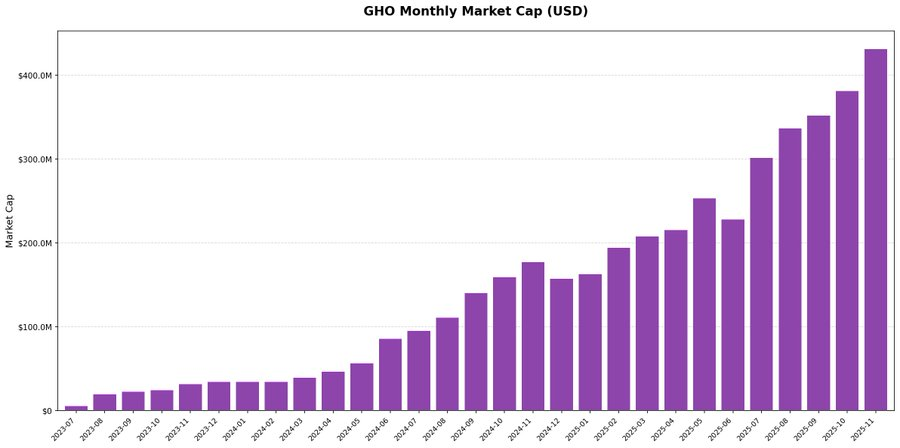
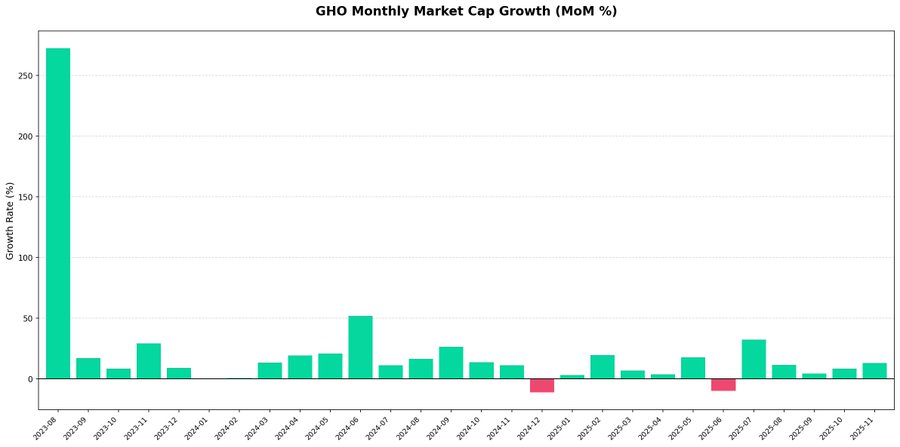
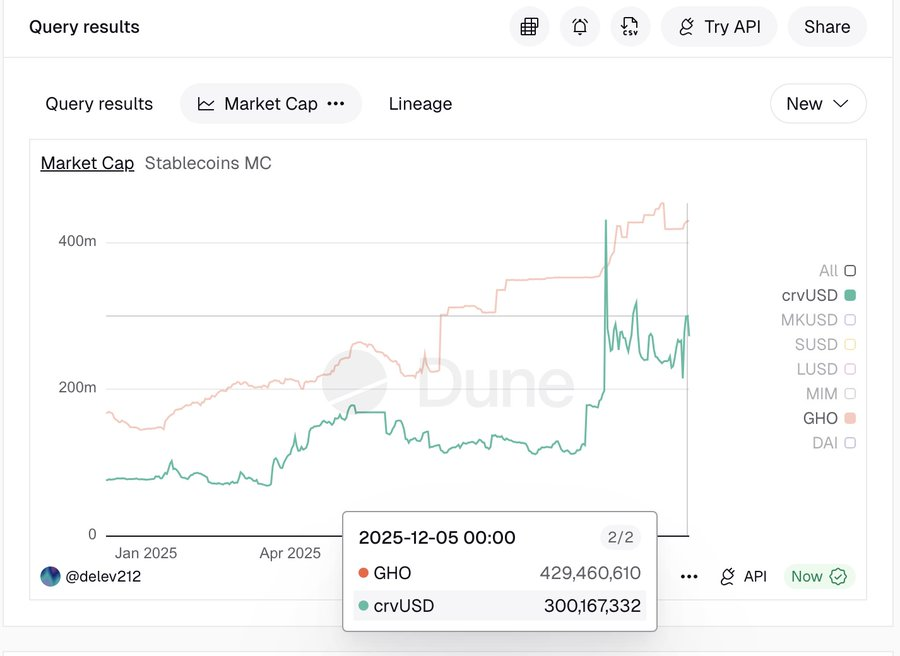
Since its launch in Q3 2023, GHO has maintained a steady upward trajectory. By the end of 2025, its market capitalization had surpassed $400 million.
Month-over-month data shows extremely low volatility, with almost no significant signs of capital outflow, indicating that demand is sustained rather than driven by short-term speculative rotation.
This trajectory validates that Aave's strategic direction towards vertical integration is effective. GHO's growth is organic growth, with no abnormal spikes in TVL.
A horizontal comparison between GHO and crvUSD reveals that CDP-type stablecoins from blue-chip DeFi protocols exhibit a clear structural demand foundation.
Revenue Forecast Model: Aave is Entering the "Mature Protocol Range"
The author modeled using rolling windows across past cycles, arguing that instead of subjectively assuming future growth rates, it's better to precisely measure the protocol's true revenue performance in each 12-month segment of past market cycles, splitting them into bear market contraction phases and bull market expansion phases.
For scenario settings, three scenarios were selected based on the historical sample distribution:
- Conservative scenario (25th percentile)
- Baseline scenario (median)
- Optimistic scenario
Notably, the optimistic scenario did not use the common upper quartile (75th percentile) but was deliberately constrained to around the 60th percentile range to filter out extreme outliers. The core purpose of this design is to embody the law of diminishing marginal returns, ensuring the model reflects the growth trajectory of a protocol entering its mature stage, rather than the explosive abnormal returns of its early days.
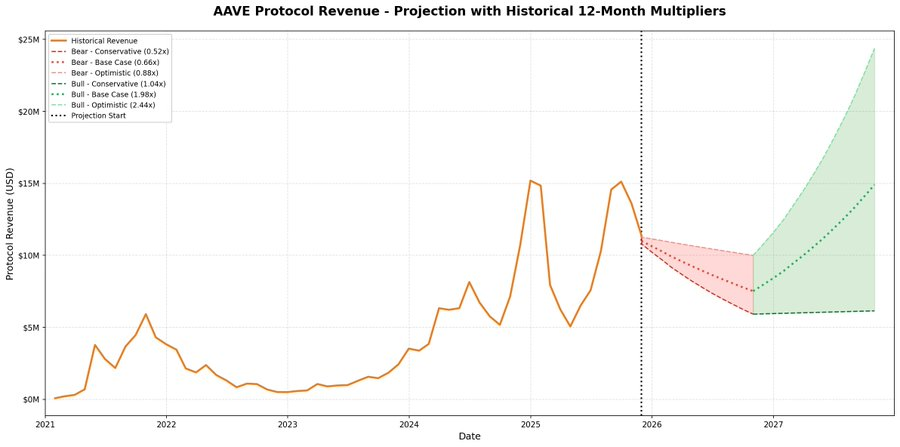
The results of this model show: Aave has clearly matured compared to the first bear market cycle. Future revenue may still decline, but the drawdown will be significantly milder.
It is particularly noteworthy that even under the bear market scenario assumption (multiple range of 0.52x–0.88x), the predicted revenue bottom is about $6 million per month, which is still higher than the historical peak during the 2021 bull market.
AAVE Buyback: The True Execution Power of the Deflation Mechanism
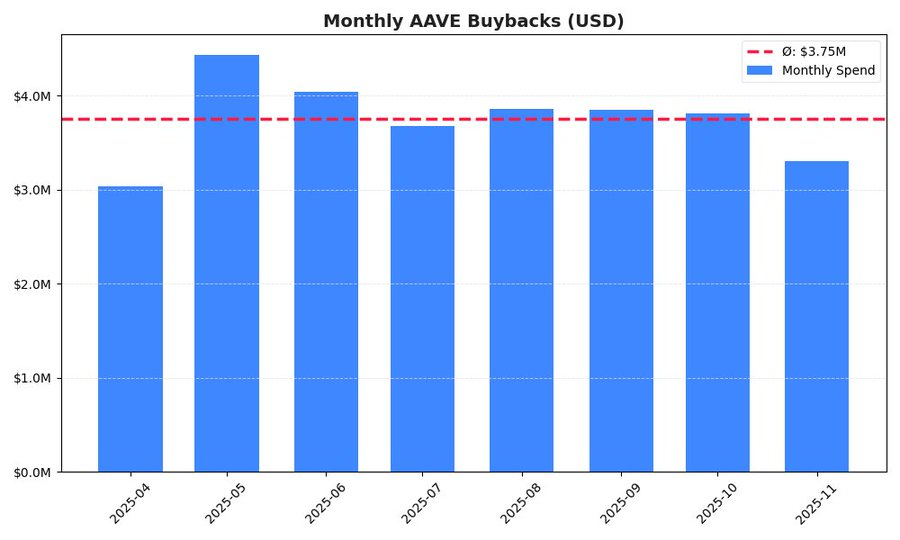
The monthly buyback volatility chart shows that the protocol employs a relatively disciplined, non-speculative execution strategy. Although there are slight fluctuations (e.g., a阶段性峰值 [stage peak] in May), the overall pace is relatively stable.
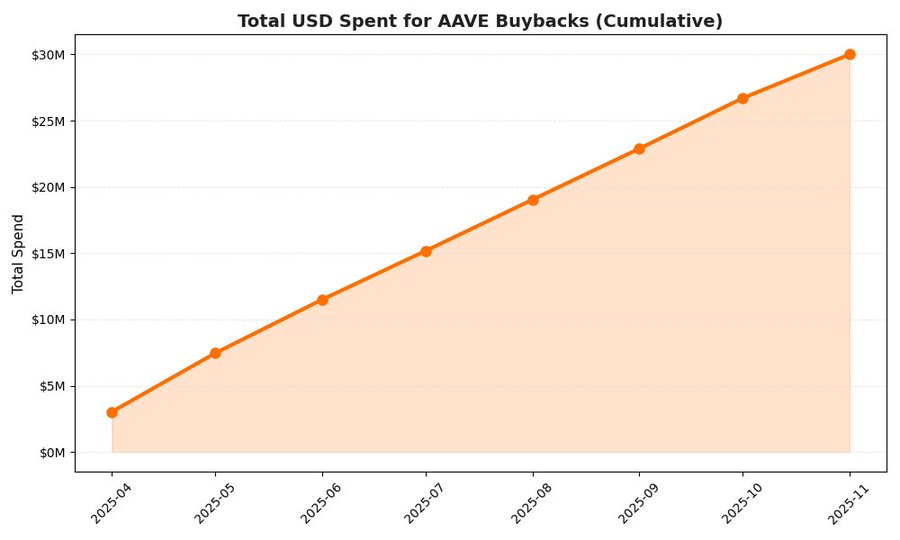
Cumulative data indicates that in the first 8 months after the buyback plan was initiated, Aave had累计投入 (cumulatively invested) approximately $30 million. To achieve the official annual target of $50 million, the corresponding monthly pace should be about $4.17 million. The current actual monthly pace is about $3.75 million. Projecting at the current speed, the annualized buyback scale would be about $45 million, representing a deviation of about 10% from the target.
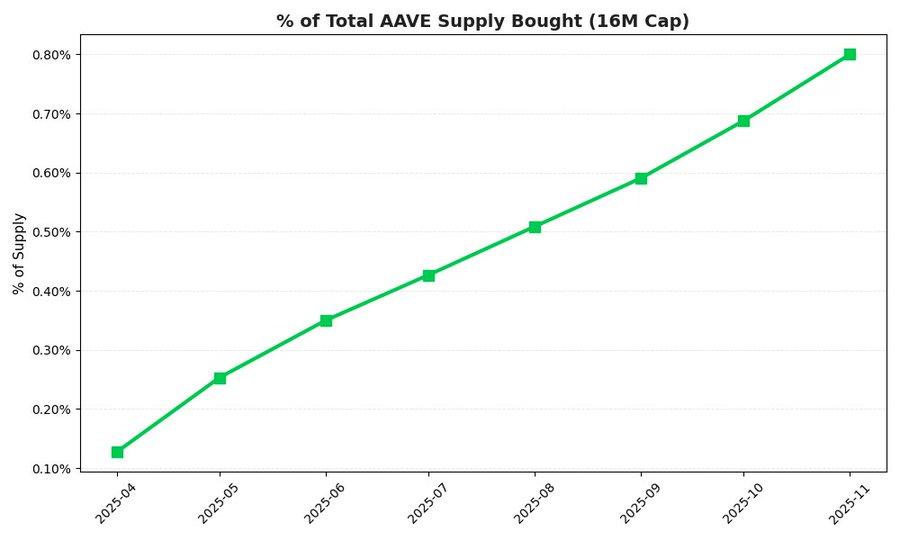
The buyback mechanism has already exerted a quantifiable deflationary pressure on the token supply: in just 8 months, the protocol has bought back approximately 0.80% of the total supply (1.6 million AAVE).
Conclusion
From a protocol perspective, Aave is evolving from a single lending protocol into a foundational liquidity layer: its revenue model is gradually entering a mature range; GHO opens a second growth curve through vertical integration; the buyback mechanism is beginning to impose real and quantifiable deflationary constraints on the supply side—these changes will not be fully priced in within a single bull-bear cycle, but they are quietly altering AAVE's long-term risk-return structure.
Short-term price fluctuations are inevitable. However, if approached from a longer-term, more infrastructure-type asset allocation logic, AAVE can still be a quality choice.