Bitcoin Hash Ribbon Indicator Flashes "Buy" Signal at $90,000: Will BTC Price Rebound?
Bitcoin miners' situation provides clues for potential BTC price upside, with the historically accurate Hash Ribbon indicator issuing a buy signal.

The BTC Hash Ribbon indicator, tracked by on-chain analytics platform Capriole Investments, has issued a "buy signal" for the fifth time in 2025.
Key Points:
A historically accurate BTC price indicator has issued a "buy" signal for the fifth time this year.
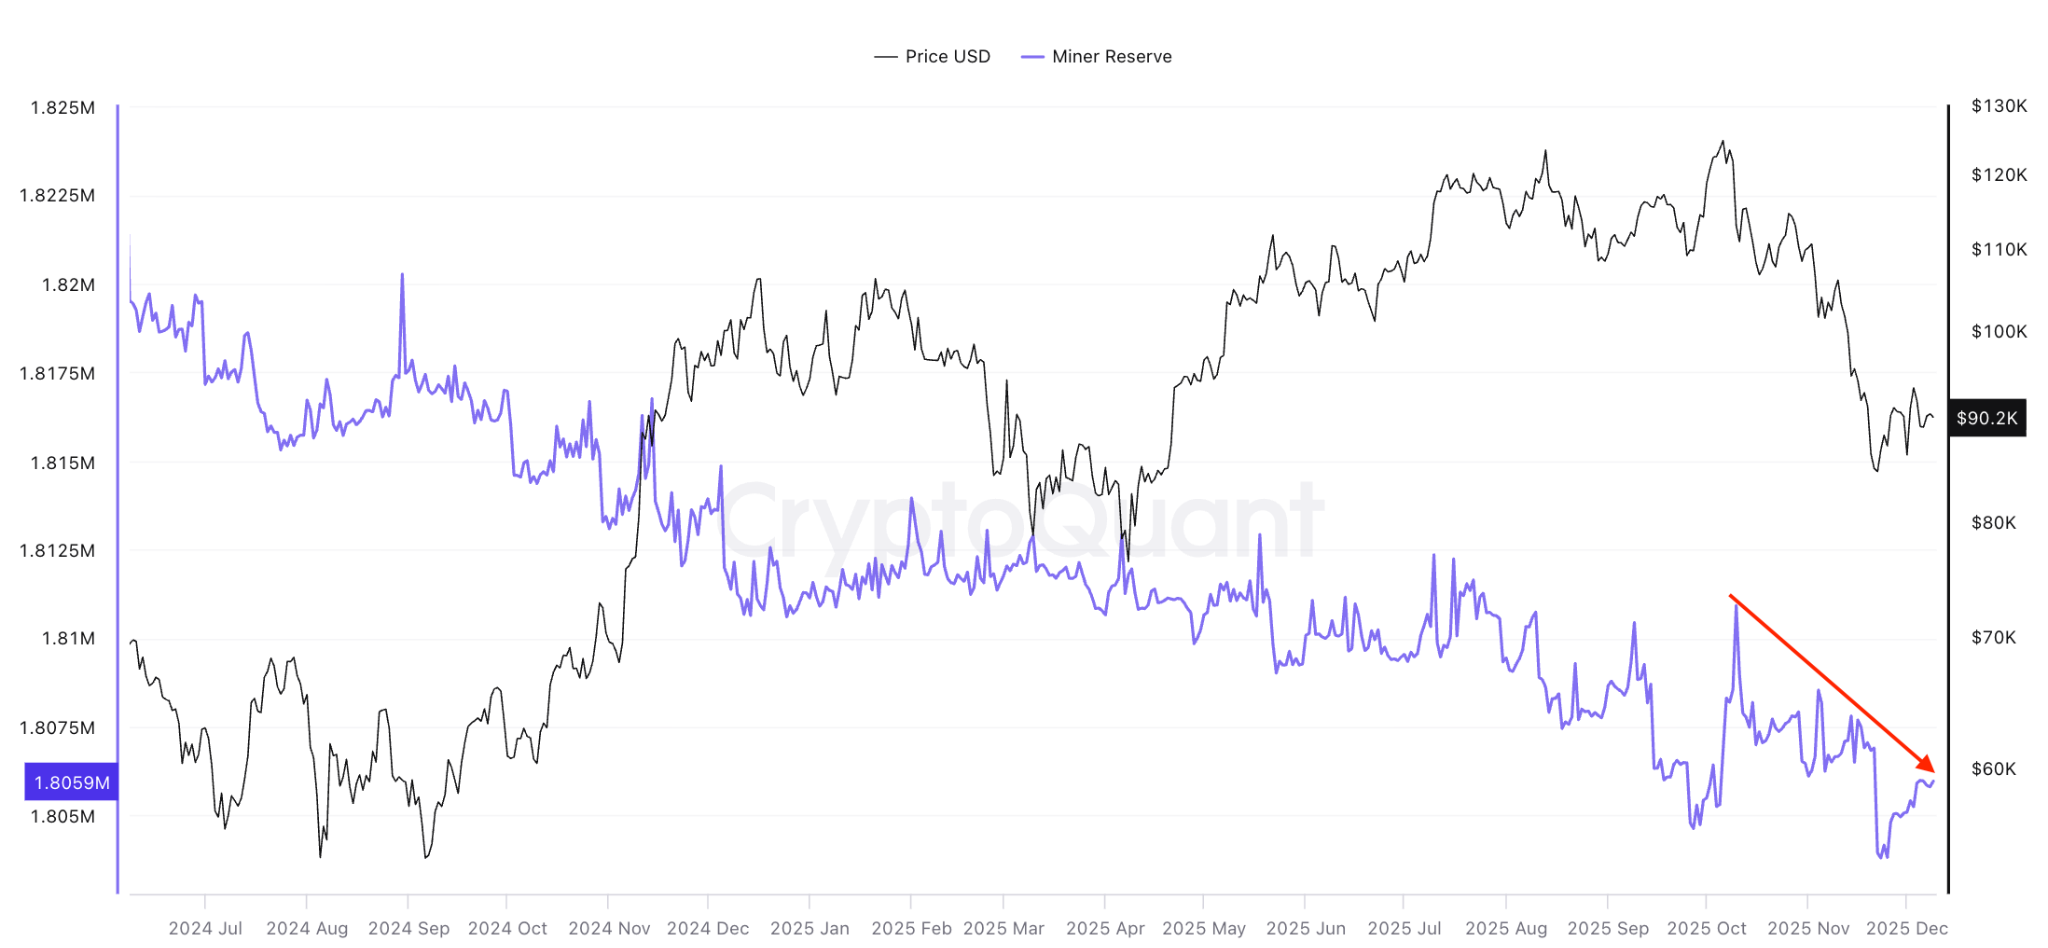
Miners' BTC sales have accelerated since early October, becoming more pronounced than earlier this year.
Bitcoin is fluctuating between the year's opening price of $93,000 and the demand zone below $90,000, reflecting traders' indecision about the direction of BTC's price trend.
Bitcoin Hash Ribbon: "Miners Under Pressure"
A historically accurate Bitcoin miner performance indicator is telling market participants that despite the price dropping from the all-time high of $126,000 to $80,500 on November 21st, it's still time to buy.
The Hash Ribbon indicator, used to identify price rebounds after miners exit the market, indicates that miners are under pressure.
The chart below shows that the 30-day moving average (MA) of hashrate has fallen below the 60-day MA, indicating miner capitulation, which is often synchronized with significant price discounts and long-term opportunities.
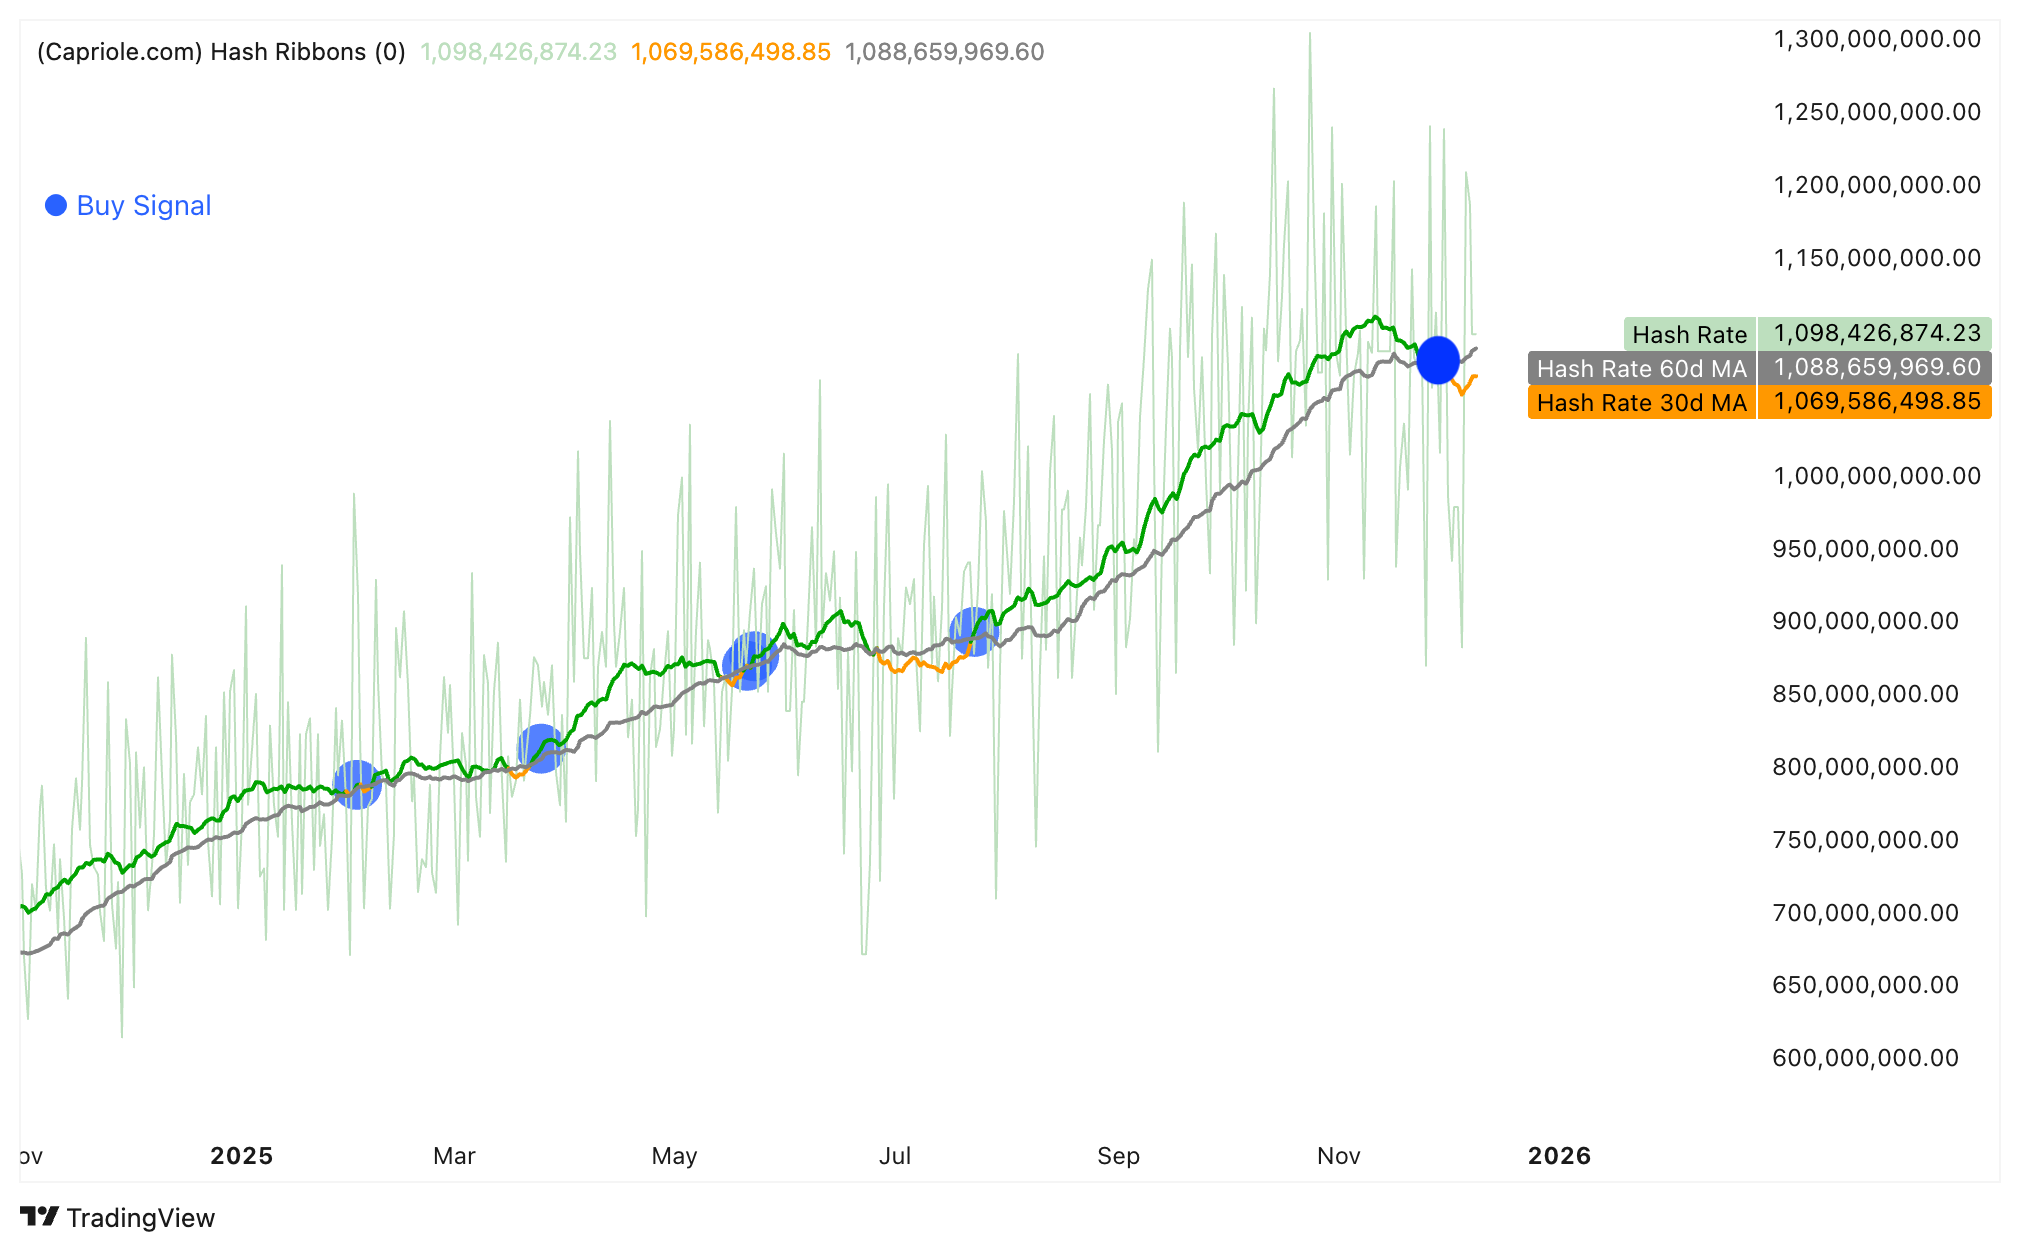
The Hash Ribbon indicator has an impressive record in capturing long-term price bottoms and is relatively rare in issuing "buy" signals.
CryptoQuant contributor Darkfost pointed out in an X post analysis: "This does not mean you must rush to 'buy'."
He stated: "This highlights the phase where miners are under pressure." and added:
"In the short term, these periods are often bearish, as miners may need to increase sales to cover production costs."
The analyst concluded that, from a long-term perspective, these forced sales "historically create very strong accumulation opportunities."
Although miners' BTC reserves remained relatively stable throughout 2025, there has been continuous selling since early October. Known miner wallets totaled approximately 1.8 million BTC on Tuesday, a decrease of 5,000 BTC since October 10th.
BTC Price Trapped Between Two Trend Lines
Bitcoin's recent rebound encountered resistance at the $93,300 year-to-date opening price resistance level, which coincides with the 200-week simple moving average (SMA), as shown in the 4-hour chart below.
Analysts pointed out that despite this, BTC/USD found support in the $89,000-$90,500 demand zone, where the current 50 and 100-week SMAs are also located.
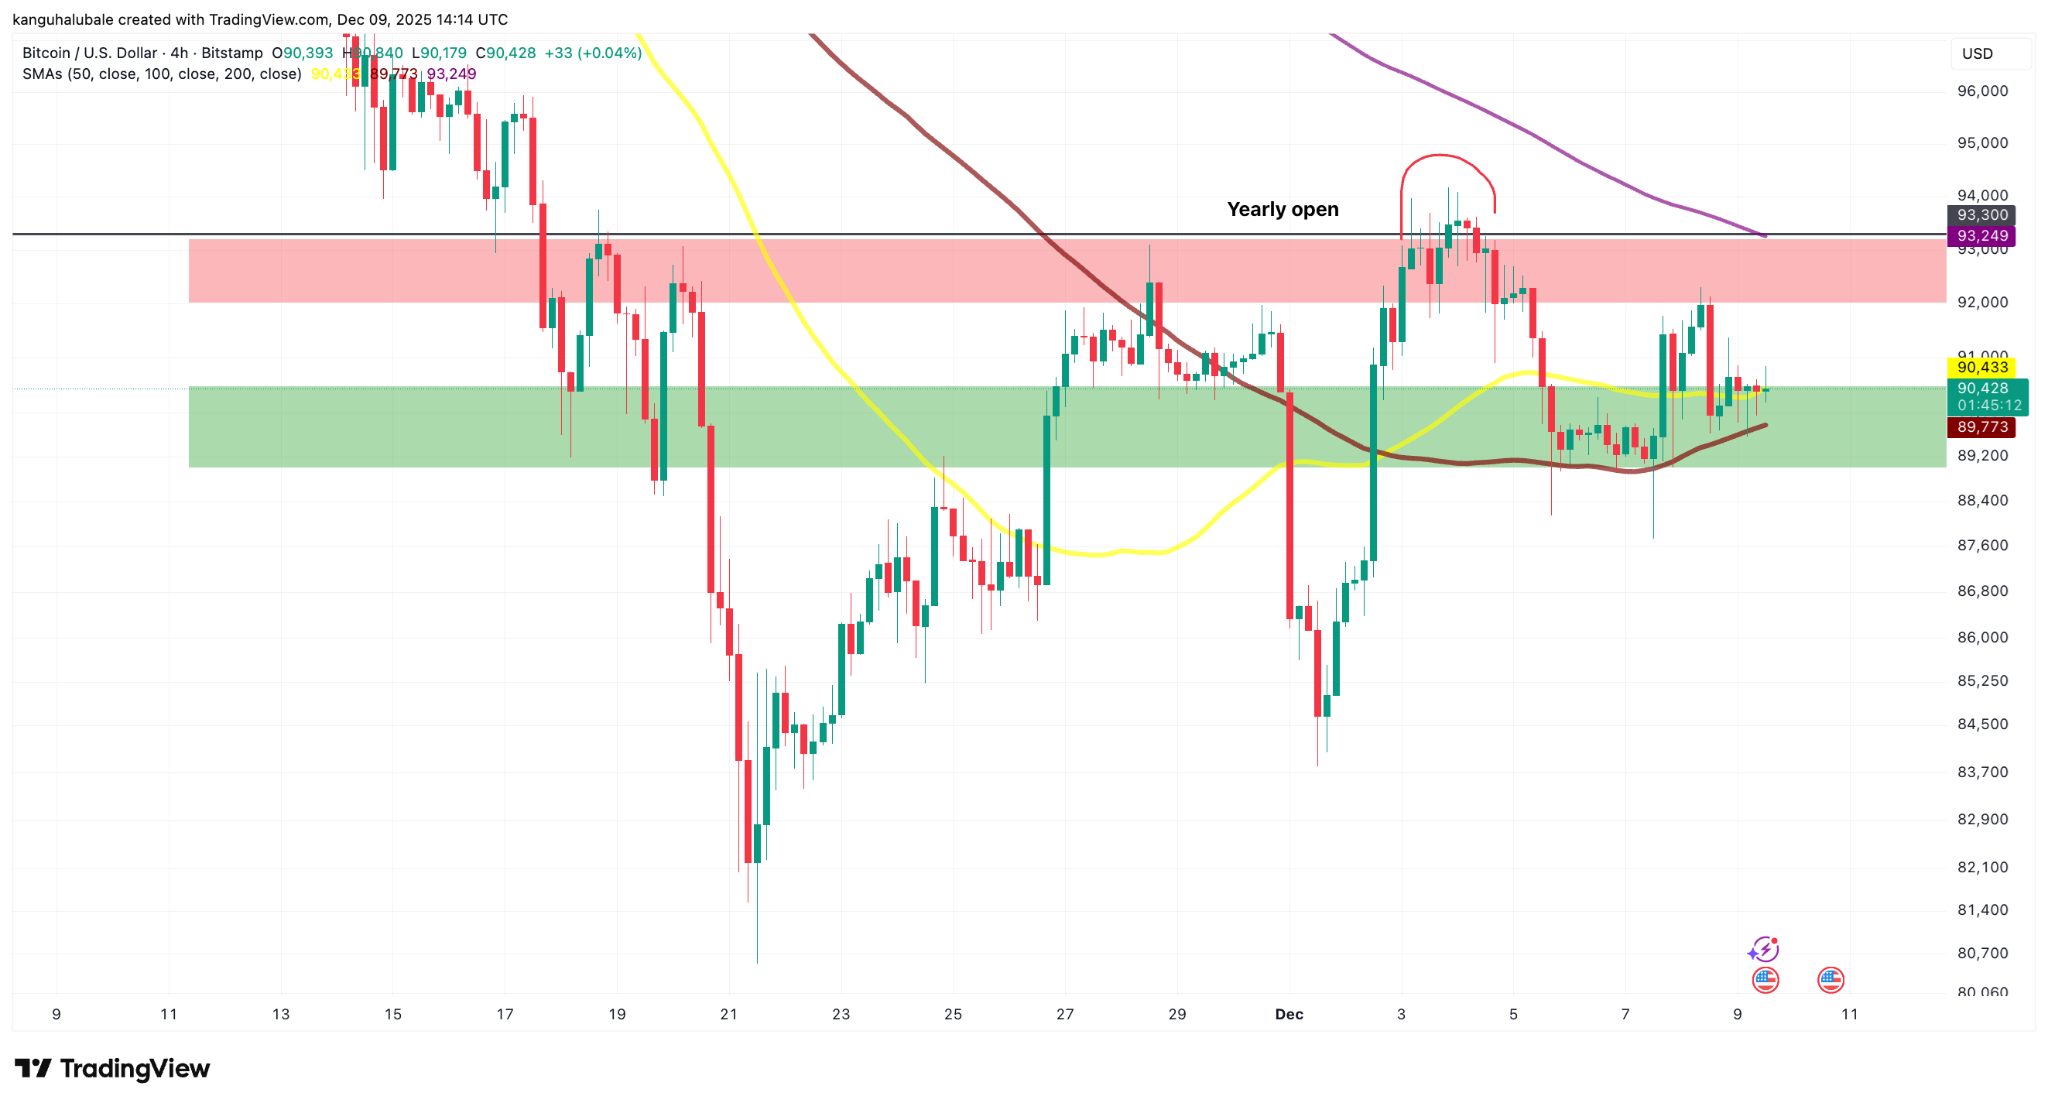
Market experts believe that the Bitcoin price needs to break through the $92,000 resistance level and surpass the 200-week SMA to break free from the downtrend and achieve a sustained recovery towards $100,000.
Cointelegraph previously reported that bearish forces will attempt to pull the price below the $90,000 support level, which could lead to an extended decline, even falling to the $40,000 level.
Related recommendation: Bitcoin FOMO sentiment reappears at the $94,000 level, but the Fed may pour cold water on this rally
This article does not contain investment advice or recommendations. Every investment and trading move involves risk, and readers should conduct their own research when making a decision. Although we strive to provide accurate and timely information, Cointelegraph does not guarantee the accuracy, completeness, or reliability of any information in this article. This article may contain forward-looking statements subject to risks and uncertainties. Cointelegraph is not responsible for any losses or damages arising from your reliance on this information.