Author: Jim Paulsen
Compiled by: Deep Tide TechFlow
Deep Tide's Guide: The notion that tech stocks "always outperform" has become almost a creed for a generation of investors. However, the author, using a century of data, points out that the current period of tech dominance is the longest in history yet offers the worst returns. Understanding this history helps avoid mistaking cyclical booms for eternal truths.
The U.S. Is Undergoing Its Longest but Worst-Performing Tech-Dominated Stock Market Cycle in the Past 100 Years
Technology stocks have led the market for so long that an entire generation of investors has been conditioned to believe they are the quintessential buy-and-hold assets because they "always outperform." Of course, they experience periodic pullbacks along the way, but these are seen as good opportunities to buy the dip and add new innovative companies to the portfolio.
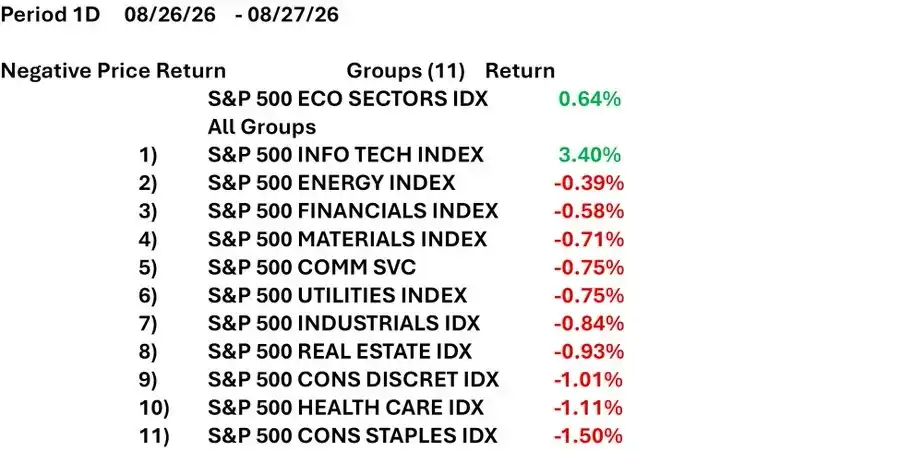
As the chart below shows, last Thursday was a typical example of the intensified market divergence in recent years. In just one day, 10 of the 11 sectors that make up the S&P 500 fell, with declines ranging from -0.39% to -1.50%. Yet, the S&P 500 index itself rose a solid +0.64% because the sole Information Technology sector soared by +3.4%! Alas, why should we struggling investors buy anything other than tech stocks?
To put today's amazing tech-led market into perspective, it might be enlightening to study the history of tech stock leadership cycles and compare how good or bad the current cycle truly is. Have the establishment of cloud computing infrastructure in recent years, the mobile and social media revolutions, and the transition to the AI era created the "best" tech-dominated stock market in U.S. history? Or is contemporary tech innovation and the sustained outperformance of tech stocks merely average compared to history?
The History of Tech Leadership Cycles
Figure 1 shows the relative total return performance of the U.S. technology sector since 1926. Prior to 1989, it uses the Computer, Software, and Electronic Equipment sectors from the Kenneth R. French publicly available database, compared against a U.S. total market index. Post-1990, it compares the S&P 500 Information Technology sector index against the overall S&P 500 index.
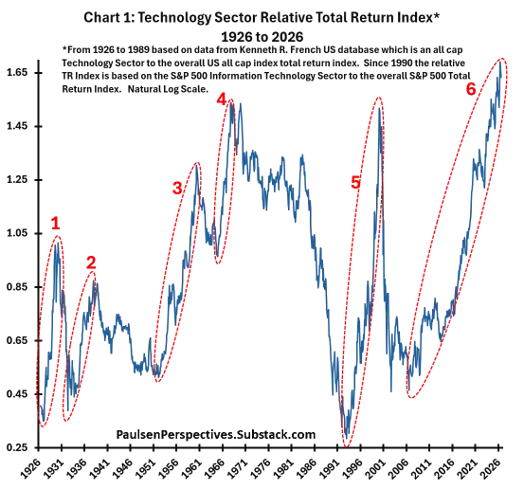
Since 1926, there have been six prolonged leadership cycles for the U.S. technology sector, marked by red dashed lines in Figure 1. I've used a qualitative approach to identify these leadership periods, defined from a low in relative total returns to the next major high in relative total returns, without any substantial long-term period of underperformance beforehand. My goal isn't to debate overall bull or bear markets, but merely to capture those sustained periods when the market was dominated by outperforming tech stocks. Of course, one could define these cycles differently, but this method does seem to highlight the major eras when U.S. equities were led by innovative companies.
Below are brief summaries of each cycle, with most content taken from AI-generated text snippets. Quite fitting—a history of technology, generated largely by technology!
The first major leadership cycle in the past 100 years occurred between March 1927 and August 1929 (marked #1 in Figure 1), essentially marking the end of the "Roaring Twenties"! During this period, the stock market was driven by transformative technological and industrial innovations that reshaped American life and the economy. Key innovations included: commercial radio and mass communication propelled by companies like RCA; mass production of automobiles led by giants like General Motors; radical innovations in polymers, plastics, and synthetic chemicals spearheaded by DuPont and Union Carbide; and a surge in public excitement about commercial aviation after Charles Lindbergh's historic transatlantic flight in 1927.
The next leadership cycle lasted from May 1932 to December 1937 (marked #2 in Figure 1), primarily catalyzed by the stabilization of the U.S. banking system post-Great Depression. The U.S. effectively abandoned the traditional gold standard and devalued the dollar, reflating the financial system with massive liquidity, halting the brutal deflationary spiral of 1929–1932, and encouraging cheap capital to seek high-growth industrial assets. During this period, the Dow Jones Industrial Average rose nearly 500%, with widespread radio adoption as a key driver, becoming the primary medium for news, entertainment, and political speeches (like Roosevelt's "fireside chats"). Aviation and logistics also grew, driven by reliable airmail contracts and safer passenger planes, fostering technological innovation. Additionally, federal spending from the New Deal on infrastructure, rural electrification, and modernization projects that directly benefited tech manufacturing, coupled with America's goal of beginning military modernization, added fuel. Finally, regulatory clarity and the establishment of the SEC brought certified corporate financial disclosures and outlawed insider manipulation rings, helping restore public and institutional trust in Wall Street, further fueling the boom.
The next tech leadership period from 1952 to 1960 (marked #3 in Figure 1) was driven by a combination of postwar commercial innovation, massive Cold War defense spending, and pure speculative psychology. Key drivers included: commercialization of the transistor (transition from bulky vacuum tubes to solid-state electronics); the Cold War and Space Race (U.S. panic after the Soviet launch of Sputnik in 1957); early computing breakthroughs (emergence of early mainframes to automate complex operations, and foundational high-level programming languages like FORTRAN and COBOL); and speculative mania and "name game" psychology (much like the ".com" craze of the 1990s or modern AI hype, investors were fascinated by company names. A firm could become a market darling simply by adding suffixes like "-tron" or "-tronics" to its name.)
The tech stock surge from 1964 to 1967 (marked #4 in Figure 1) is often viewed as the pinnacle of Wall Street's "Go-Go Years." It was driven by Space Age technological innovation, the birth of aggressive mutual fund trading, and widespread retail speculation. During this brief window, investors wholly abandoned boring old-economy blue chips for high-flying "glamour stocks." Core drivers of this boom included: "Space Age" and R&D frenzy (investors began treating high R&D spending not as a current expense but as a "magic elixir" guaranteeing massive future profits—does this sound familiar to today's AI capex boom?); the "Electronics Craze" (companies saw their stock prices soar simply by adding "-tronics" or "computer" to their names—like being labeled an "AI" company today?); the rise of "gunslinger" fund managers (before the mid-1960s, mutual funds were managed by conservative, steady committees. This era spawned a new type of aggressive individual portfolio manager, known as "gunslingers." They traded massive volumes of stock, seeking short-term capital gains rather than long-term dividends. This rapid trading pace injected substantial "hot money" into tech stocks—somewhat akin to recent Meme stock investors, crypto players, or gold bugs?); and finally, the "predecessor to the Nifty Fifty" (a handful of premier, highly innovative tech companies became market darlings, leading with huge gains. Investors viewed them as "one-decision" stocks, to be bought and never sold—today's equivalent being FAANG and the Magnificent Seven).
The tech stock boom from 1992 to 2000 (marked #5 in Figure 1), culminating in the infamous Dot-com bubble, was primarily driven by the commercialization of the internet, unprecedented venture capital inflows, and broad retail speculation. Core drivers of this tech frenzy included: the birth of the World Wide Web; the "Get Big Fast" mentality (venture capitalists and investors prioritized market share and user growth over traditional financial metrics like profits or revenue); Y2K concerns; democratization of investing (the rise of online brokerages in the 1990s and affordable personal computers allowed ordinary retail investors to day-trade tech stocks for the first time, creating a massive speculative feedback loop); and finally, cheap money (interest rates remained low for most of this period).
Finally, the contemporary tech stock rally from 2006 to 2026 (marked #6 in Figure 1) is driven by four structural shifts in computing, communication, and monetization: the Mobile Revolution (2007–2015, smartphones kept people always connected); Cloud Computing (2006–present, bringing Infrastructure-as-a-Service and subscription models); Digital Advertising & Platform Monopolies (2010s); and finally, Artificial Intelligence & Semiconductors (2023–2026).
Some Observations on Past Tech Bull Markets
One crucial conclusion from studying Figure 1 is that tech stocks are not "buy and hold" investments. Given the historically significant and prolonged periods of tech outperformance, it's easy to think one should always buy and hold tech stocks. Indeed, many investors likely feel that way today. Imagine if you had bought IBM or Apple at their IPOs and never sold. Sounds great, but broadly diversified tech stock investments have historically not exhibited "buy and hold" characteristics.
The probability of U.S. tech stocks outperforming the overall market's total return across all months since 1926 is 50.5%. This means buying tech at any random moment is essentially a coin flip, suggesting "buy and hold" is unlikely to consistently beat the overall market. Conversely, correctly "timing" tech bull and bear markets (i.e., long leadership and long laggard periods) could yield significant alpha. Since 1926, during the highlighted long tech leadership periods in Figure 1, tech stocks outperformed the overall market 58.1% of the time on average. During all other months, it was only 44.5%. Clearly, over the long run, simply buying and holding tech stocks is unlikely to be a winning strategy. But a strategy that can correctly identify leadership and laggard periods may produce better investment outcomes.
This becomes evident just by looking at Figure 1. Except for period #3, after each leadership cycle ended, once tech stocks began underperforming, they continued to underperform until essentially returning to the level where they started in 1926 at the beginning of Figure 1. That is, despite several strong tech bull markets in history, tech stocks have repeatedly ended up delivering only market-average performance since inception. Despite episodes of massive outperformance, by the mid-1930s tech stocks were back to performing only in line with the market since 1926, and nearly did so again in the early 1950s. From 1926 to the early 1990s, tech stocks were "underperformers" since inception, only returning to market-average performance again by 2006. In other words, no matter how impressive tech bull markets have been, they have been matched by equally numerous and severe bear market cycles. Therefore, simply deciding to "buy and hold" tech stocks, while possibly spectacular in the medium term, has not been successful long-term. In fact, a long-term buy-and-hold approach to tech stocks would likely have delivered only market-average returns with much greater volatility.
Second, tech stocks have historically experienced both long leadership and long laggard cycles. The six leadership cycles shown in Figure 1 lasted an average of 93 months, or 7.75 years. While often interrupted by significant and painful corrections, during these tech bull markets, tech stocks on average tended to maintain a relative uptrend for extended periods. However, investors should also note that tech stocks' long periods of relative total return underperformance are "longer" and equally brutal. The five complete long tech laggard cycles since 1926 lasted an average of 132 months, or 11 years!
Having experienced such a long and gentle period of sustained contemporary tech stock outperformance (the current long leadership cycle, as shown in Figure 1, has persisted since 2006), investors should remember: although tech stocks have historically offered "amazing" (isn't that the word most often used today for tech EPS?) possibilities for outperformance, they have also subjected investors to "biblical-level bad" or even longer periods of underperformance. When investing in tech, "buying and holding" (with hope) may lull you into success during mid-cycle triumphs, but to profit over a lifetime, successful "timing" is essential.
Third, interestingly, tech stocks have performed well and poorly under almost any economic environment. There seems to be no stable relationship between economic characteristics and tech stock performance. Tech performed well during the prosperous 1920s, the post-Depression recovery of the 1930s, and the 1990s boom. However, tech performed poorly during the 1940s despite solid real economic growth; underperformed during 1960–1965 when real GDP growth was mostly solid; and underperformed during the 1980s despite generally good growth. What about inflation? Tech underperformed during the high inflation of WWII but performed roughly in line during the stagflation of the 1970s and performed well during the inflation spikes of the 2020 pandemic and Iran war.
Unlike the old economy, which is driven mainly by industrial and consumer activity. Stocks related to new-era activities, both today and in the past, seem far less bound by economic characteristics. These include real growth, inflation, unemployment, bond yields, or economic policy. That is, tech cycles appear more dependent on the state of innovation. They also depend on the intensity of R&D and other investment spending. They also depend on how long and how far tech stocks have outperformed or underperformed the market. They also depend on the degree of investor sentiment towards these stocks. Is sentiment overly pessimistic or overly optimistic?
Fourth, whether bull or bear, long tech leadership cycles typically begin and end with a "bang"! Most of the six cycles marked in the chart exhibit a "V-shaped" pattern at both the starting low and ending peak. That is, tech leadership cycles start and end "violently," with little technical warning. Relative total return bottoms suddenly reverse and move higher quickly, while investors are still pondering if the previous long tech bear market is over, or if the current rally is just a false start. Similarly, tech leadership cycles often end with a sharp drop. Tops rarely show rounded warning patterns. Declines usually worsen rapidly, while most investors are still excitedly awaiting another "dip-buying" opportunity!
Finally, how should investors best "judge" whether tech stocks at any given moment remain a good long-term buy or are approaching a new long-term decline? This is a very difficult decision! My guess is the best approach involves monitoring a set of indicators. These include: how long tech stocks have been long-term leaders, and the magnitude of their outperformance during the current leadership cycle. Also, the level of excitement and aggressiveness exhibited by U.S. business behavior, such as investment spending, cash flow usage, debt usage, and the excitement of talking big about the future. Also, the degree of cultural attention in the stock market displaced by the tech craze, i.e., how enthusiastic or short-sighted the media is about tech. Also, the level of enthusiasm, conviction, and complacency displayed by investors. Whatever method one chooses for this crucial decision, it has been and likely will continue to be a tough call. Looking back at Figure 1, it was easy to say the long tech bull market was over in 1935, 1955, 1997, 2020, or 2022. Each time it proved premature. Similarly, it was easy to decide to jump back into tech in 1942, 1948, 1989, or 2002. Each time it would have been costly.
Comparing Long Stock Market Bulls!
How does the current "tech rally" compare to the other five major long tech bull markets since 1926?
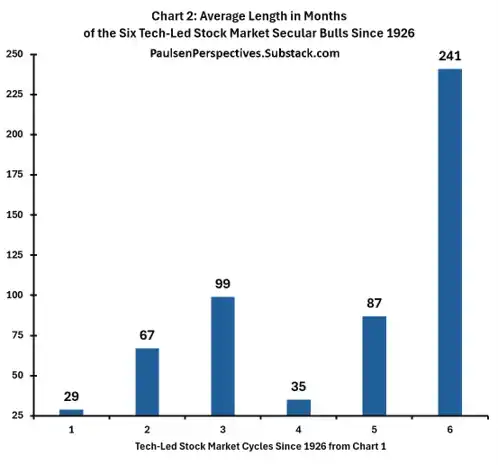
Compared to past historic rallies, the current tech rally stands out in one respect. It is the "longest" long-term tech stock rally of the past 100 years, and by a wide margin. As shown in Figure 2, the average length of the previous five tech rallies was 63.4 months, or 5.28 years. In fact, the longest rally before the current one ended in 1960 (period #3 in Figure 1) lasted only 99 months, or 8.25 years. The Dot-com bubble rally lasted just 87 months. In contrast, today's "ongoing" long tech stock rally has entered its 241st month, just over 20 years! This may explain why so many investors wonder if they need to own anything besides tech. It also explains why the tech sector dominates nearly all public investment discussions. After 20 years of sustained investment success, in the eyes, hearts, and souls of many, the stock market has become synonymous with "tech"!
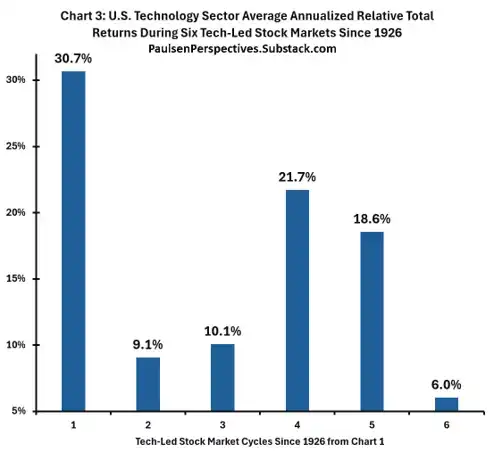
As shown in Figure 3, the current long tech bull market is also historically distinctive because it has generated the smallest average annualized excess return relative to the overall stock market. This comparison may surprise most investors. Despite tech stocks proving to be outstanding investments over recent decades, their overall relative results are the worst among all tech leadership cycles of the past century. Since 2006, the current tech rally has generated only a 6% average annualized excess market return. This is even less than the weakest historical tech rally since 1926.
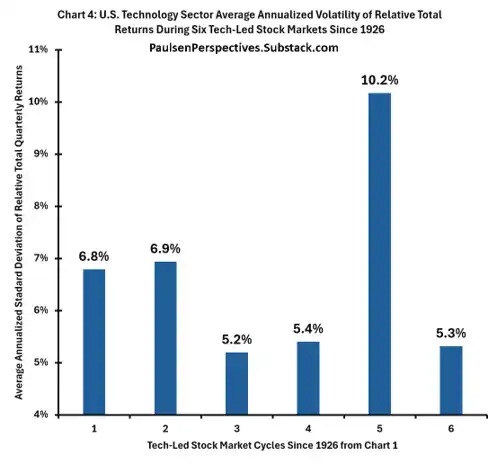
Perhaps unsurprisingly, given its overall return stream is inferior to previous long tech rallies, as shown in Figure 4, the current tech rally has subjected investors to fairly low relative total return volatility. Today's relative return volatility is nearly on par with the major tech rallies of the 1950s and 1960s. It is also far lower than the relative return volatility associated with the Great Depression-era cycle or the Dot-com bubble cycle. In fact, the Dot-com bubble cycle stands alone. It subjected investors to relative return volatility far higher than any other cycle since 1926.
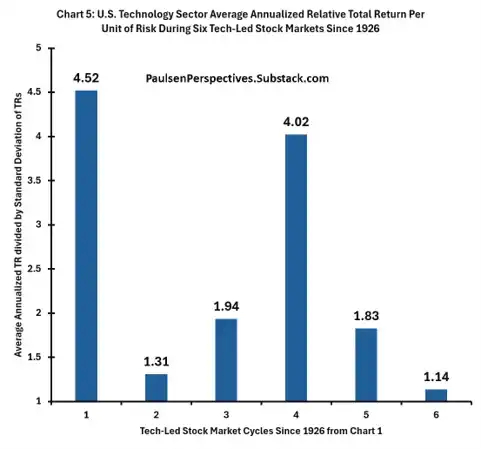
Finally, the relative total return per unit of risk for the contemporary stock market is also the lowest among all long tech stock rallies since 1926 (Figure 5). The tech rally driven by the launch of IBM mainframes in the 1960s provided the best return per unit of risk. So did the rally as America emerged from the Great Depression in the 1930s. The primary reason is that both generated much higher overall average annualized relative total returns.
Final Comments
This article is more of a commentary than a bold judgment on what to do with tech stocks. Nevertheless, the stock market has been "led" by the technology sector for 20 consecutive years. It's worth taking some time to understand the history of tech-dominated markets over the past 100 years. I believe the current cycle has lasted longer than any previous long tech rally. One reason is that the current cycle has been more about persistence than explosion. Persistence may prove sustainable, while explosions lead to crashes. At least that has been the case until the recent AI mania significantly heightened investor enthusiasm and corporate aggressiveness.
I'm growing increasingly uneasy as more cautionary signals emerge suggesting this cycle is becoming more bubble-like. As shown in Figure 1, the tech sector relative total return index just hit a 100-year high, and the downside looks substantial. Its 20-year leading rally is twice as long as any since 1926. Perhaps tech will lead the stock market for an entire 40–45 year investing career? Who knows.
The U.S. business community's attitude toward the latest tech craze has become more excited lately. Their behavior has also grown more aggressive: burning cash flow, rapidly advancing capex plans, and even levering up. The financial news feed is almost completely dominated by "tech/innovation stories." There are now Wall Street analyst word-frequency data sequences mentioning "AI." Videos of robots mowing lawns, performing surgery, and even breaking the 100-meter sprint record are going viral. At a minimum, complacency around tech stocks has clearly warmed, if not become quite extreme, after 20 years of uninterrupted success.
Tech earnings seem to be rocketing to the moon (or even Mars), and tech stocks have been winning for so long. Who has the guts to really call a top? I don't dare. I might ultimately be right, but perhaps just 5 years early? Ha! So, while timid me is not saying a top is near, I am saying: there is enough concerning information. Investors should consider underweighting the stock market's tech/new-era sector. Not selling out entirely, but reducing exposure.
I leave you with the following chart. It provides yet another concerning indicator: risks are rising for this long tech bull market. Figure 6 overlays the U.S. tech sector relative total return index since 1955 (blue line, left axis). It also overlays the detrended real investment per worker ratio (red line, right axis). Bold green numbers mark the tops of previous long tech cycles and the location of the current cycle (originally shown in Figure 1).
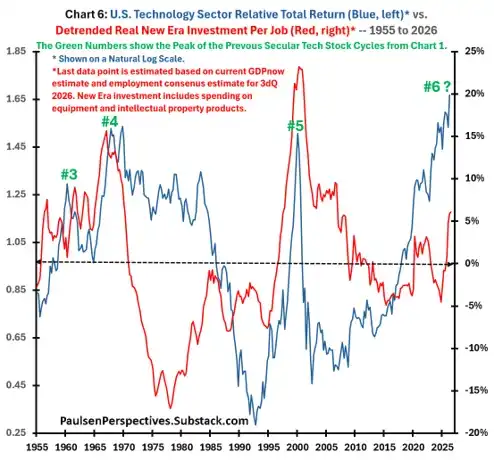
At least since WWII, there has been a fairly close relationship between tech stock relative performance and "aggressive" corporate spending relative to employee headcount. Notice that when the detrended real investment per worker rises above zero (meaning investment spending per worker is above average), it has often signaled that a tech-dominated market cycle is nearing its end. In previous cycles #3, #4, and #5, once investment per worker rose significantly above zero, the cycle ended relatively quickly. In recent quarters, this ratio has surged above zero. The current level is comparable to the level that signaled the end of cycle #3.
Undoubtedly, the tech rally could continue for a while longer. But a series of cautionary signals are emerging, and the risk of concentrated bets on tech is rising. I'd like to say "be bold." But perhaps the most realistic action, in the face of a 20-year unbroken leading trend that still exists, is to simply "be a little more cautious"!
Thanks for reading! Jimp
Disclosures
Please note that stocks are inherently risky. Any stock can lose most of its value at any time, including any I mention here. You should never rely on a single source for investment decisions, including me. I am a retired investment strategist offering views and observations on markets, the economy, and companies. You should conduct your own research and consult with qualified financial planners and investment advisors before making investment decisions.
This communication is for your information only. This material is for illustration and discussion purposes only and should not be considered financial, legal, tax, or investment advice. The material provides information as of the date indicated and reflects only the author's current expectations. The author may revise but is under no obligation to do so. The views expressed herein are solely those of the author. This material should not be construed as an offer or solicitation to buy or sell any investment, or as a recommendation or offer for any security or issuer.
Certain information is provided by or based on third-party sources. While believed to be reliable, no representations are made as to its accuracy, completeness, or timeliness. This information may change at any time without notice. I undertake no obligation to maintain or update this material based on subsequent information and events. I also undertake no obligation to provide any additional supplemental information, updates, or corrections to the information herein. Any views and assumptions herein are as of the date of this communication. They may change or be withdrawn at any time without notice. The author assumes no responsibility for any loss arising from the use of the information contained herein.
Any financial instruments mentioned are speculative in nature and may involve risk of loss of principal and interest. Any prices or levels shown are historical or purely indicative. This material does not consider the specific investment objectives, financial situation, or needs of any particular investor. It is not intended to recommend any specific securities, investment products, or other financial products or strategies to any specific client. The securities, investment products, other financial products, or strategies discussed may not be suitable for all investors. Recipients of this report must make their own independent decisions regarding any securities, investment products, or other financial products.