Author:Surf
Key Findings
The following conclusions are based on 787 million de-duplicated trades and 1,733,011 wallets in the Polymarket International market from January to June 2026, combined with venue-level data from Polymarket US.
- A second Polymarket market is forming rapidly: The monthly trading volume of the CFTC-regulated US market as a percentage of the International market rose from 5% in January to 47% in June, and further reached 67% in July.
- High-turnover categories are the fee engines: Sports and crypto markets contributed about 98% of the approximately $184 million in gross fees in the International market for H1; the crypto market generated $96.3 million in fees from about half the trading volume, exceeding the $83.5 million from sports markets.
- User count and volume are highly misaligned: Retail wallets constitute about 90% of users, but bots and professional users together contribute about 80% of taker volume; bots, representing only 5.9% of wallets, account for about two-thirds of trades.
- User acquisition is not driven by single blockbusters: The single largest onboarding market in H1 brought in fewer than 7,000 new wallets, while total new wallets were about 1.13 million; in any given month, the top 15 onboarding markets also accounted for only 8%–19% of that month's new wallets.
- No single market category significantly boosts platform retention: About 51%–57% of monthly active wallets return the following month, but users often leave their initial entry category and move to other categories on the platform.
- The bot cohort as a whole is profitable, but the median is still in the red: The bot sample achieved about $108 million in net profit, but only 27% of bot wallets were profitable; among the approximately 1.75 million wallets, only 146 wallets maintained positive cash flow for six consecutive months.
Part I: A Panoramic View of Two Polymarket Venues
Polymarket US: A Second Market Takes Shape
In the first half of 2026, Polymarket effectively operated as two trading venues, though most discussion focused on only one. The International market for non-US users still runs on a Polygon-settled off-chain CLOB, with six-month one-sided volume reaching $17.9 billion; meanwhile, Polymarket US, launched in late 2025 and regulated by the CFTC, grew from 5% of the International market's monthly volume in January to 47% in June, reaching 67% in July (approximately $2B vs. $3B).
The two markets share a brand and a basic order book mechanism, but not order books, user bases, or revenue structures. Like Kalshi, they use off-chain matching, a central limit order book, and the same price-sensitive fee curve for takers: fee = Θ·C·p(1−p). The difference lies in the settlement rails: the International market settles each trade publicly on Polygon, while the US market clears through a private, regulated ledger.
Cross-platform comparisons require consistent metrics. The volume in this article refers to one-sided, taker-side, actual traded dollars counted once; notional amounts and double-counted volumes are typically 2–3 times higher. Recalculating July data using this metric, the commonly cited $41B / $7B / $5B figures correspond to approximately $13.3B / $3B / $2B, respectively.
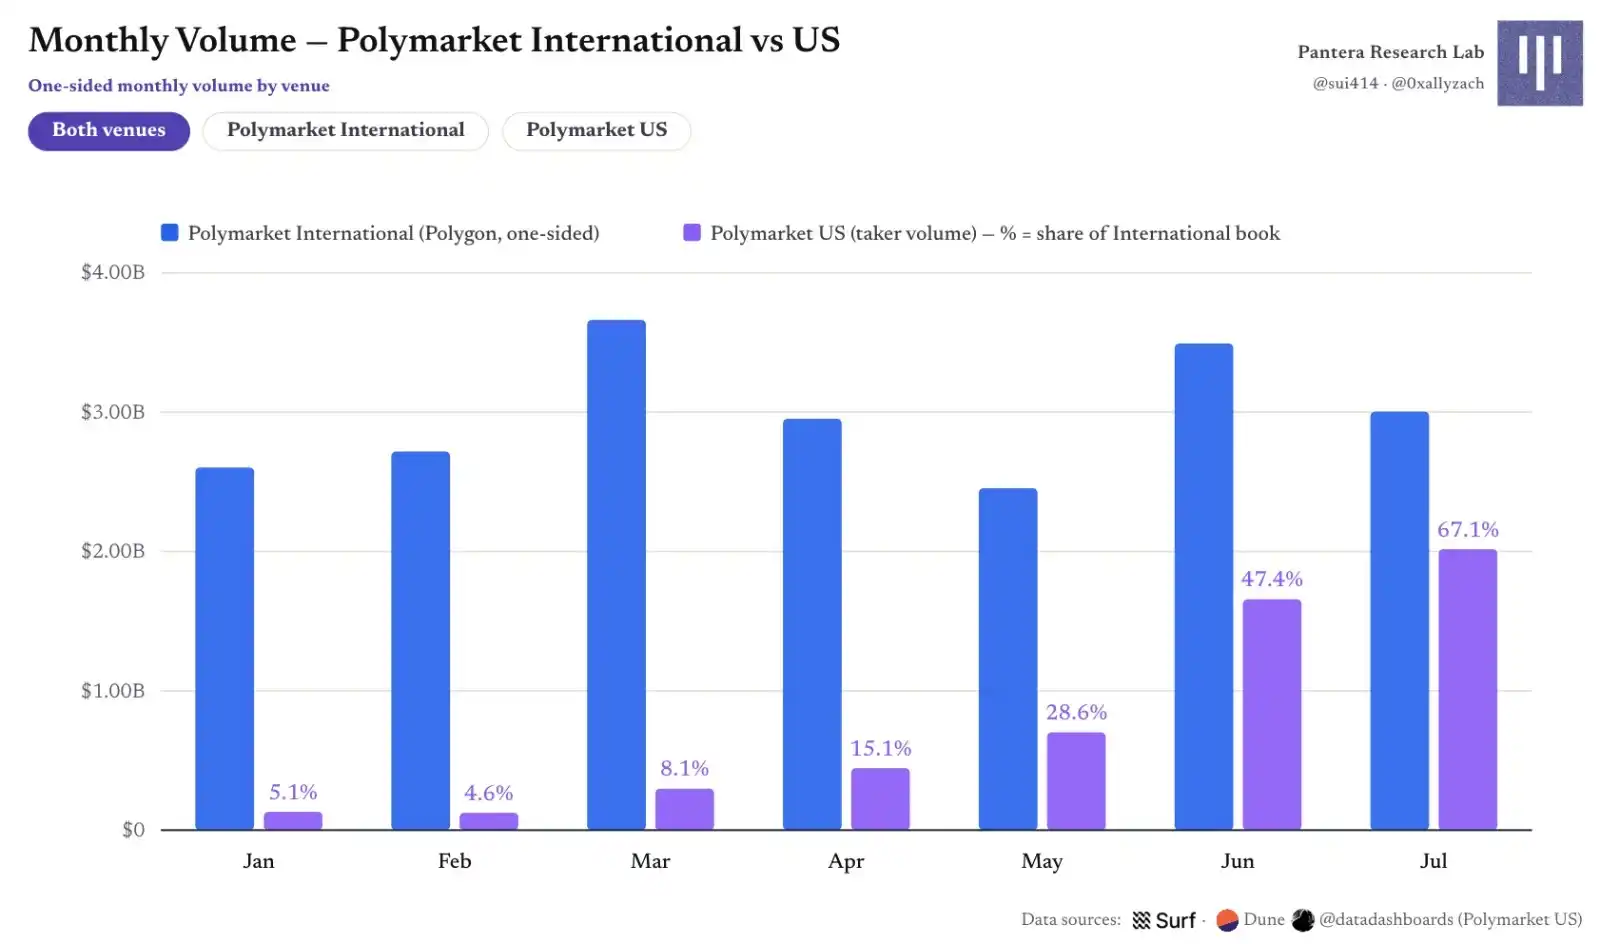
Figure 1 | Polymarket International vs. US Market Monthly One-Sided Volume
Daily volume for the US market grew from around $1 million at launch to $50–100 million in July; daily trade count surpassed 1 million, and open interest once exceeded $150 million. Fee structure changed from a fixed basis-point model in January to the price-sensitive formula activated in April.
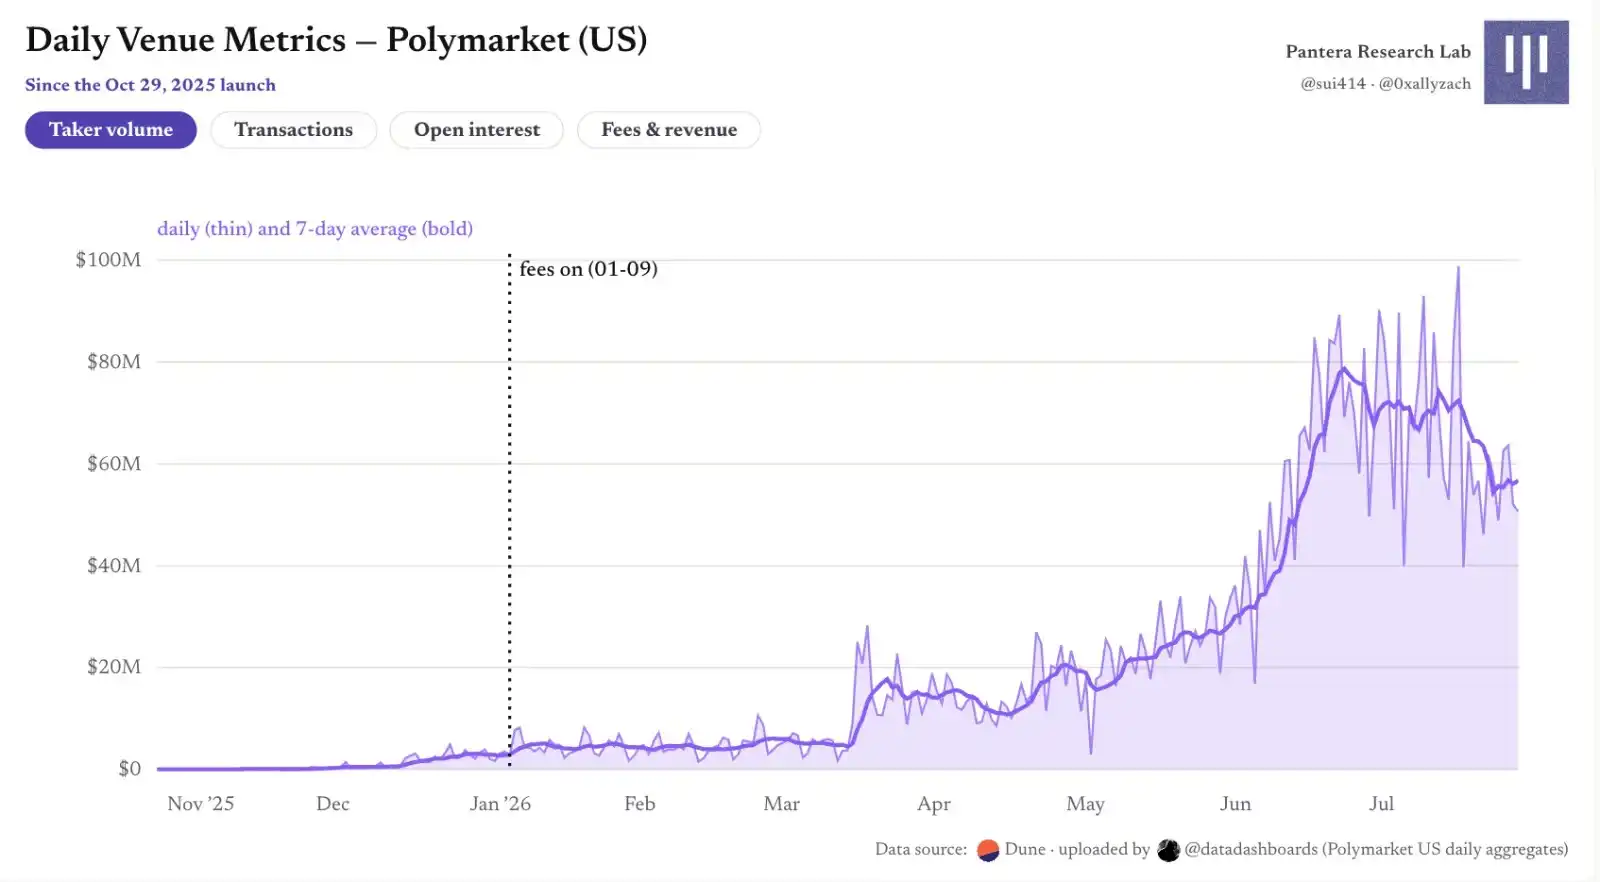
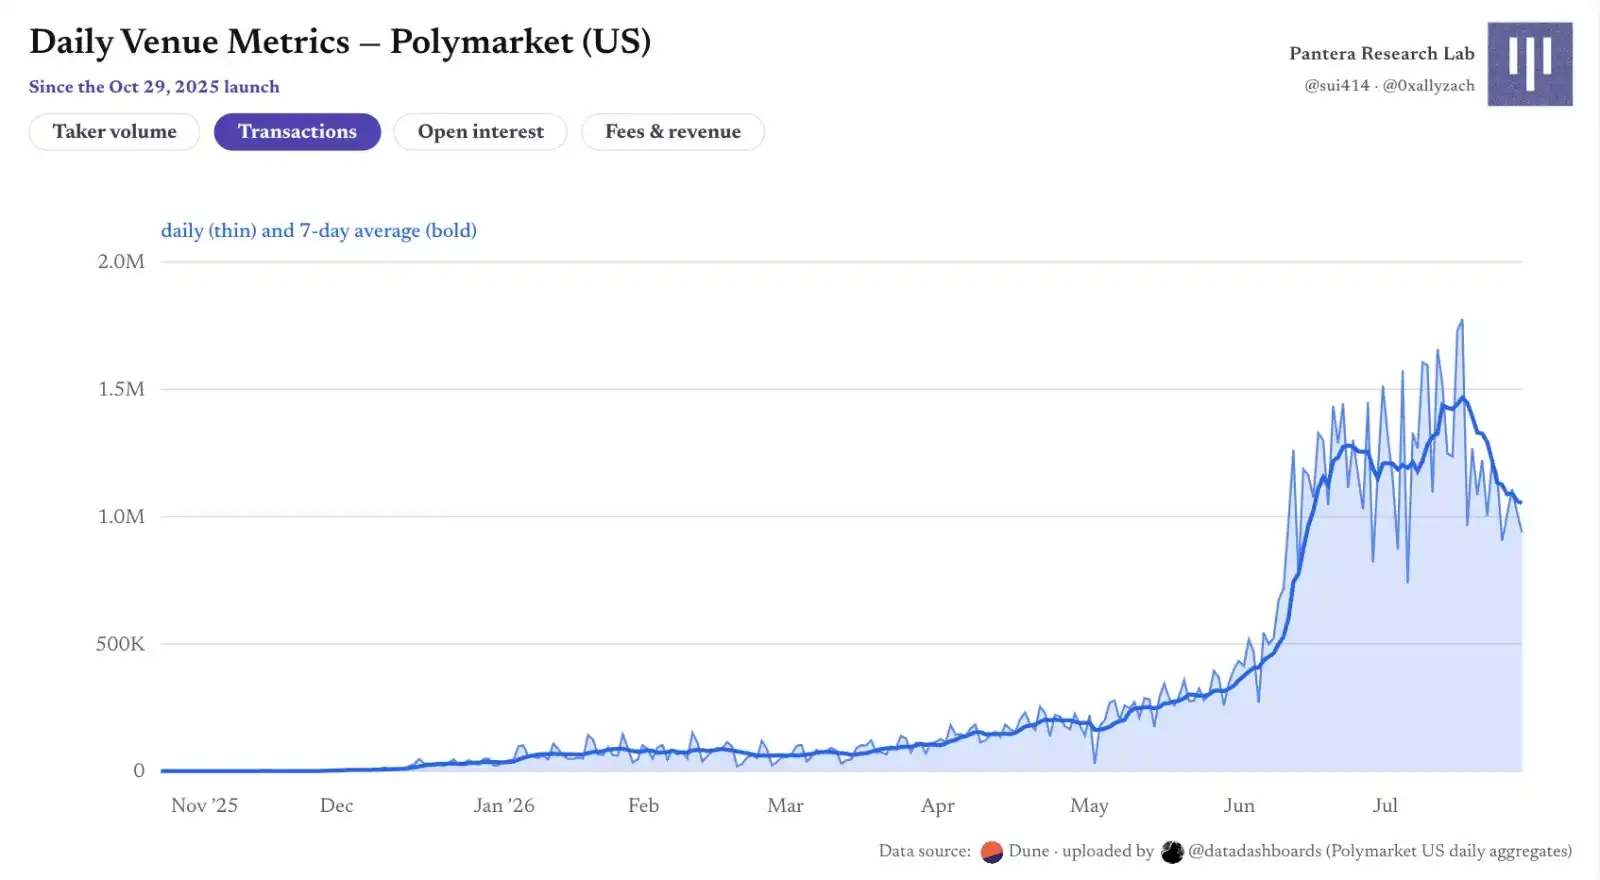
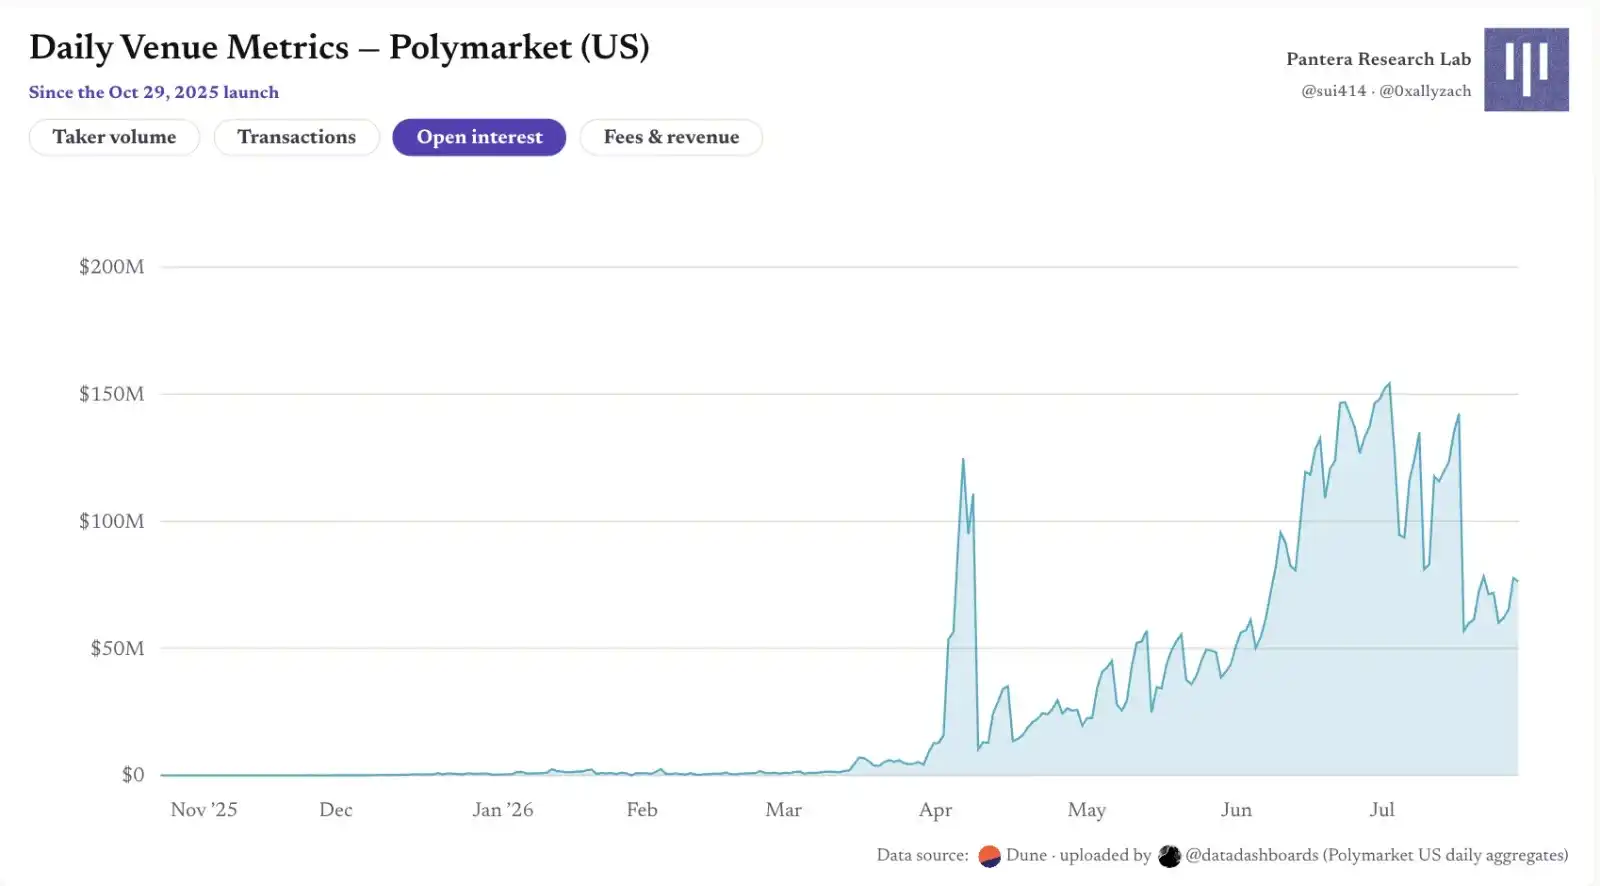
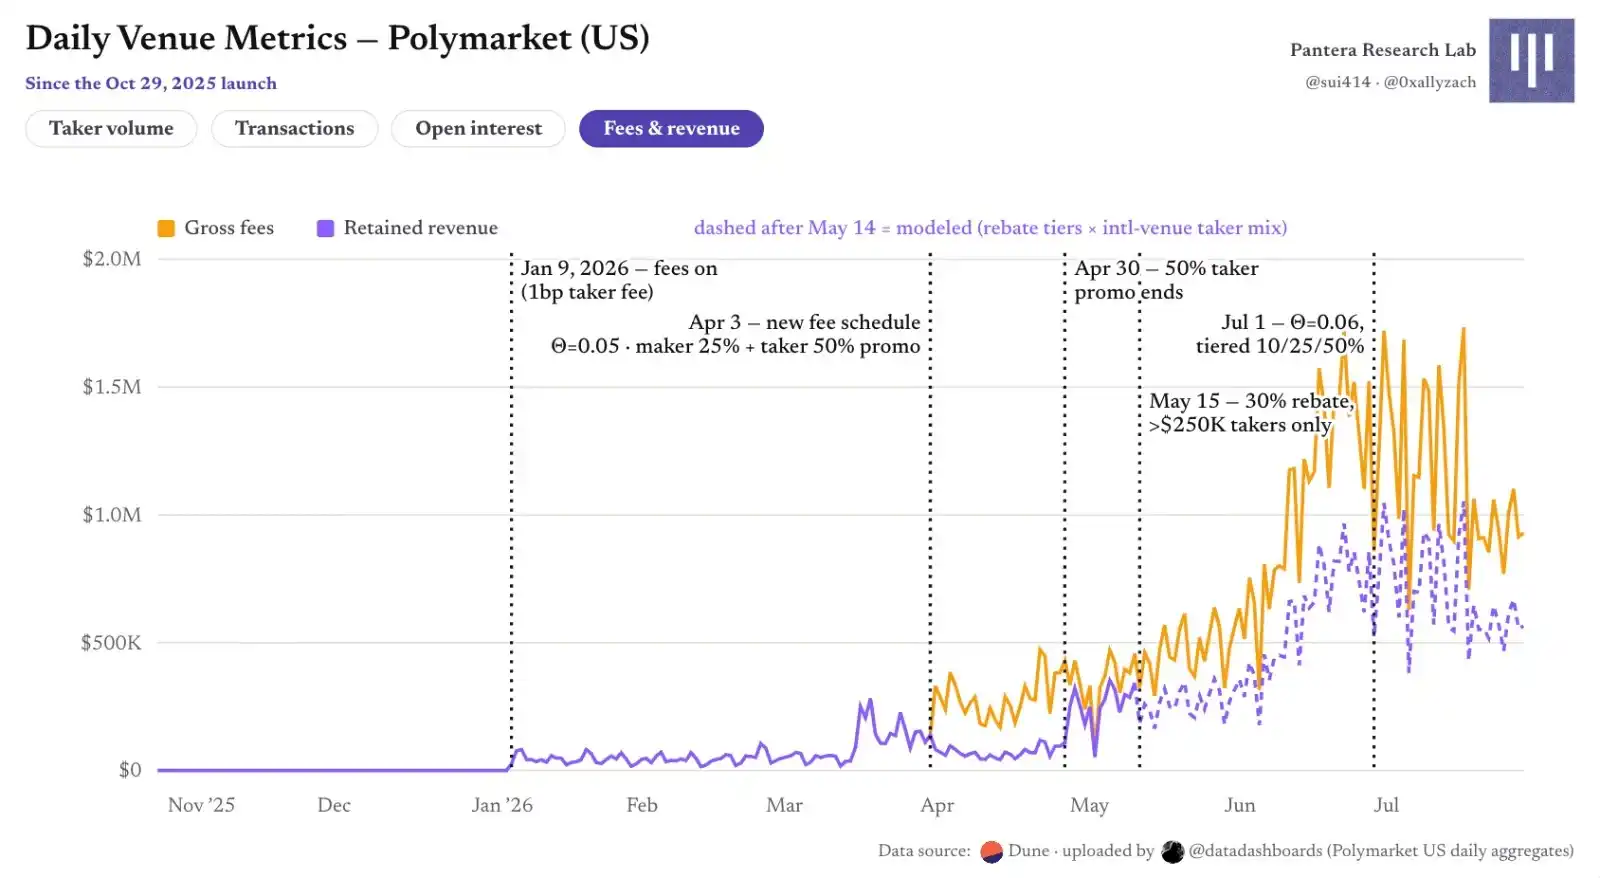
Figure 2 | Polymarket US: Venue-Level Daily Metrics Since Launch
Fee magnitude is also larger than community dataset estimates suggest: just in June, taker gross fees were approximately $30 million. Estimating based on the official rebate program—25% returned to makers on execution, a promotional rebate for all takers ending April 30, and subsequent volume-tiered rebates—retained revenue for June was about $17 million, roughly double the fixed 25% assumption used by many trackers. Without user-level data for the US market, the tier eligibility of large takers can only be inferred from the International market structure where the top 0.3% of takers contributed about 63% of volume.
Fee Economics in the International Market
What is actually traded on the International market? Sports accounts for about half of all volume; crypto accounts for about 30%, with the vast majority being five-minute up/down micro-markets; world/geopolitics accounts for about 15%. Concentration varies more across categories: the largest sports market constitutes only 0.27% of its category, while in Science & Tech, a single market "Will the US confirm alien existence by 2027?" accounts for about a quarter.
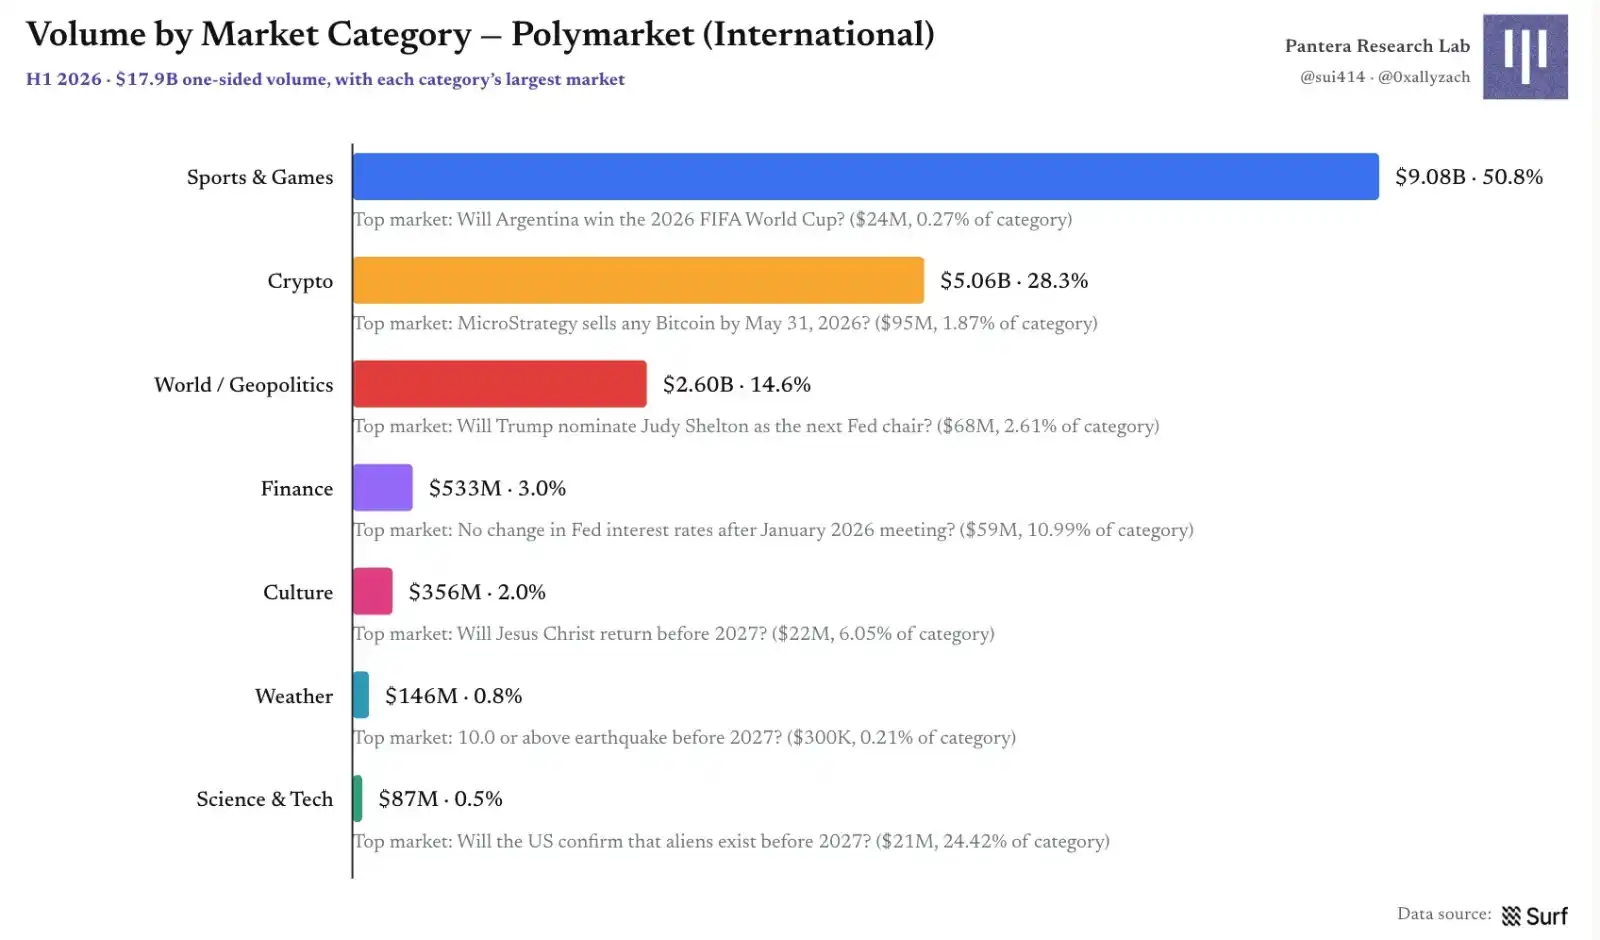
Figure 3 | Polymarket International: Volume Breakdown by Market Category
The International market generated about $184 million in gross fees in H1, but this is not net revenue after deducting maker rebates and incentives. Crypto markets, with only about half the volume of sports, generated $96.3 million in fees, surpassing sports' $83.5 million; the two categories combined account for 98% of total fees. World/Geopolitics intentionally employs a zero-fee strategy.
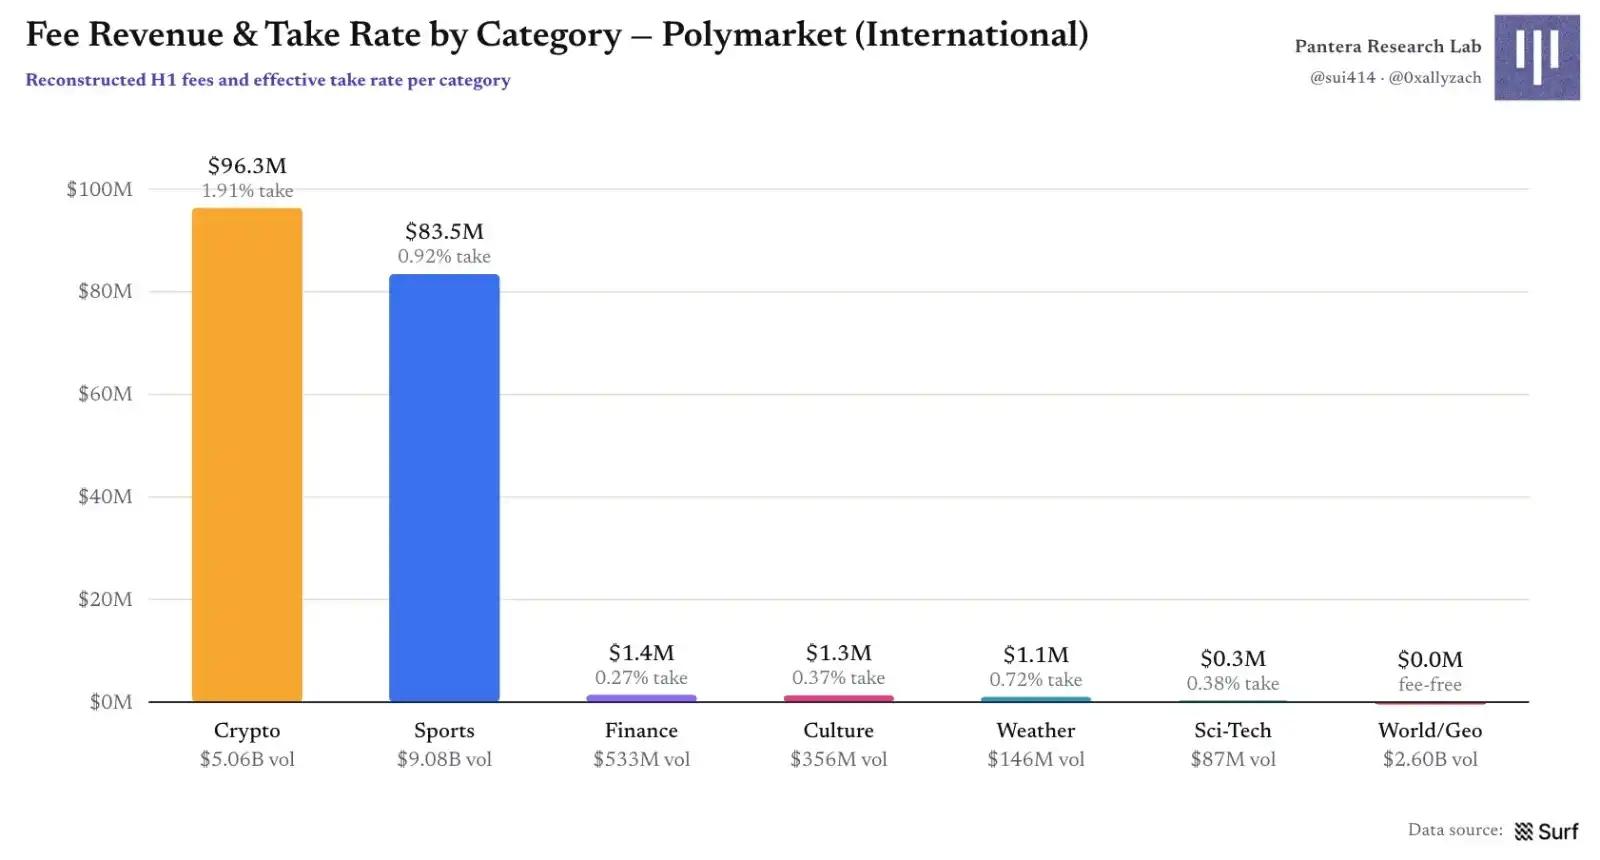
Figure 4 | Polymarket International: Category Fee Revenue and Effective Take Rate
High-Turnover Categories Are the Fee Engines
In July, Kalshi's open interest was about 2.3x that of Polymarket International, but its volume was about 4.4x higher; the corresponding daily turnover rates were approximately 0.44x vs. 0.23x. Polymarket US has the smallest capital pool but runs the fastest with a daily turnover rate of about 0.64x. The answer lies not in the platform name, but in what composes the market directory.
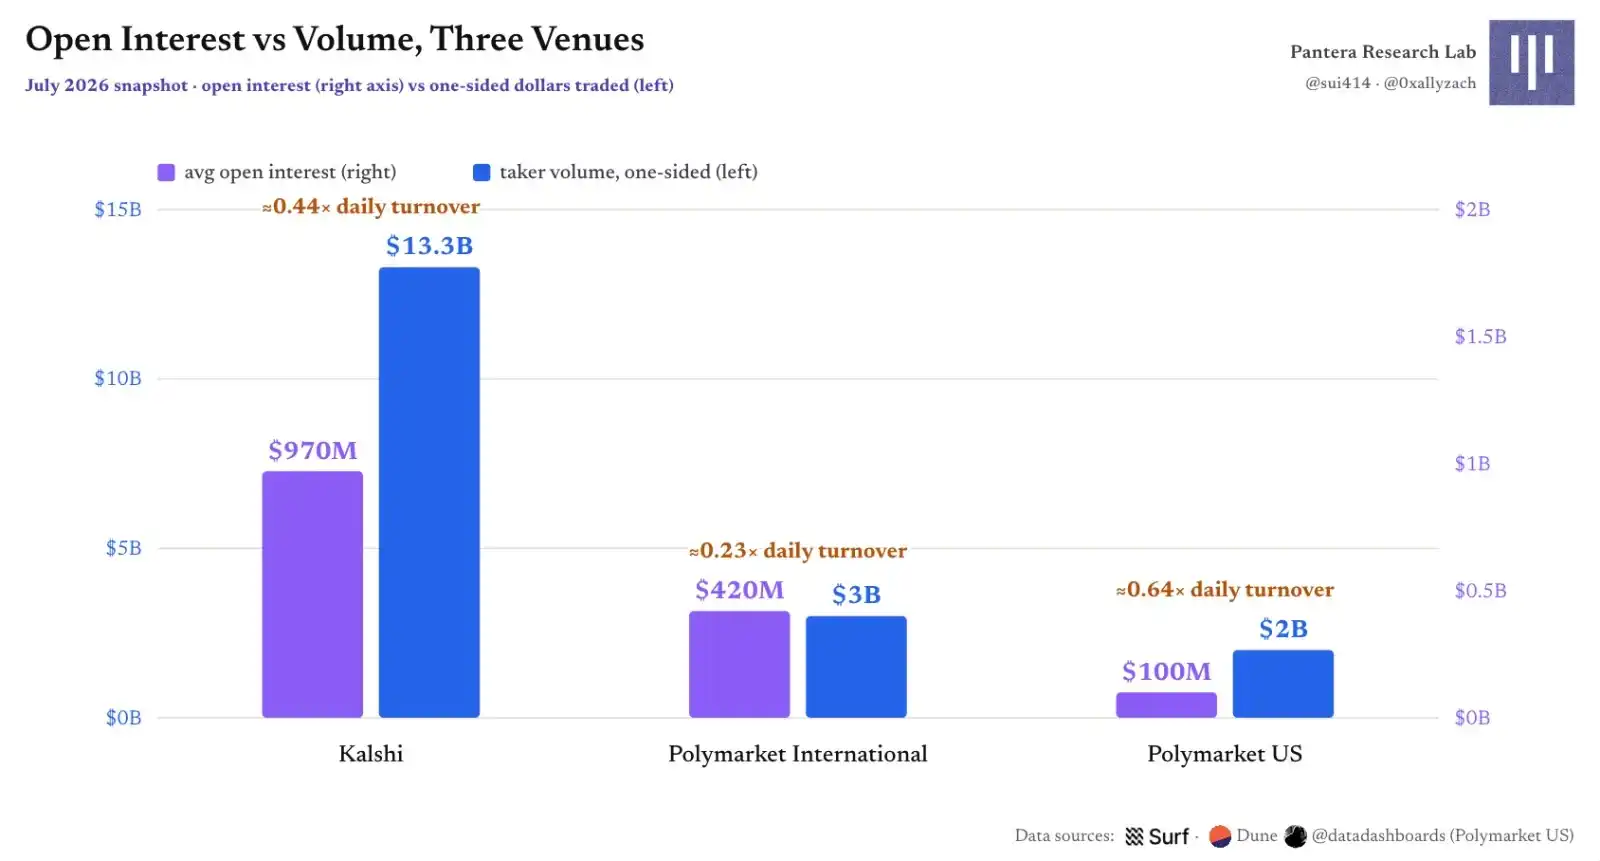
Figure 5 | Open Interest vs. Volume for Three Venues: Capital Scale ≠ Velocity
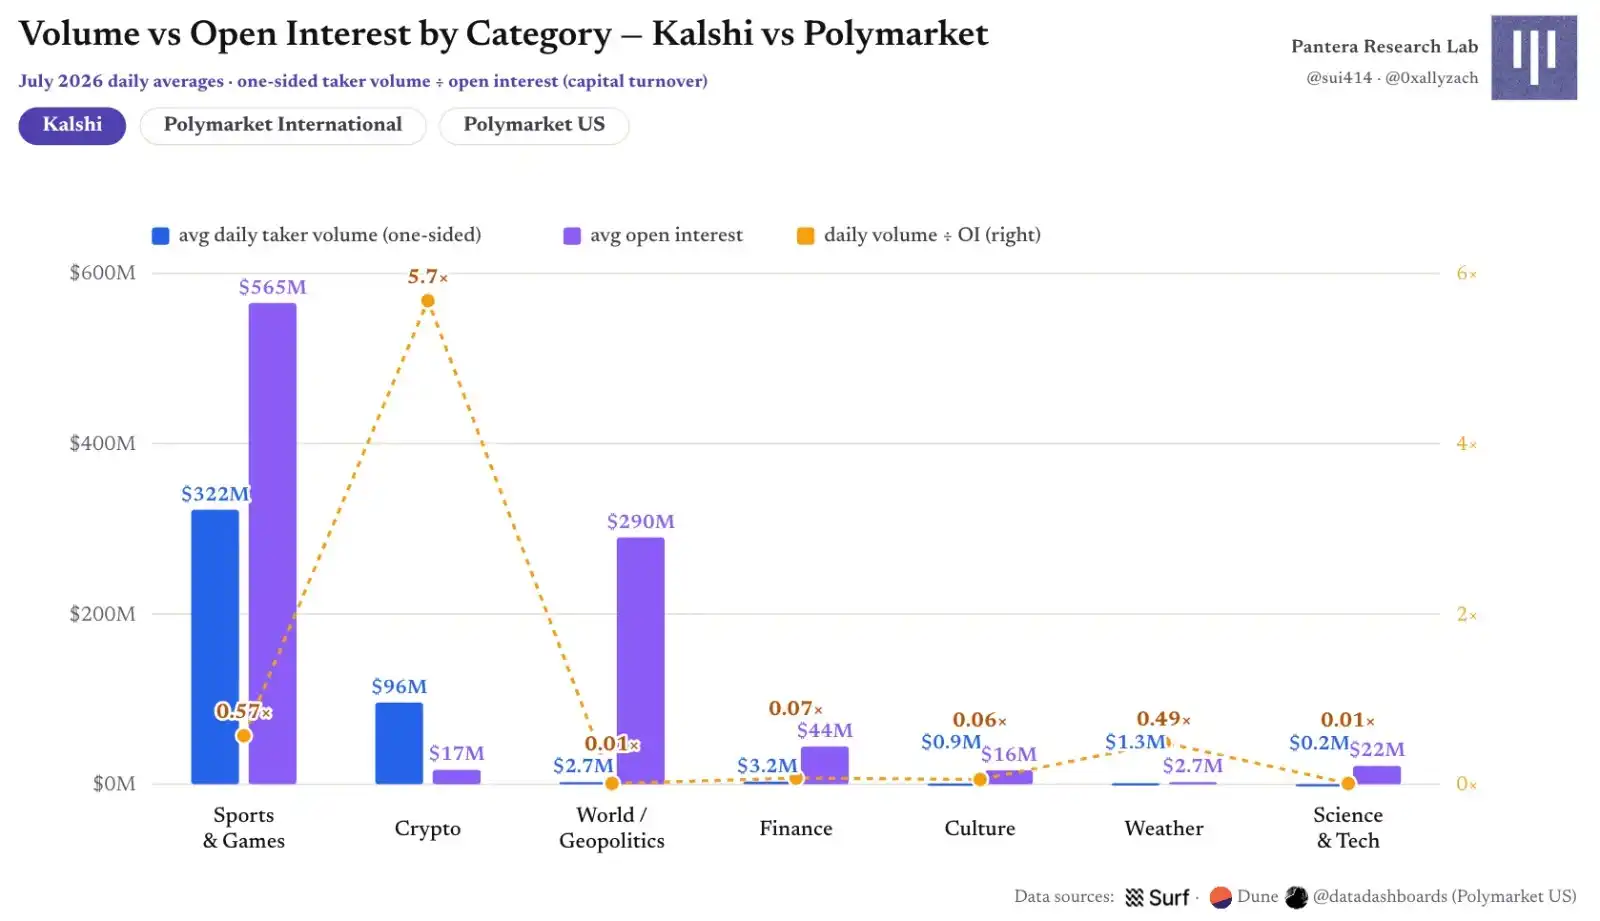
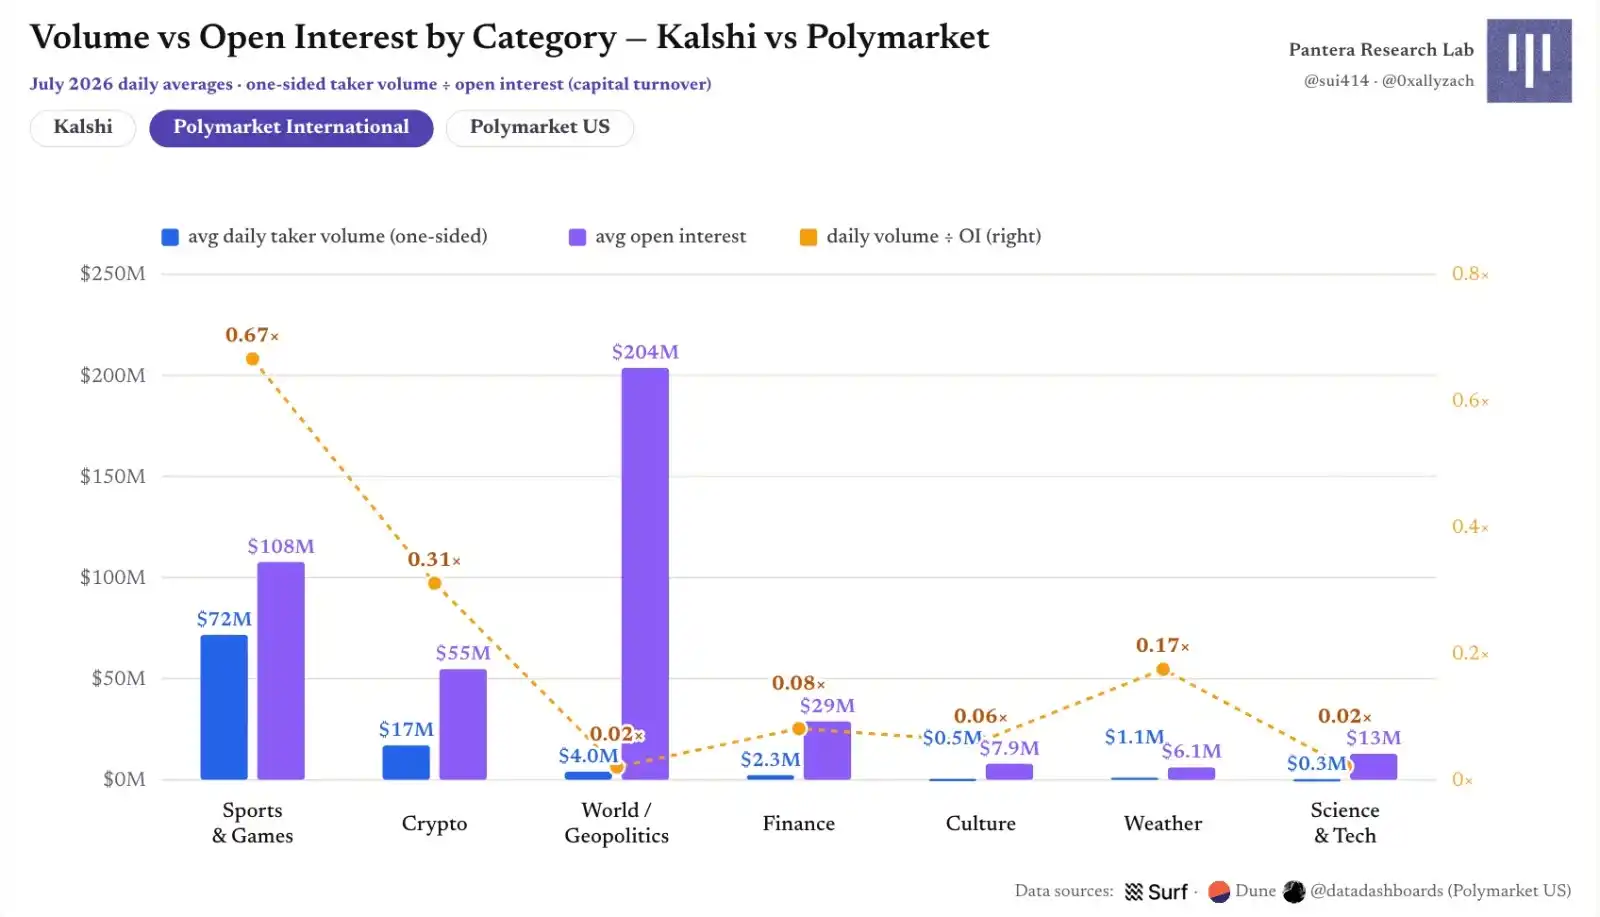
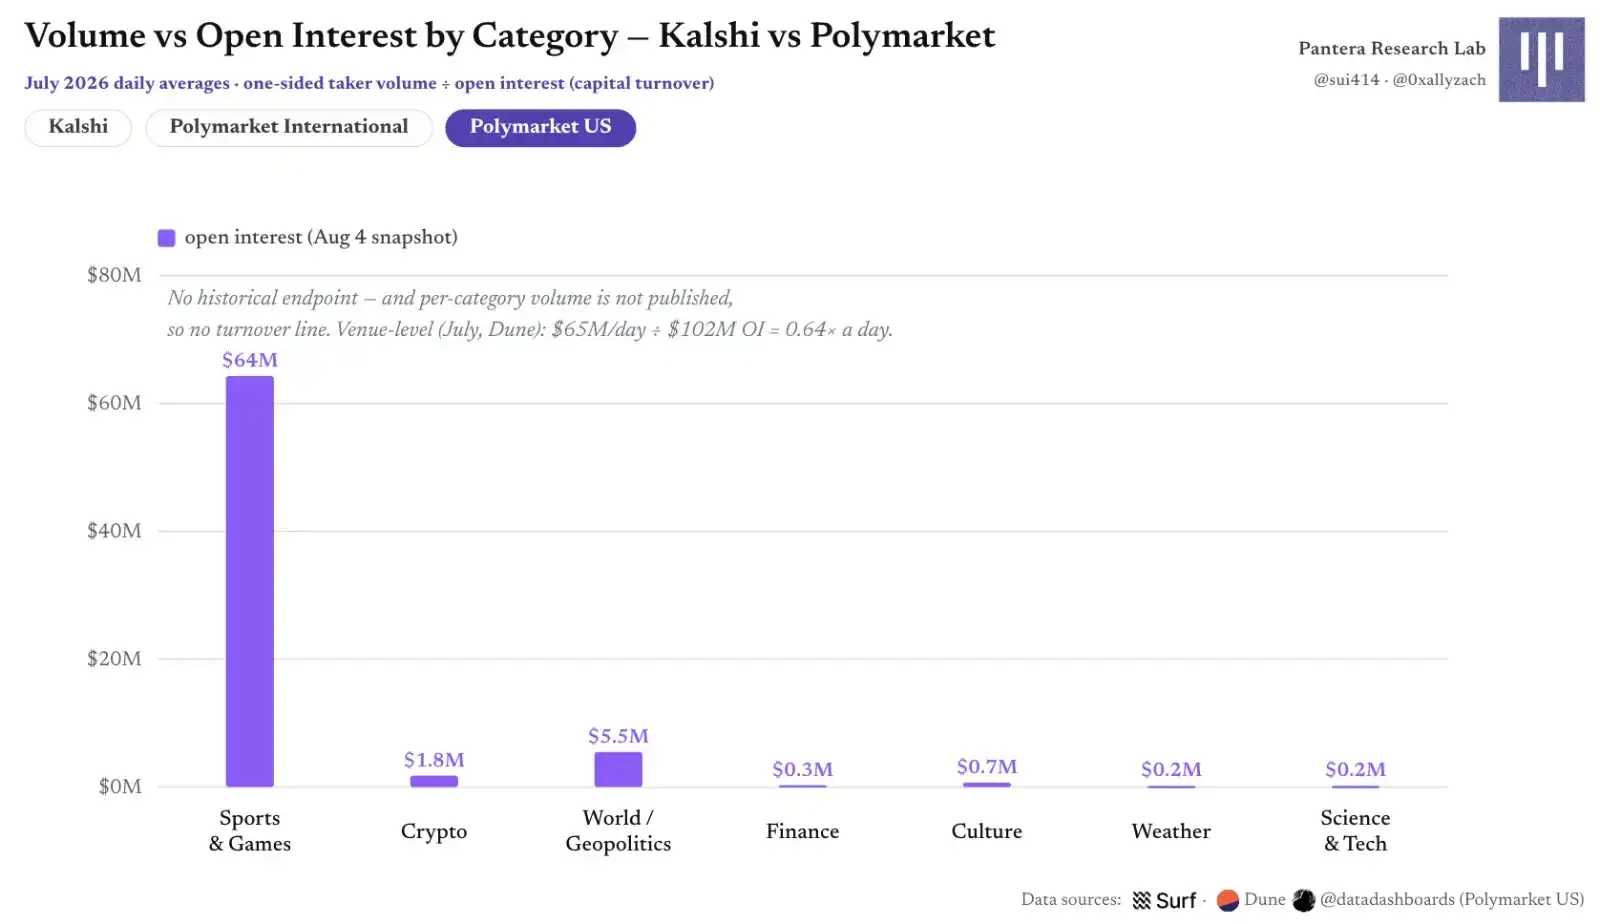
Figure 6 | Category-by-Category Comparison of Volume / Open Interest for Kalshi vs. Polymarket
Sports and crypto are the fastest-turning categories; world/geopolitics is the slowest, with daily turnover of only about 0.01–0.03x. Each of the two International markets has about $200–300 million of capital sitting idle, printing only $2–3 million in daily volume, hence the zero-fee setting for that category. About 88% of Polymarket US open interest is concentrated in sports, explaining its ability to achieve higher turnover with less capital.
Kalshi's crypto market is a clear outlier: about $17 million in open interest corresponds to about $96 million in daily volume, with daily turnover approaching 6x, 98% of which are markets with durations under one hour. Polymarket's crypto turnover appears to be only 0.31x because longer-duration threshold markets absorb most of the open interest, while five-minute up/down markets, accounting for about 90% of volume, lock almost no capital; each such market averages only about $2,800 in collateral.
The same category tends toward similar speeds across platforms: daily turnover for sports on Kalshi, Polymarket International, and Polymarket US is approximately 0.57x, 0.67x, and 0.64x, respectively. This appears more a category property than a platform property.
Part II: User Growth in Polymarket International
The following user analysis covers only the International market's Polygon CTF/NegRisk contracts, for the period January 1 to June 30, 2026. Polymarket US and Kalshi clear on internal ledgers with anonymized public trade flows, preventing comparable depth of wallet profiling.
Maker vs. Taker: The Two Sides of the Order Book Are Not the Same Crowd
In H1, 1,733,011 wallets traded on the International market. Nearly all wallets took liquidity at least once, but less than half ever placed a limit order. The maker side is clearly more professional and smaller; the top thousand makers provide most static liquidity. Demand is equally concentrated: about 6% of high-activity wallets execute 80% of taker volume, while one-third of wallets trade five times or fewer over six months.
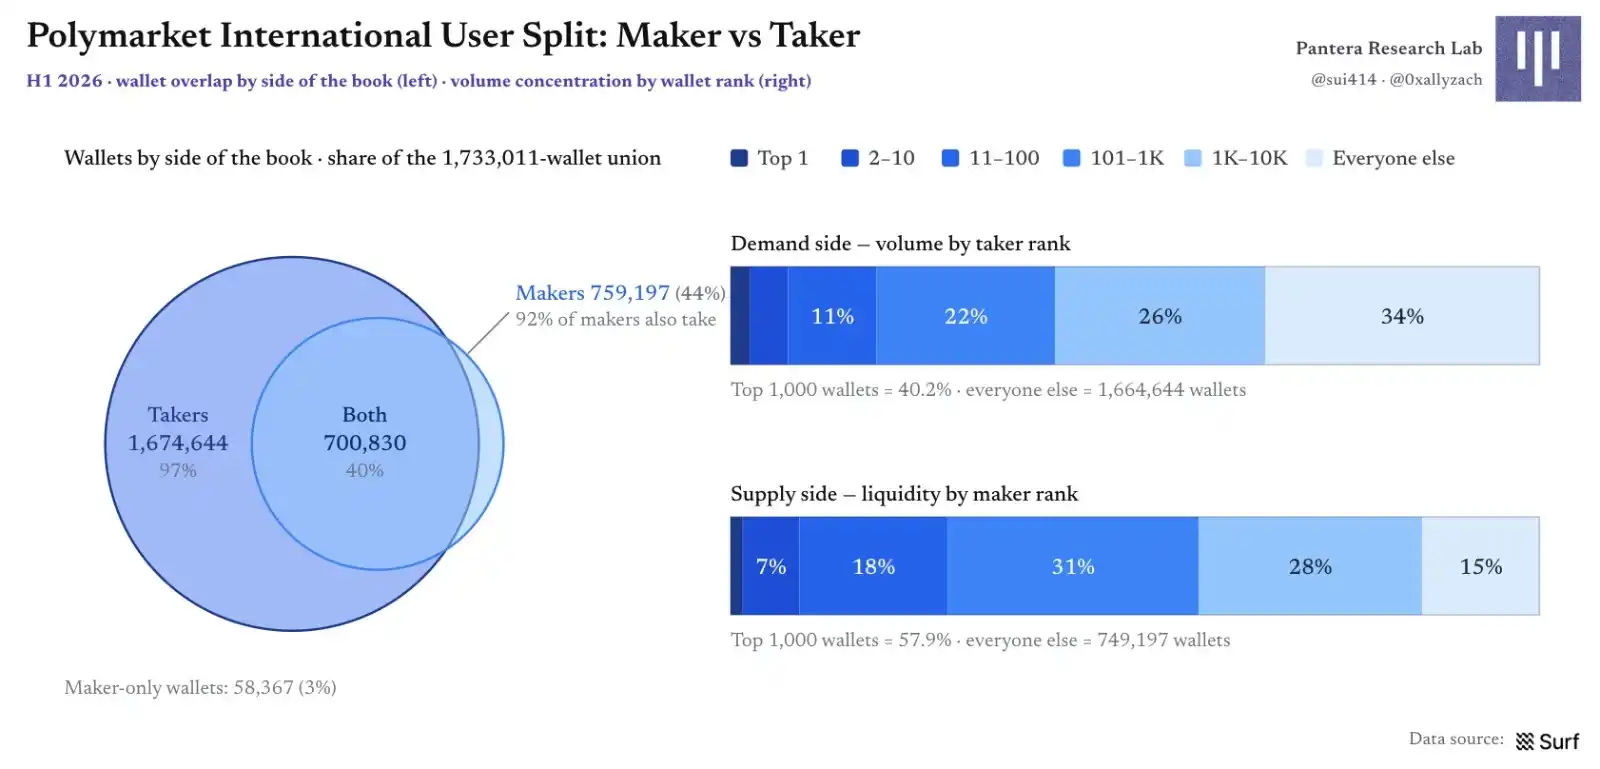
Figure 7 | Polymarket International Wallet Structure: Maker vs. Taker Overlap and Concentration
User Growth Accounting: Activity Has Plateaued
User growth looks less optimistic than volume: monthly active wallets plateaued from 580k in January to 594k in June, despite approximately 1.1 million wallets making their first trade during that period. Each month, 43%–49% of last month's active wallets stop trading; April churn reached 358k, forcing the platform to continuously refill the funnel with new and returning wallets.
Three important caveats apply here. Wallets are not users; some "churn" may simply be users switching to new wallets; and this article's churn only indicates a wallet stopping trading, not account closure or absence of funds.
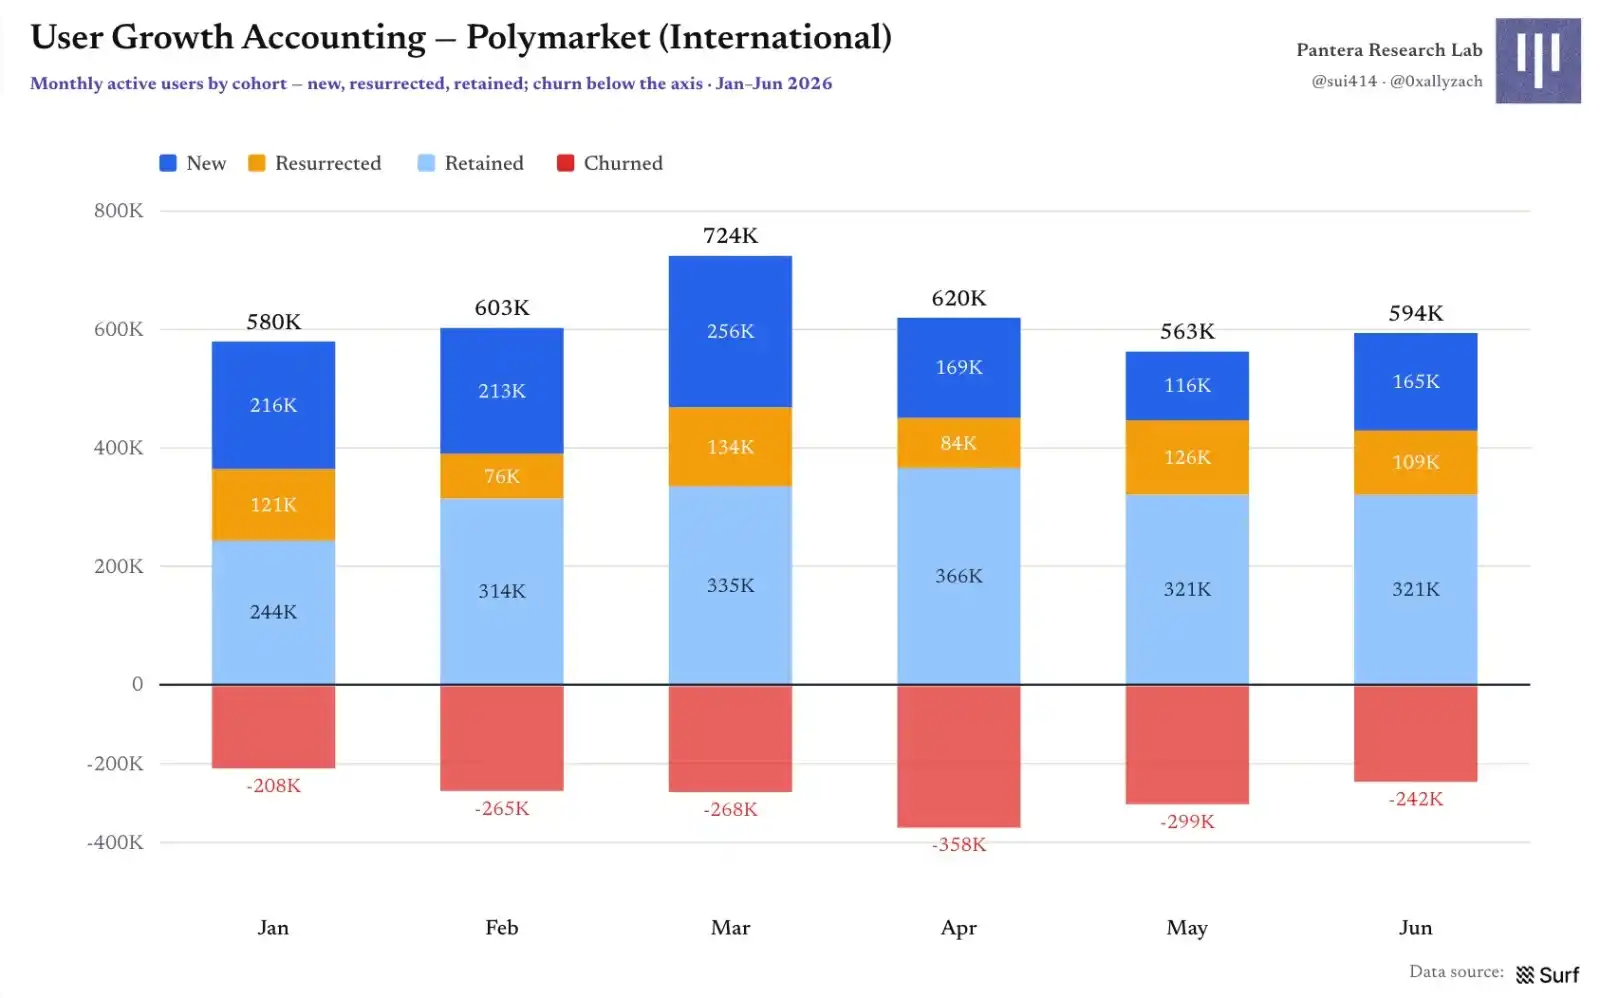
Figure 8 | User Growth Accounting: New, Returning, Retained, and Churned Users
Where Do New Users Come From: Not a Single Blockbuster Event
Attributing each new wallet to the market it first engaged with reveals the seasonality of the acquisition machine: crypto markets peaked at about 99k new wallets in March, geopolitics at about 68k in January, and sports at about 91k in June with the World Cup kickoff. Events create peaks, but no single market carries the entire acquisition burden.
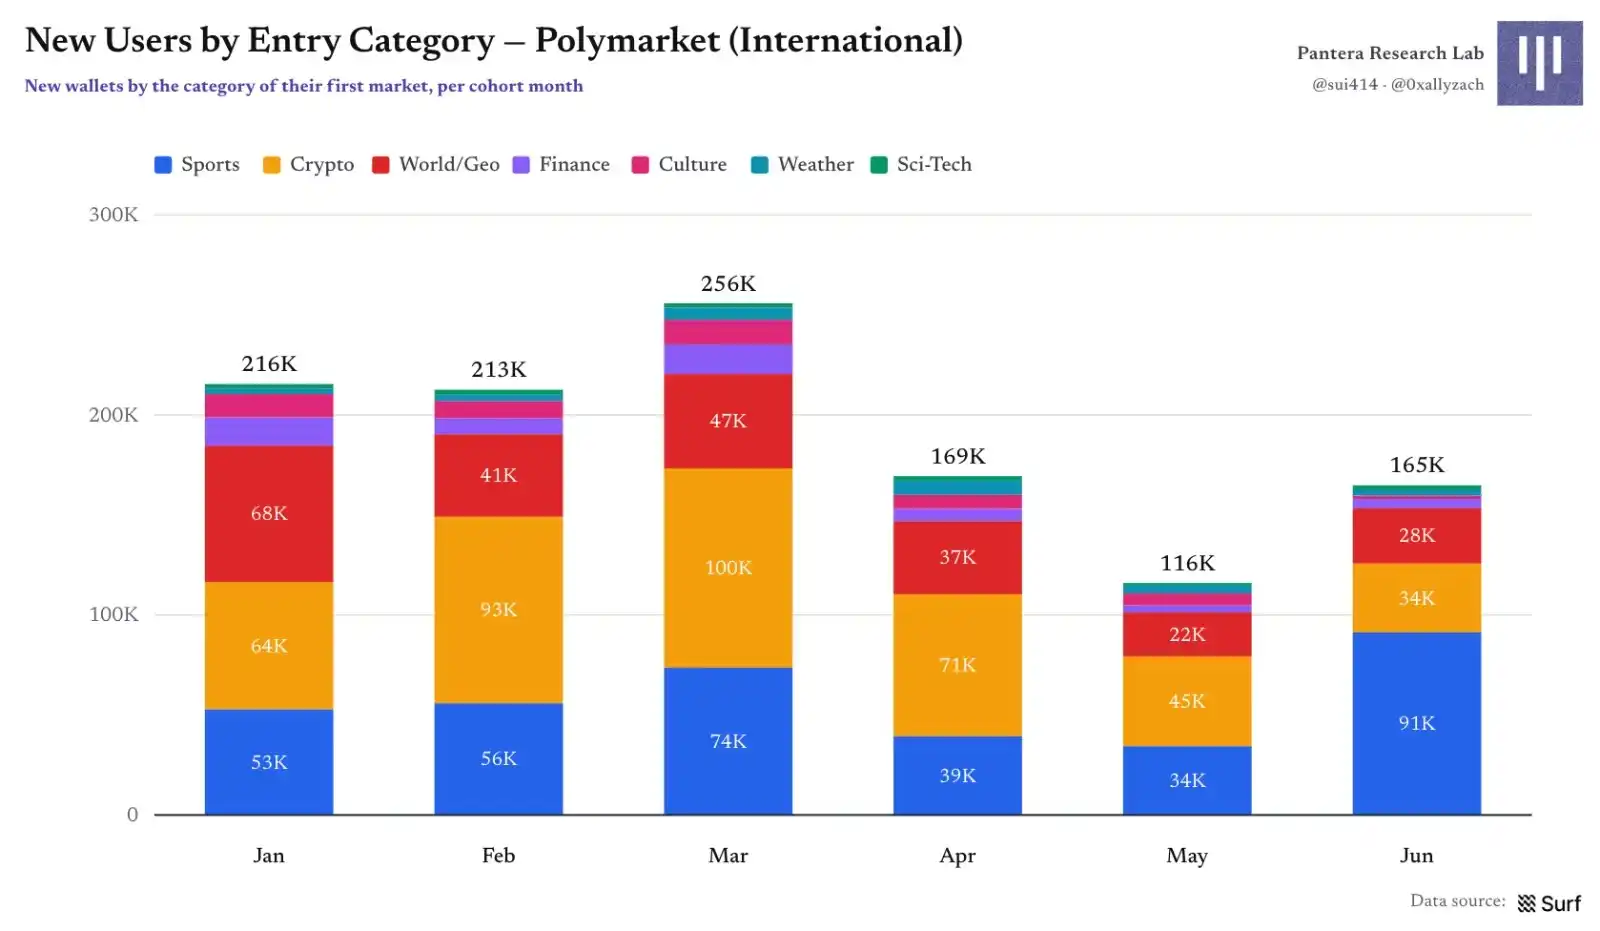
Figure 9 | New Wallets by First Entry Category
The strongest single onboarding market in H1 was "Will China invade Taiwan by end of 2026?", but it brought in only about 7,000 new wallets. The top ten list includes geopolitics, World Cup, interest rates, and cultural events, suggesting effective acquisition comes from a portfolio of markets, not a single blockbuster.
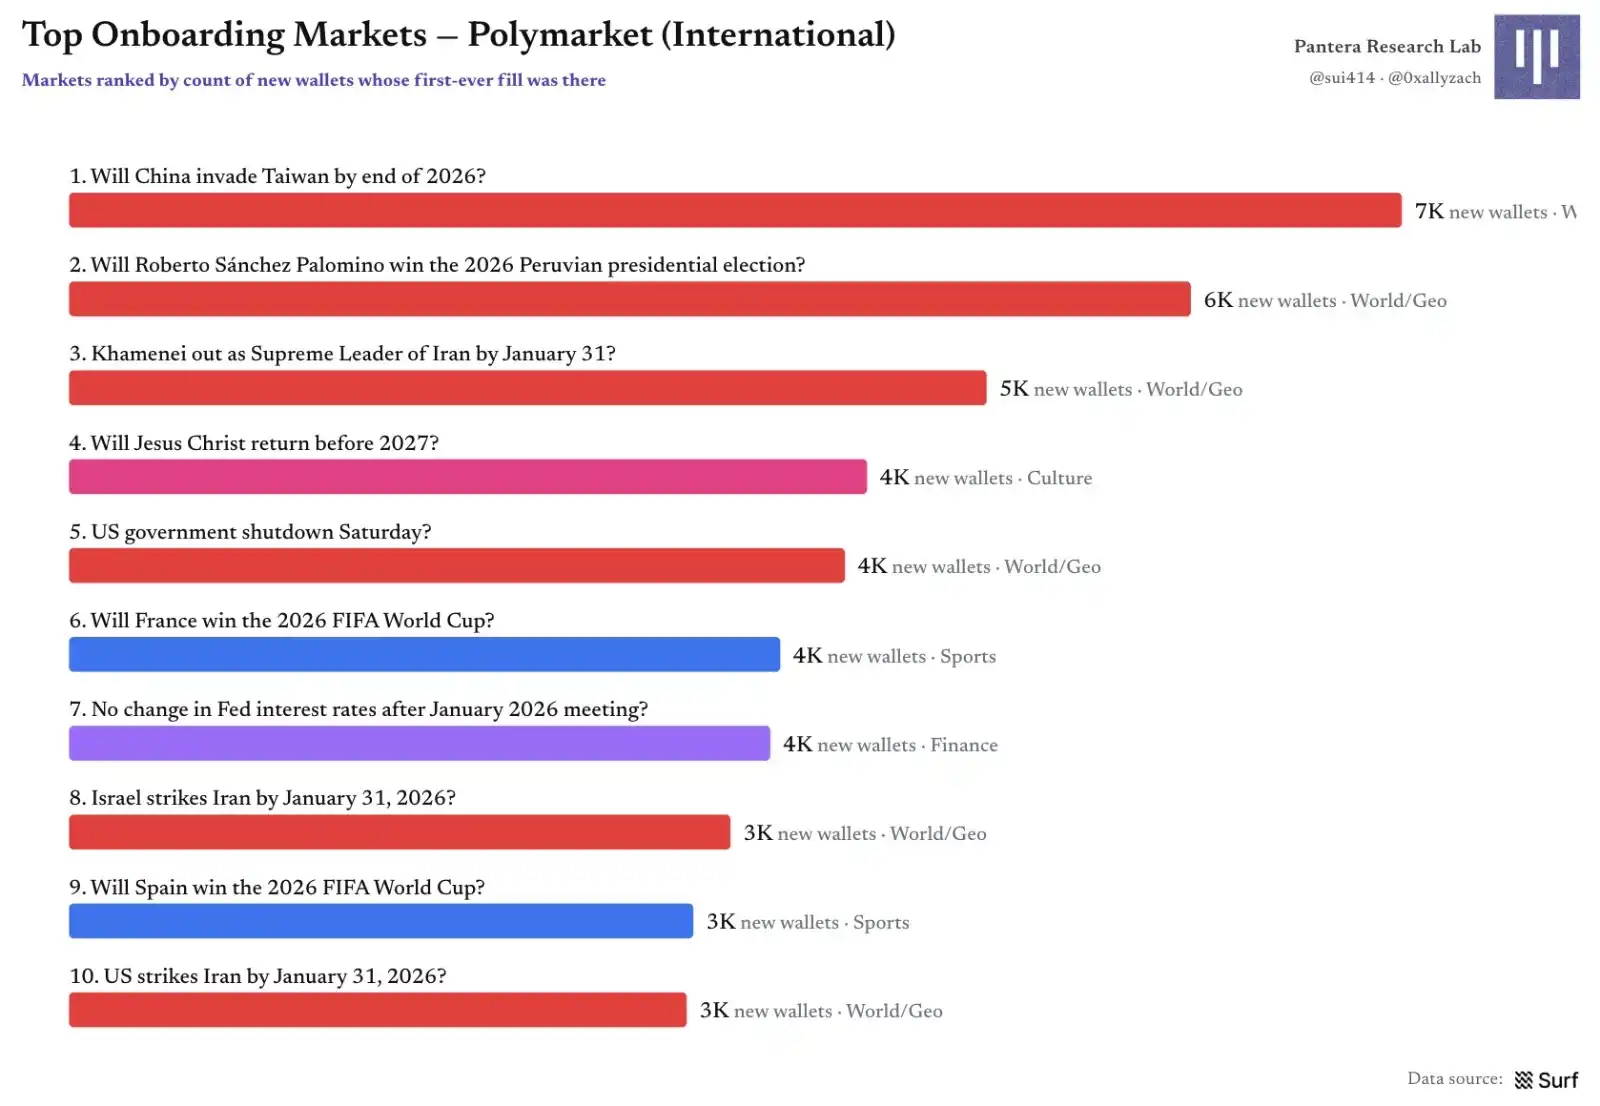
Figure 10 | Top 10 Onboarding Markets by New Wallets in H1
On a monthly basis, the top 15 onboarding markets accounted for only 8%–19% of new wallets that month, with the top market never exceeding about 3%. Concentration was highest in January and June, corresponding to Iran news, the Taiwan market, and the World Cup.
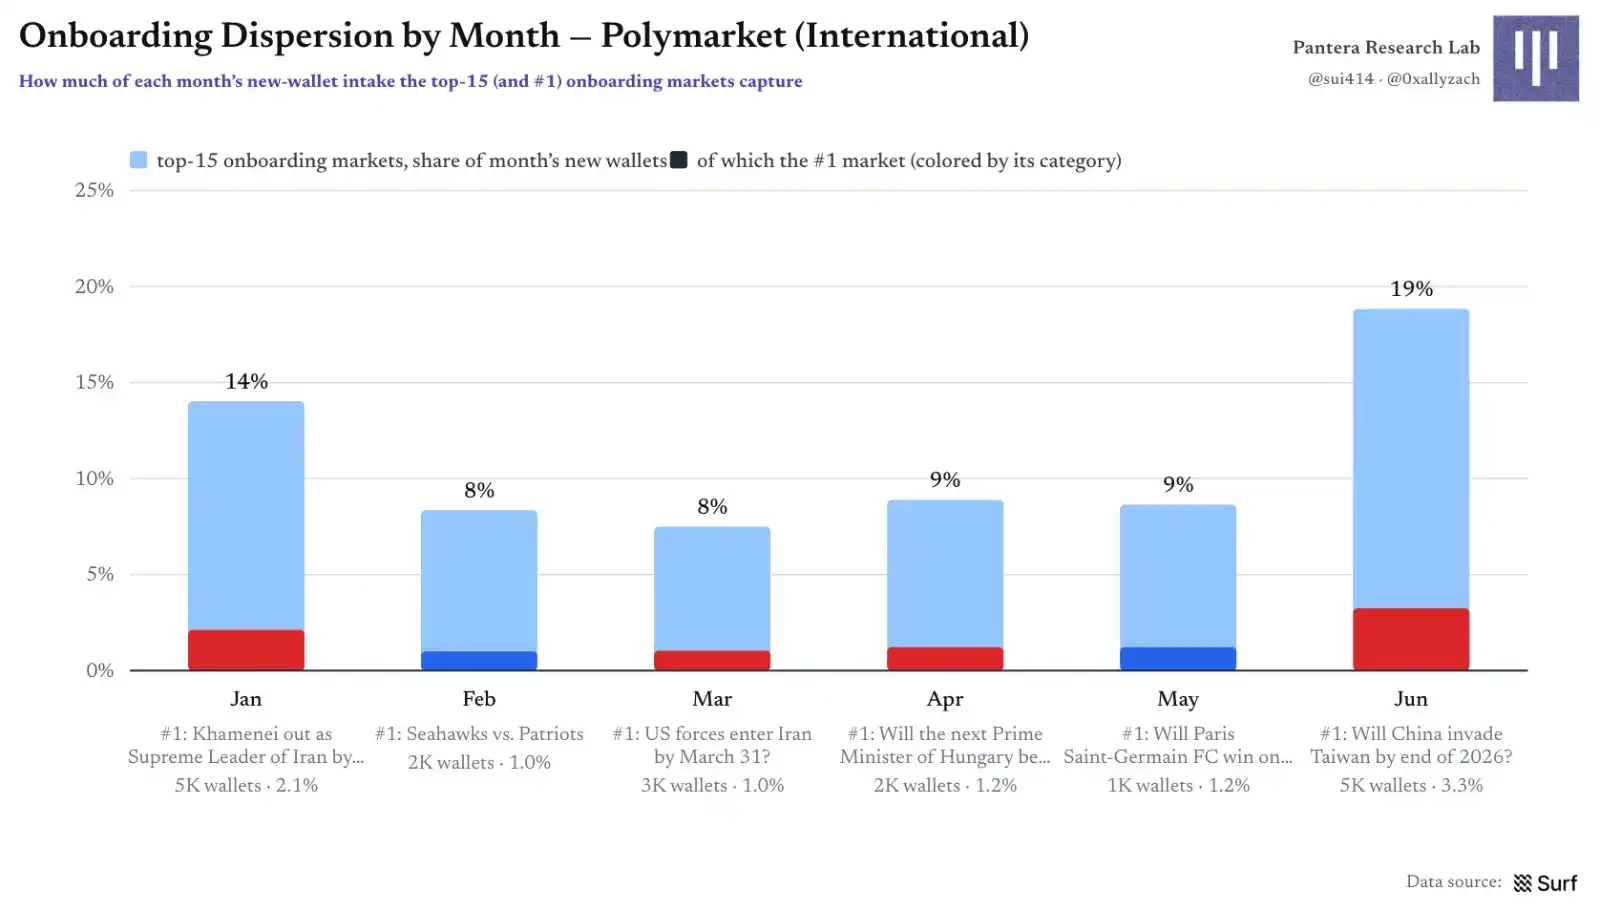
Figure 11 | Monthly Acquisition Dispersion: Contribution of Top 15 Markets vs. Top Market
Retention: Users Stay on the Platform, Not Necessarily in the Original Category
About half of monthly active wallets return the following month, with platform monthly retention around 51%–57%; but loyalty to a specific category is noticeably weaker. Users may leave their initial entry category but reappear in another, suggesting cross-category recommendations and upselling may be at work.
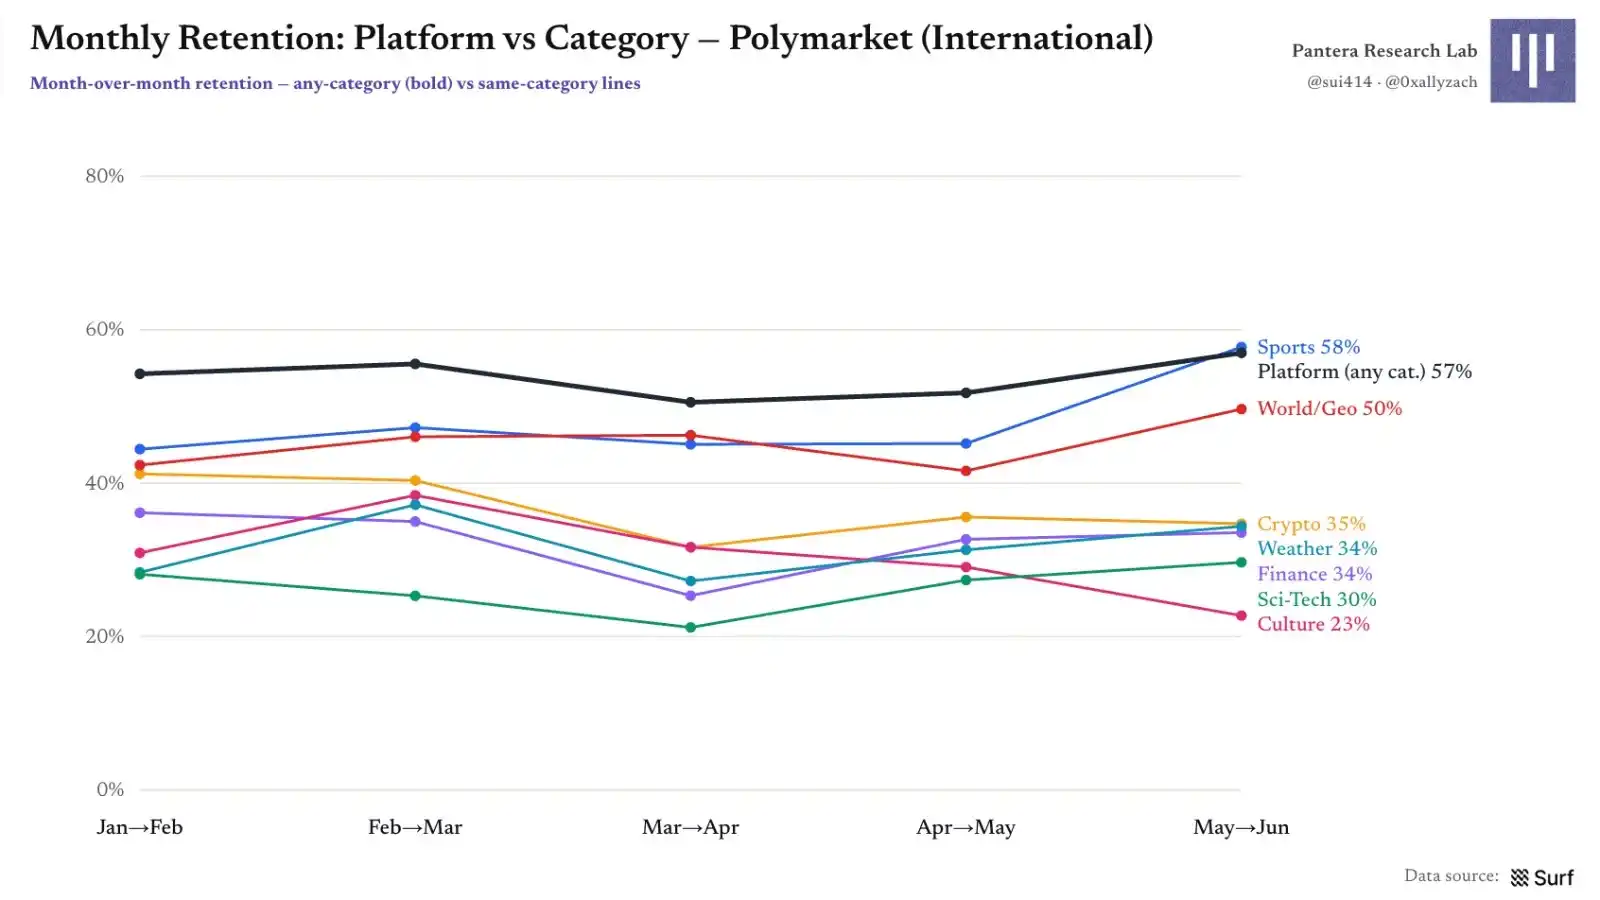
Figure 12 | Platform Retention vs. Category Retention Comparison
One-month retention across entry categories is highly clustered at 44%–49%, with three-month retention around 25%–32%. The only clear low point is crypto entry, with one-month retention about 37%, roughly 30% lower than other categories; one possible explanation is that automated operations in crypto trading more frequently rotate new wallets, artificially depressing surface-level retention.
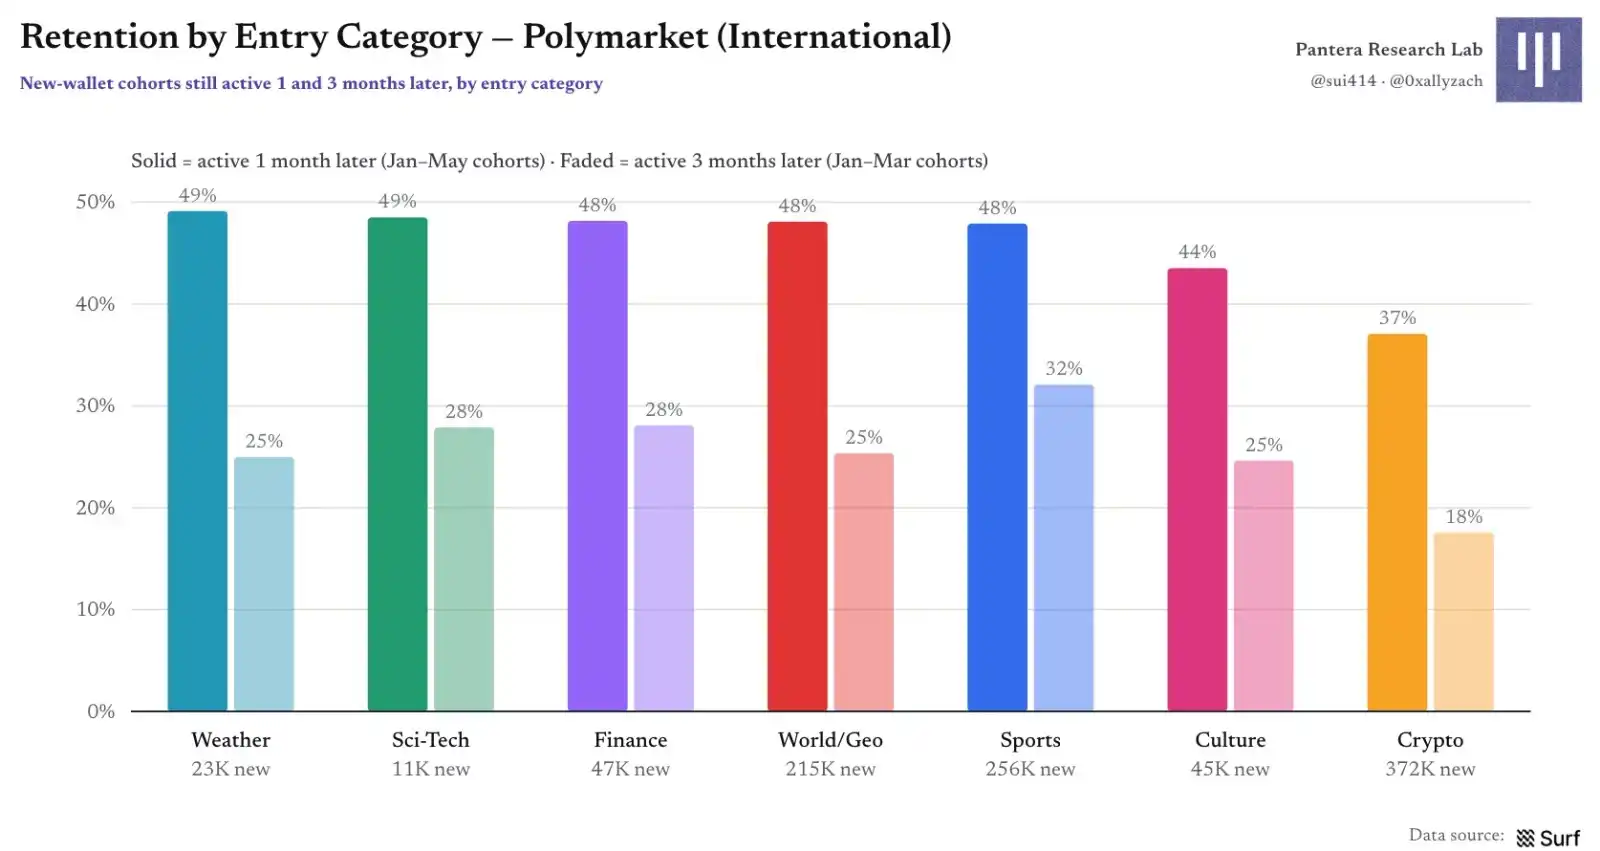
Figure 13 | New Wallet Retention by Entry Category
User Market Category Participation Matrix: Geopolitics as the Connective Layer
The matrix diagonal shows the number of unique wallets per category; off-diagonal percentages show the proportion of wallets in the smaller category that also trade in another category. While Sports and Crypto are the two largest user groups, their overlap is only 49%, representing two substantively different audiences. World/Geopolitics overlaps more highly with other categories (except Weather), acting like a core product layer that connects diverse interests on the platform.
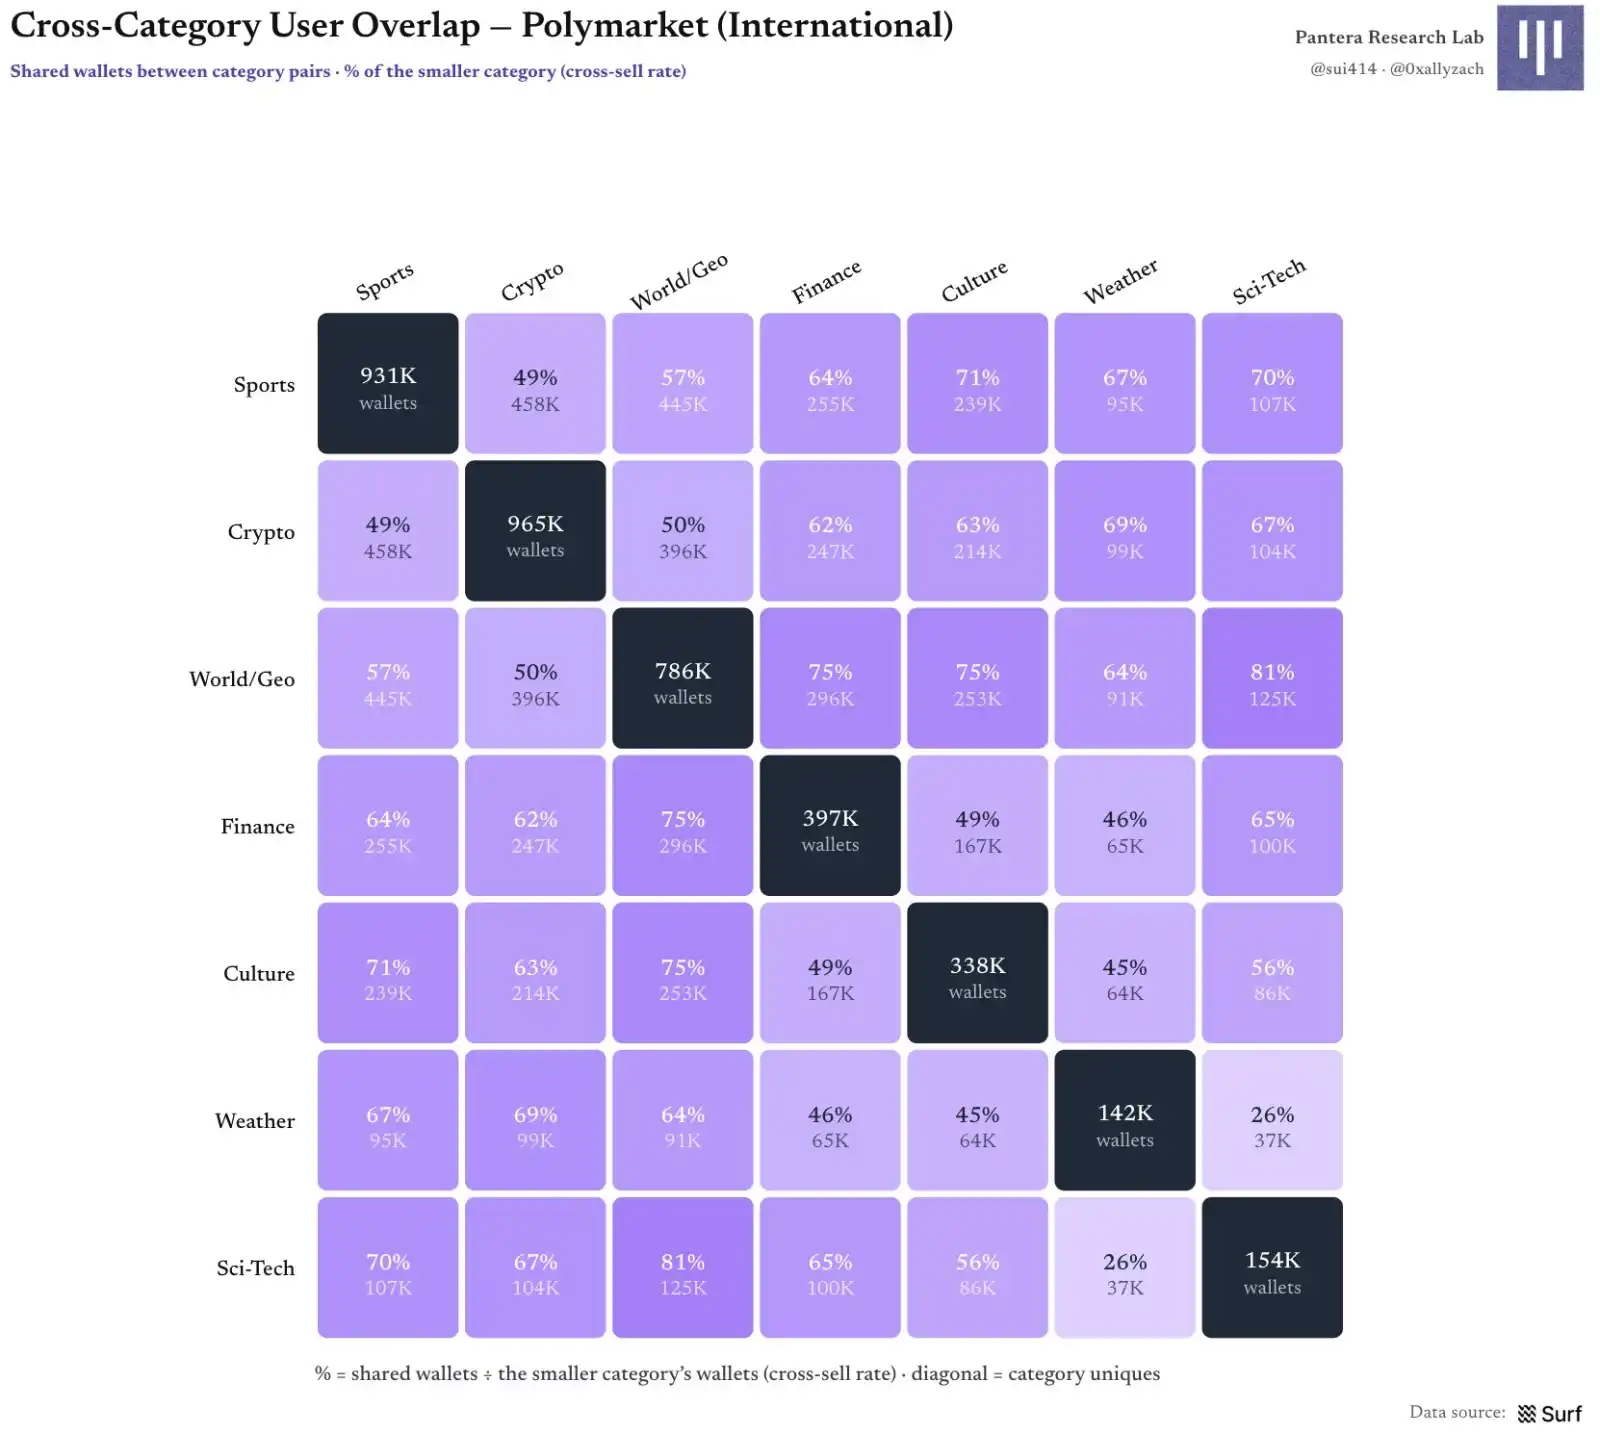
Figure 14 | Cross-Category User Overlap and Upsell Rates
User Category Loyalty × Diffusion Plot: Different Entry Points Buy Different Quality Users
Plotting entry retention against cross-category expansion, the six categories cluster in the 43%–49% loyalty range but differ in expansion capability: Sports resembles stable users staying in their home turf, while Science & Tech attracts users who explore an average of 3.6 other categories. Crypto sits in the bottom-left corner: one-month retention ~37%, with the lowest expansion. The five-minute casino brings volume, not long-term retention or cross-category exploration.
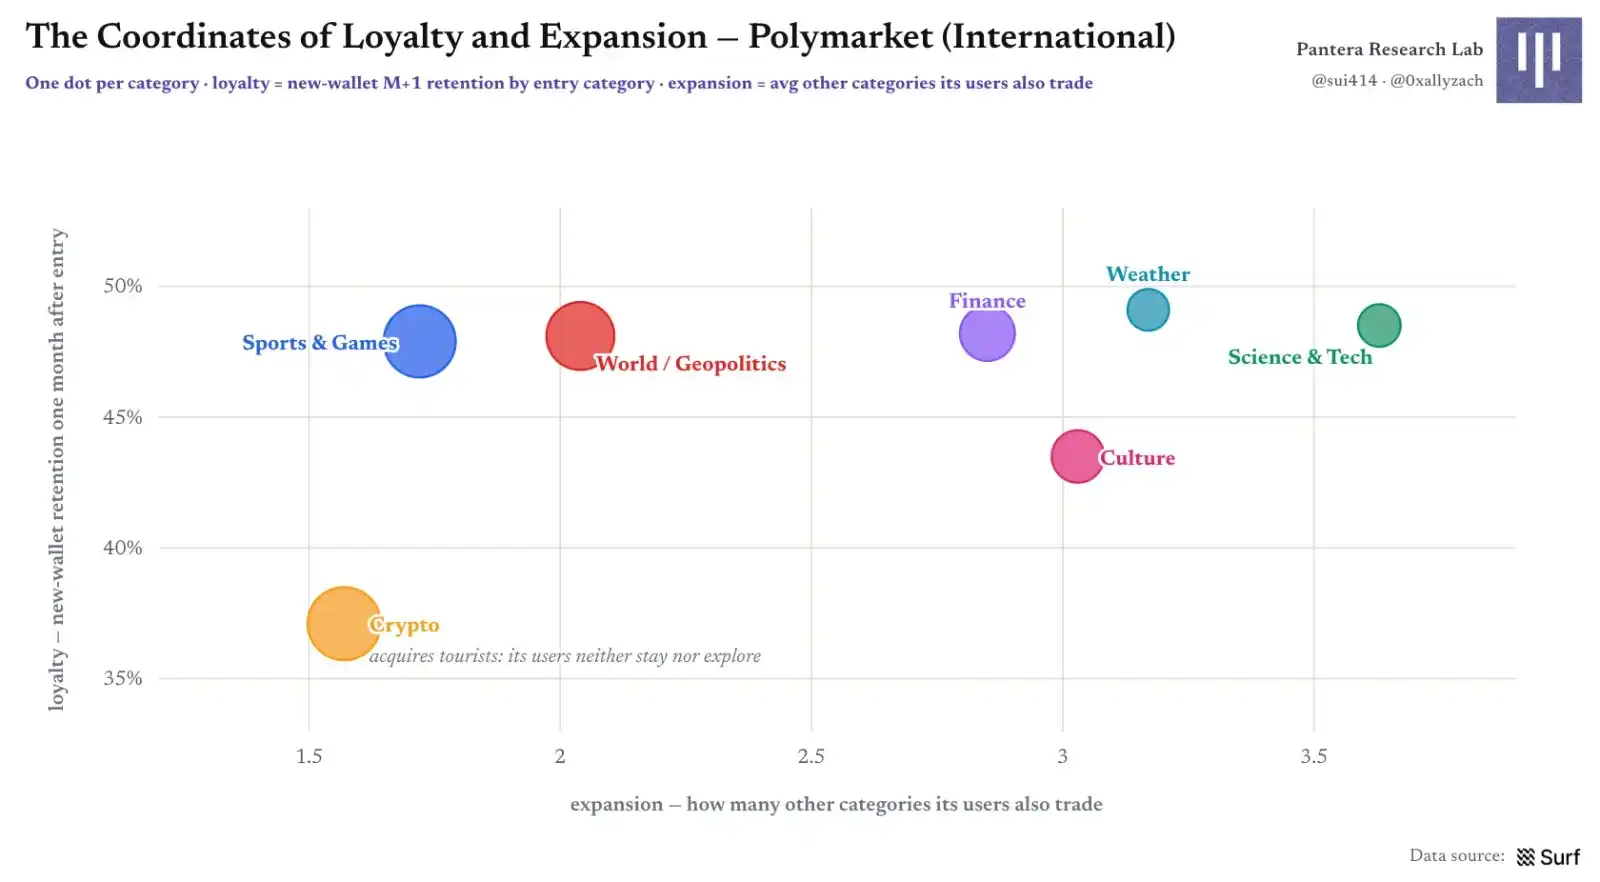
Figure 15 | Categories Plotted on "Loyalty × Expansion" Coordinates
Part III: Market Microstructure: User Profiles, Entry Timing, and Profitability
User Profile Distribution: Market Category Breadth, Frequency, and Trade Size Are Interlinked
We profile users along three dimensions: number of categories covered, typical trade size, and trading frequency. Broader category coverage correlates with higher average wallet volume; wallets covering all seven categories represent only about 1% of users but average about $59k in H1 taker volume, seven times the $8.3k for purely single-category wallets.
The frequency dimension shows a classic 80/20 pattern: about 6% of "high-frequency users" contribute 79% of volume, while one-trade tourist-type wallets constitute about 8% of the user base.
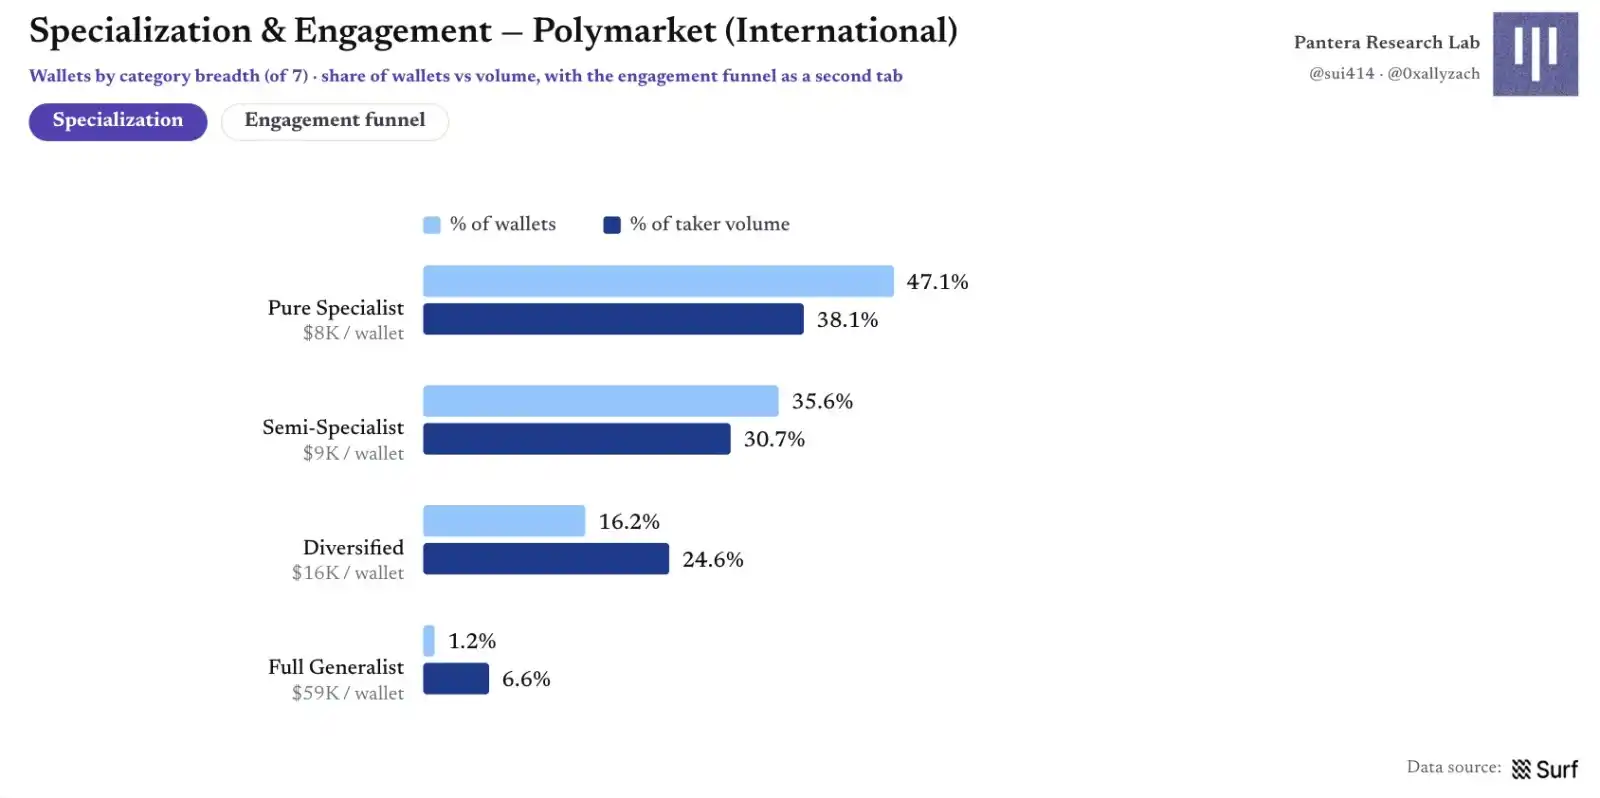
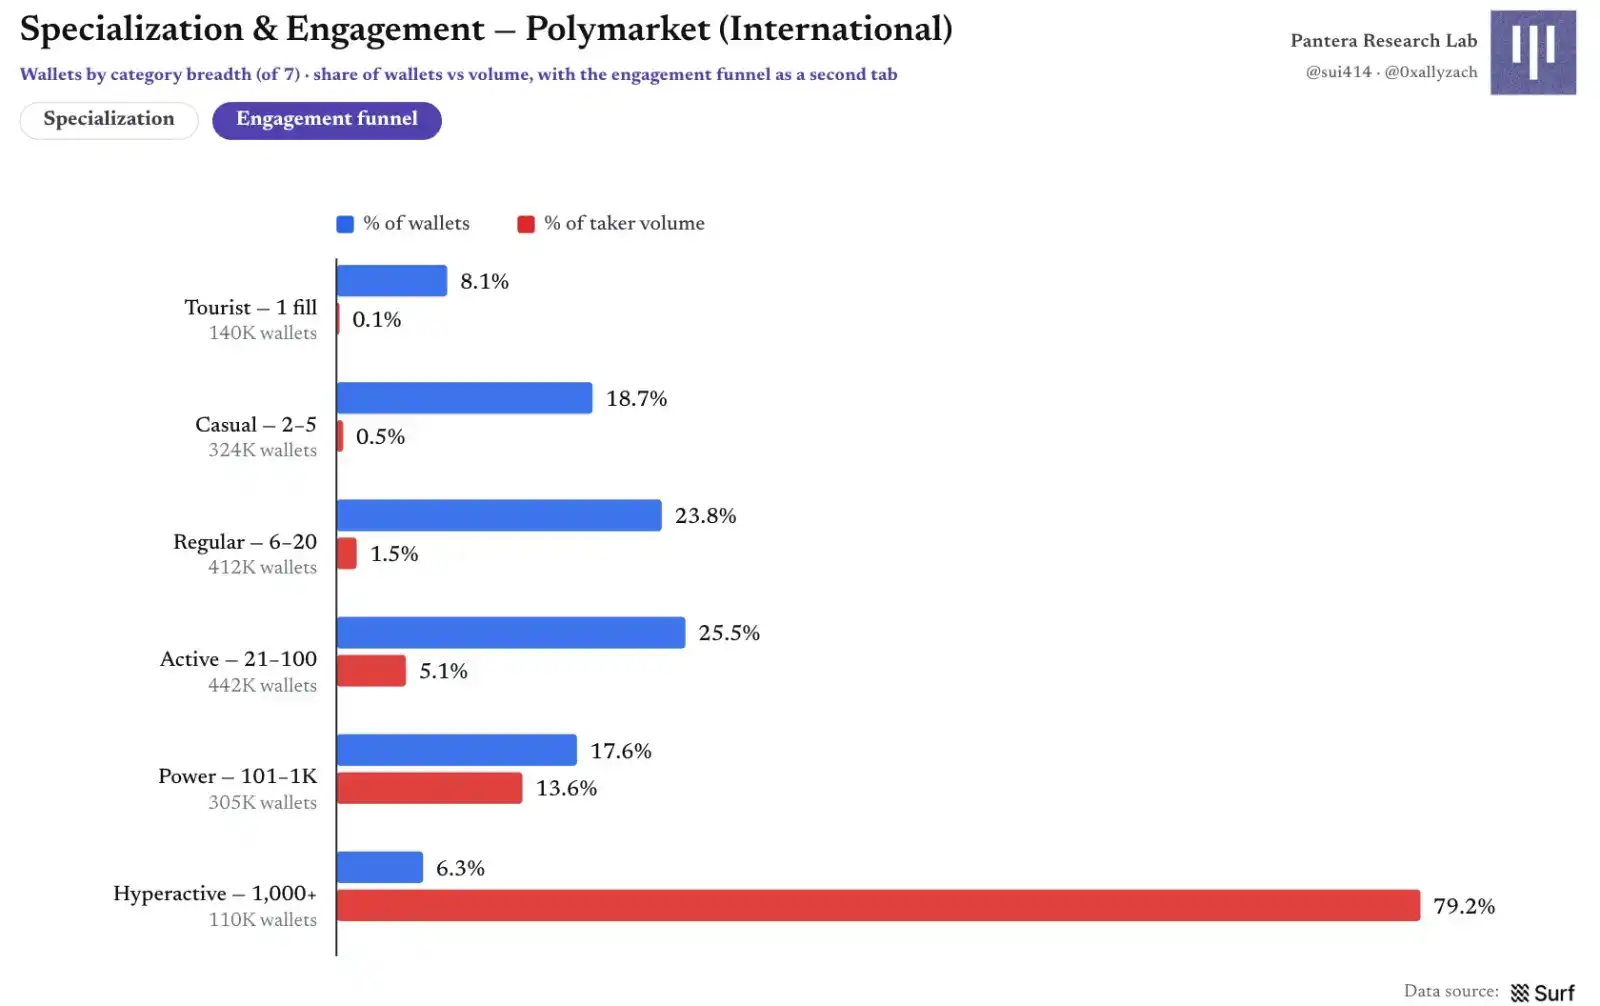
Figure 16 | Specialization and Engagement: Category Breadth, Wallet Share, and Volume
In most categories, the wallet-market relationship is dominated by one or two trades; Sports has the highest share of one-trade relationships at 46%. World/Geopolitics is the opposite, with only 20% of relationships being one-trade, indicating users return to the same market as news unfolds.
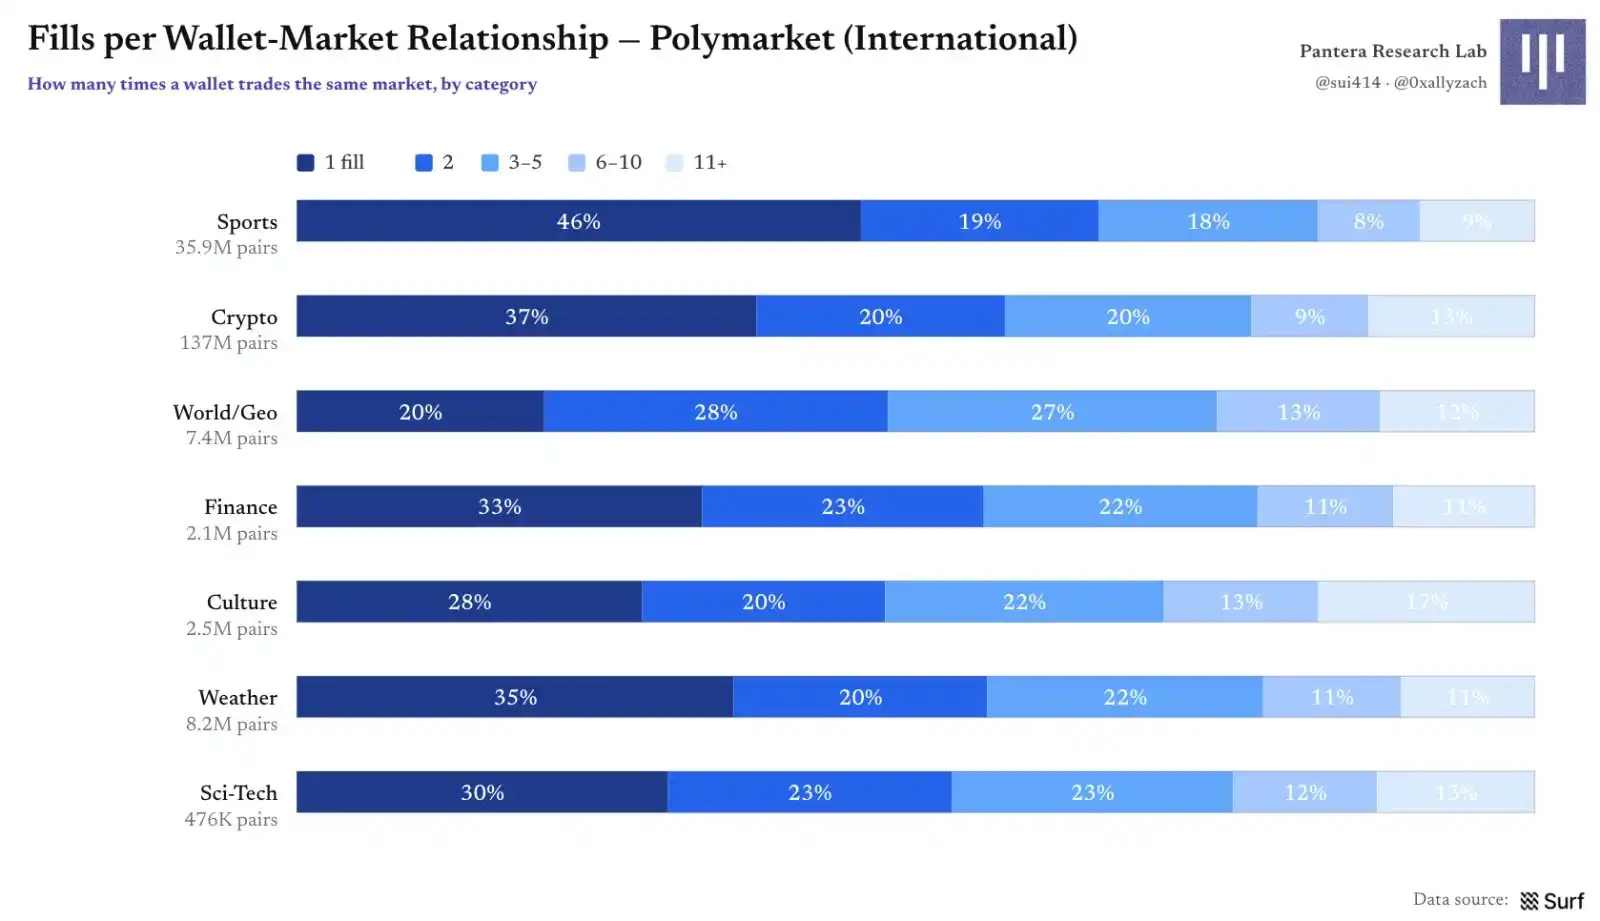
Figure 17 | Number of Trades per Wallet-Market Relationship
Three Types of Participants: Bots, Professional Users, and Retail Users
We use heuristic classification based on behavioral signals like trading frequency, consistency of order amounts, coverage breadth, and average ticket size. Classification is not a definitive judgment of real identity, and thresholds affect distributions; it is better suited to answering "who trades in what manner" rather than "who exactly is who."
Bot-like wallets constitute about 5.9% of users but execute about two-thirds of volume: approximately 102k wallets contribute $11.9B in volume and 89% of trade events; approximately 1.54 million retail wallets contribute $4.1B. Professional/informed users constitute about 5%, contributing 6.6% of taker volume, consistent with their role as liquidity providers rather than aggressive takers.
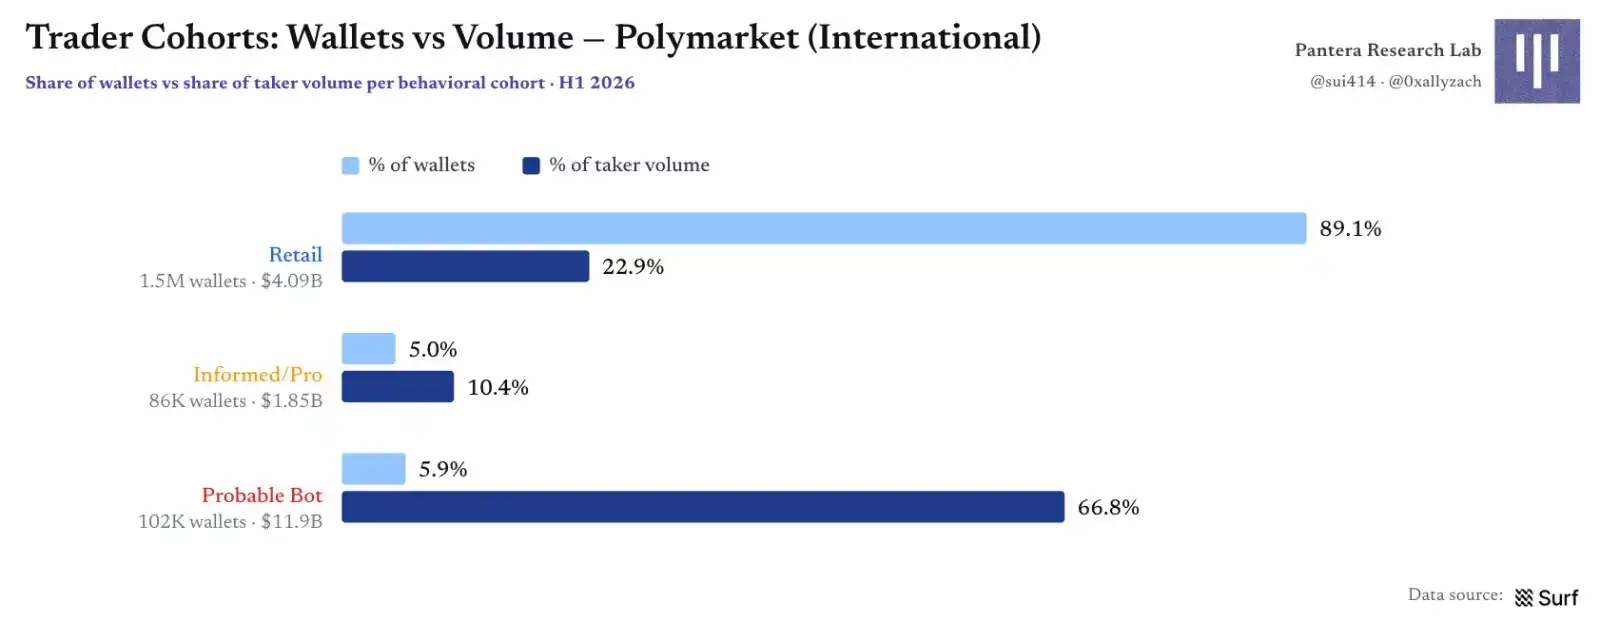
Figure 18 | Trader Groups: Misalignment Between Wallet Count and Volume
By category, bots almost completely dominate the two largest markets, Crypto and Sports, capturing about 80% and 72% of volume respectively; in middle-ground domains where human judgment still influences prices more—Geopolitics, Finance, Culture—the three groups' shares are more balanced.
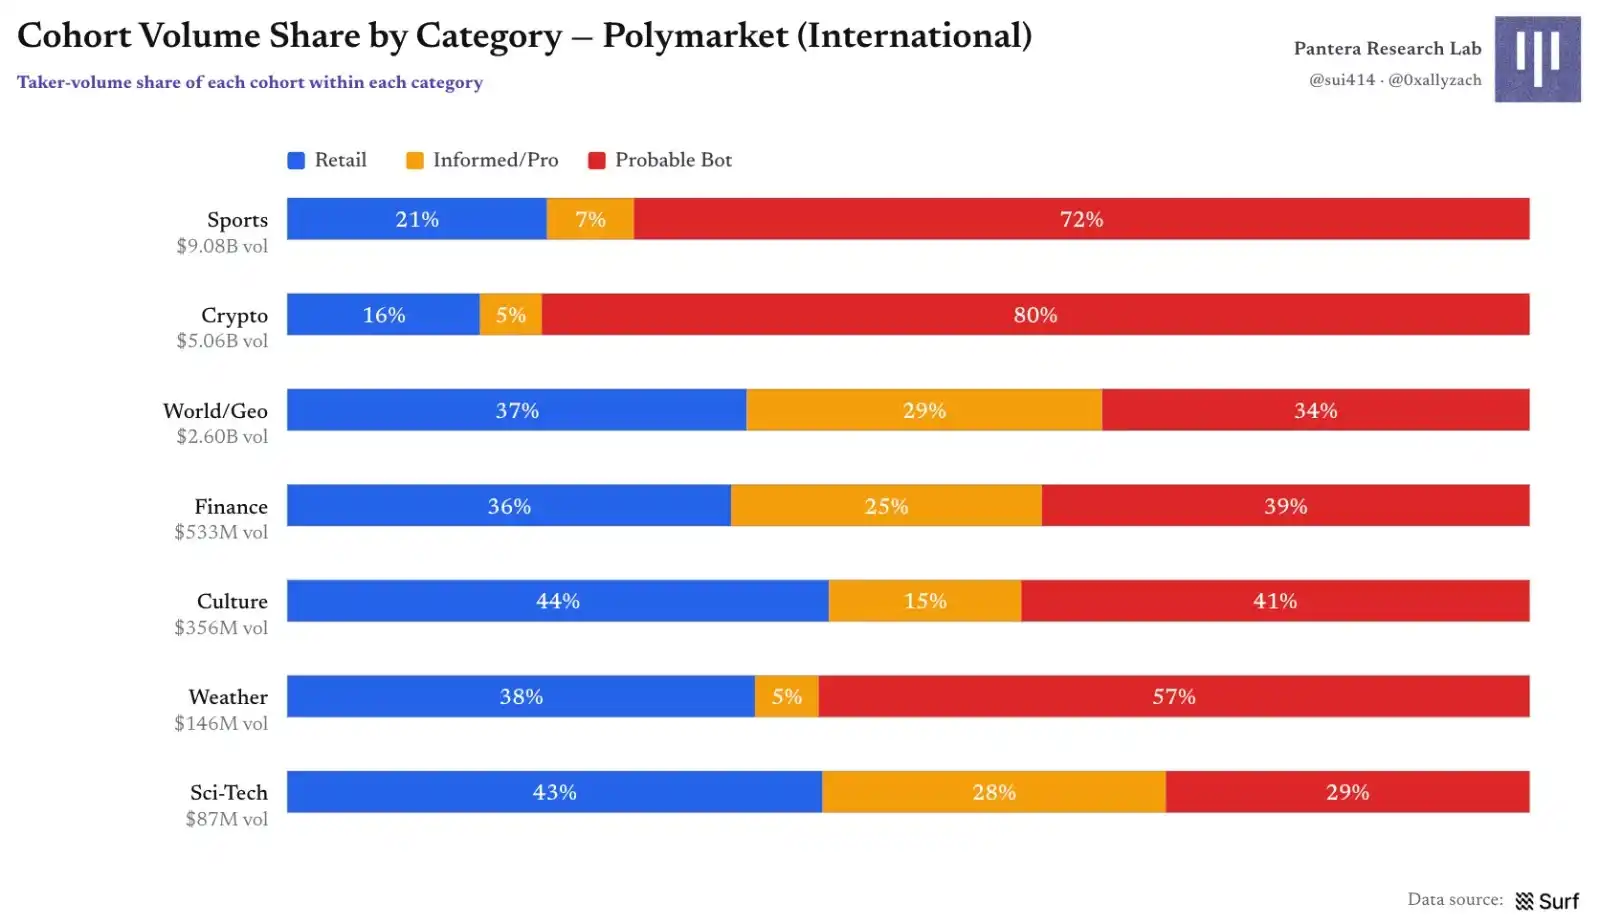
Figure 19 | Group Volume Share by Category
However, volume dominance comes from a thin bot layer. By wallet count, each category is still overwhelmingly dominated by retail users; Crypto and Weather markets show significantly higher bot proportions, with about 5% of their population replaced by automated behavior.
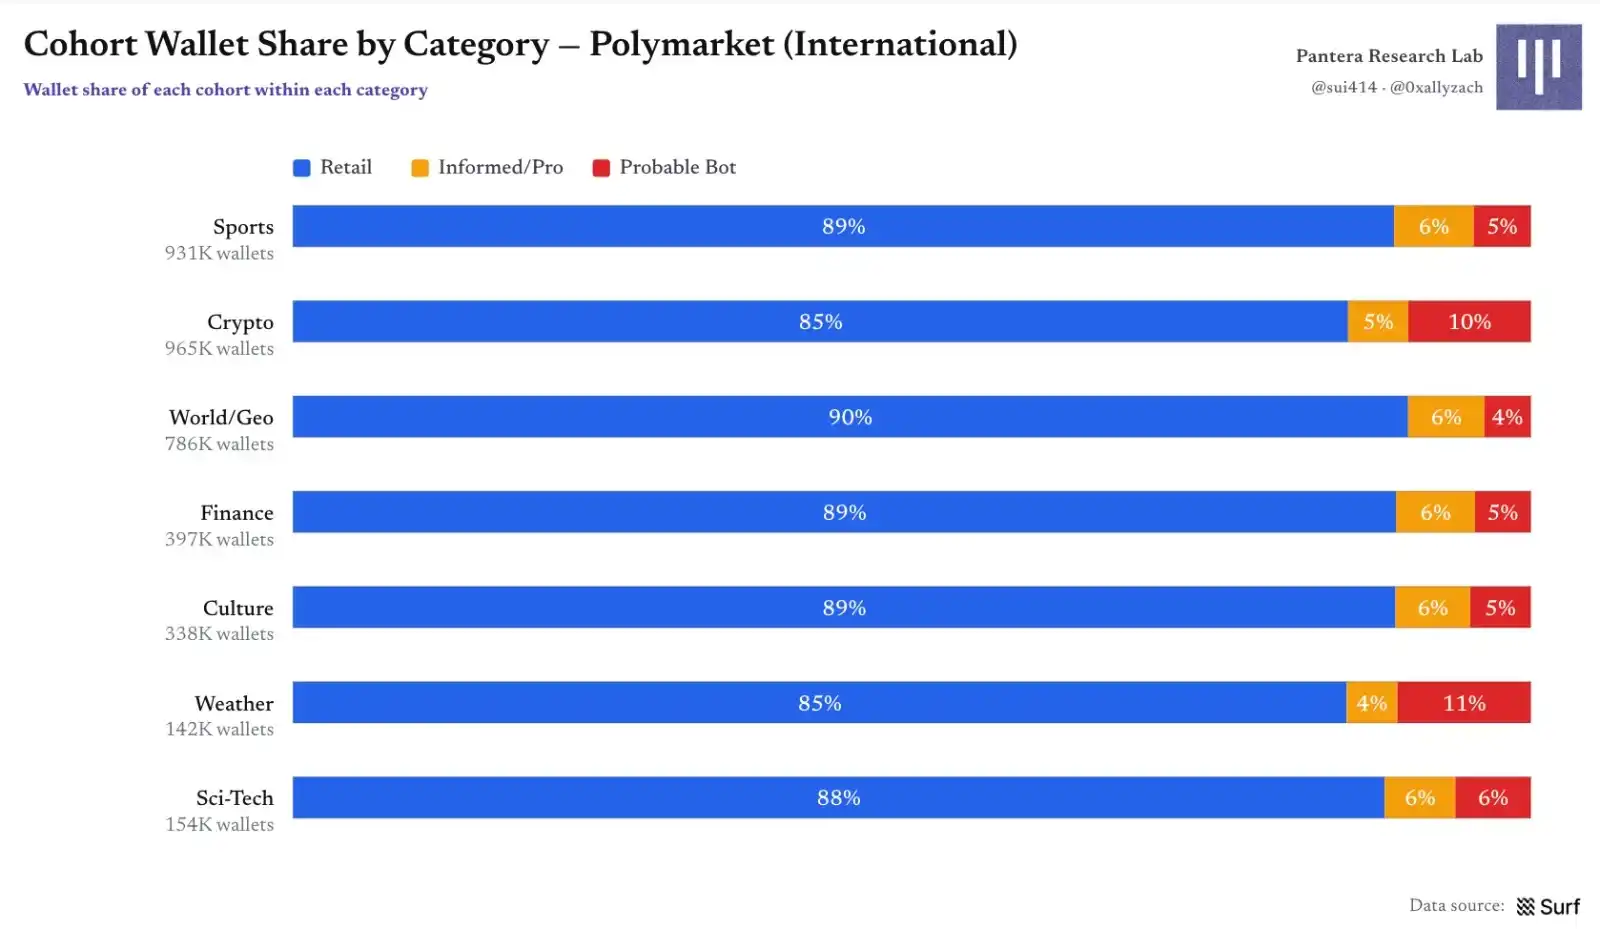
Figure 20 | Group Wallet Share by Category
Are Prediction Market Users Fee-Sensitive?
Different categories enabled fees at different times, creating a natural experiment; the zero-fee World/Geopolitics category serves as a control. Results show that post-fee implementation, volume composition shifts noticeably, especially in Crypto, Culture, and Weather markets: the share of volume from Professional/Informed users declines rapidly, while Retail and Bot shares remain relatively stable, showing stronger fee insensitivity.
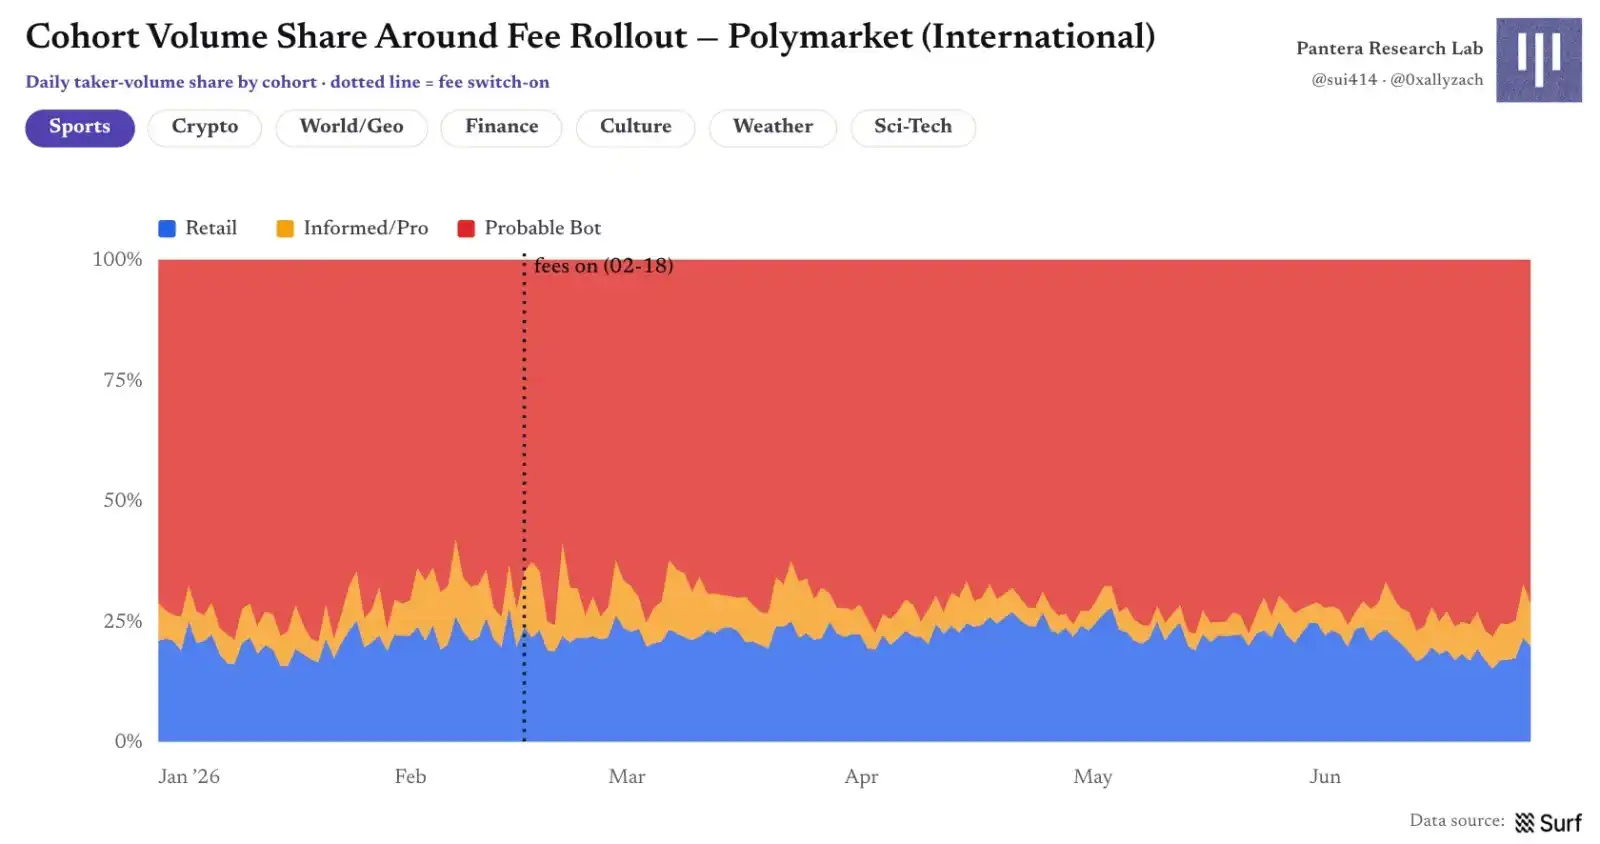
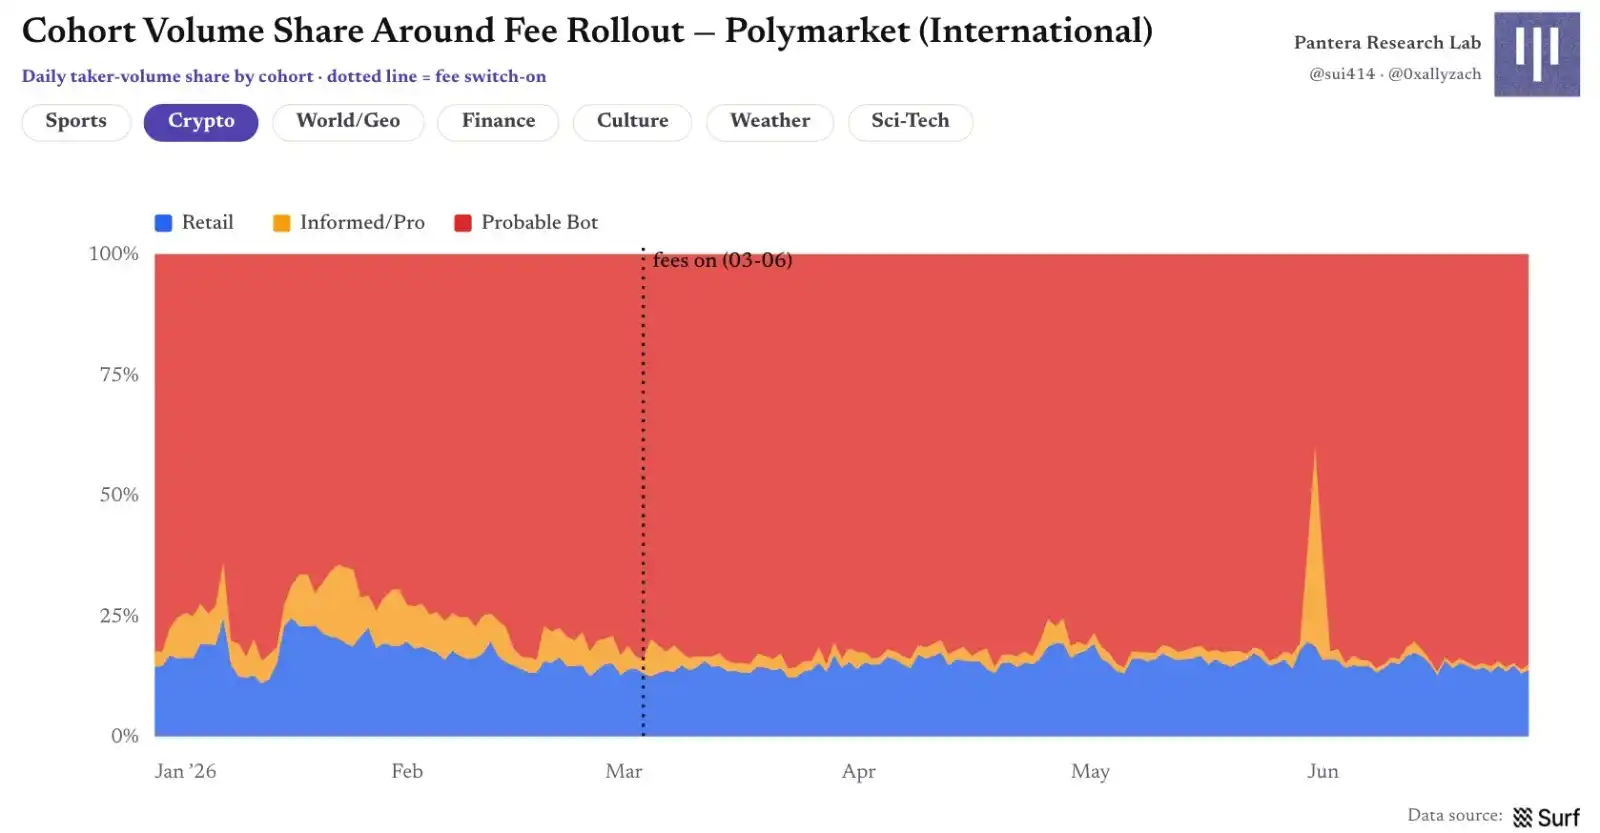
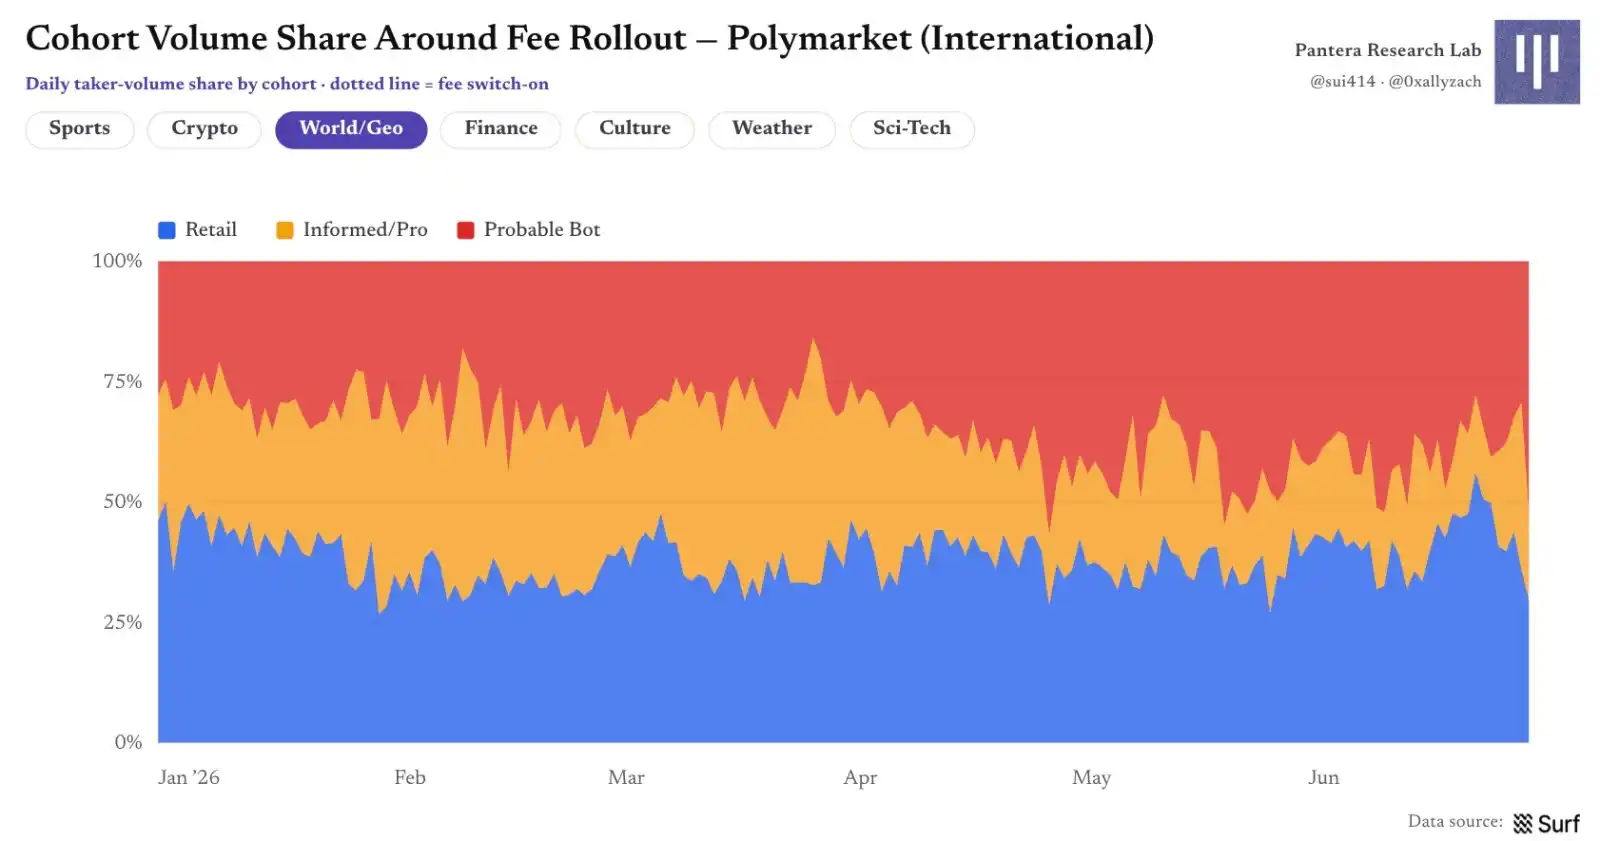
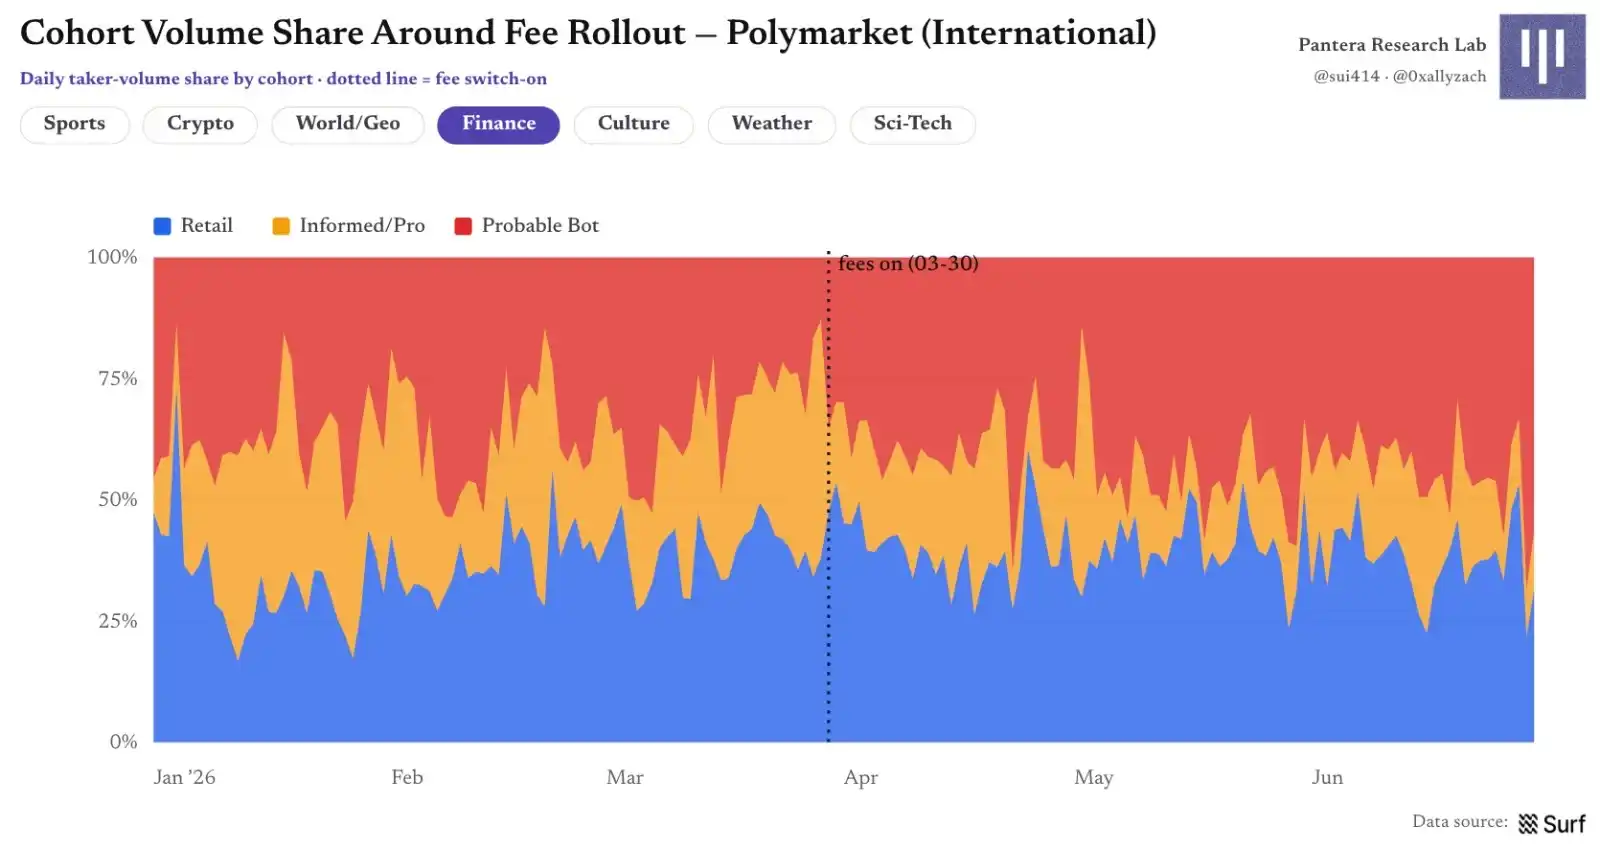
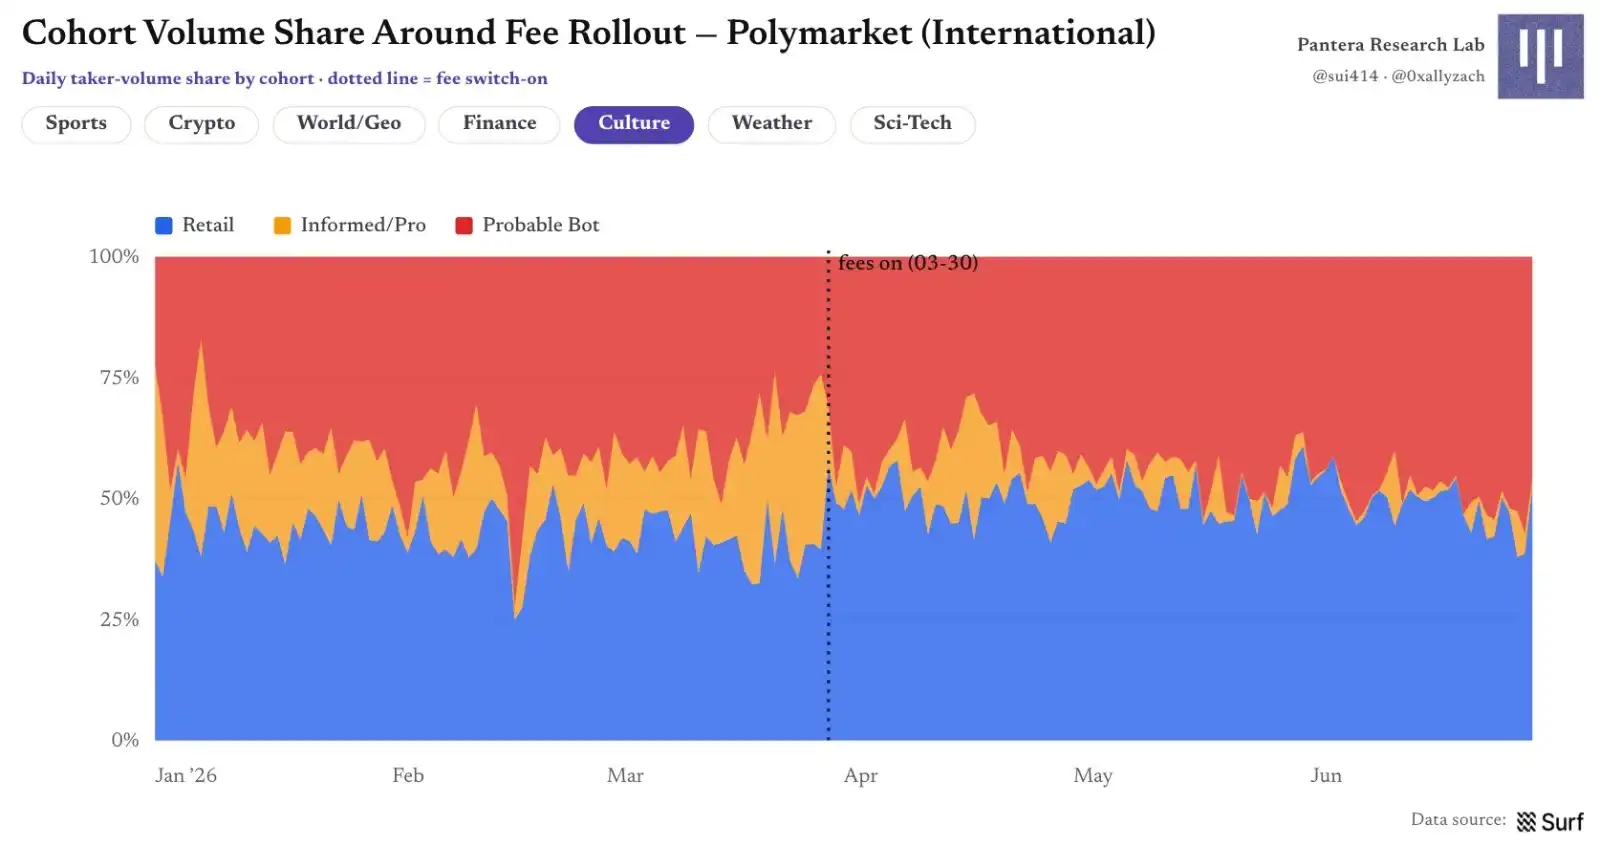
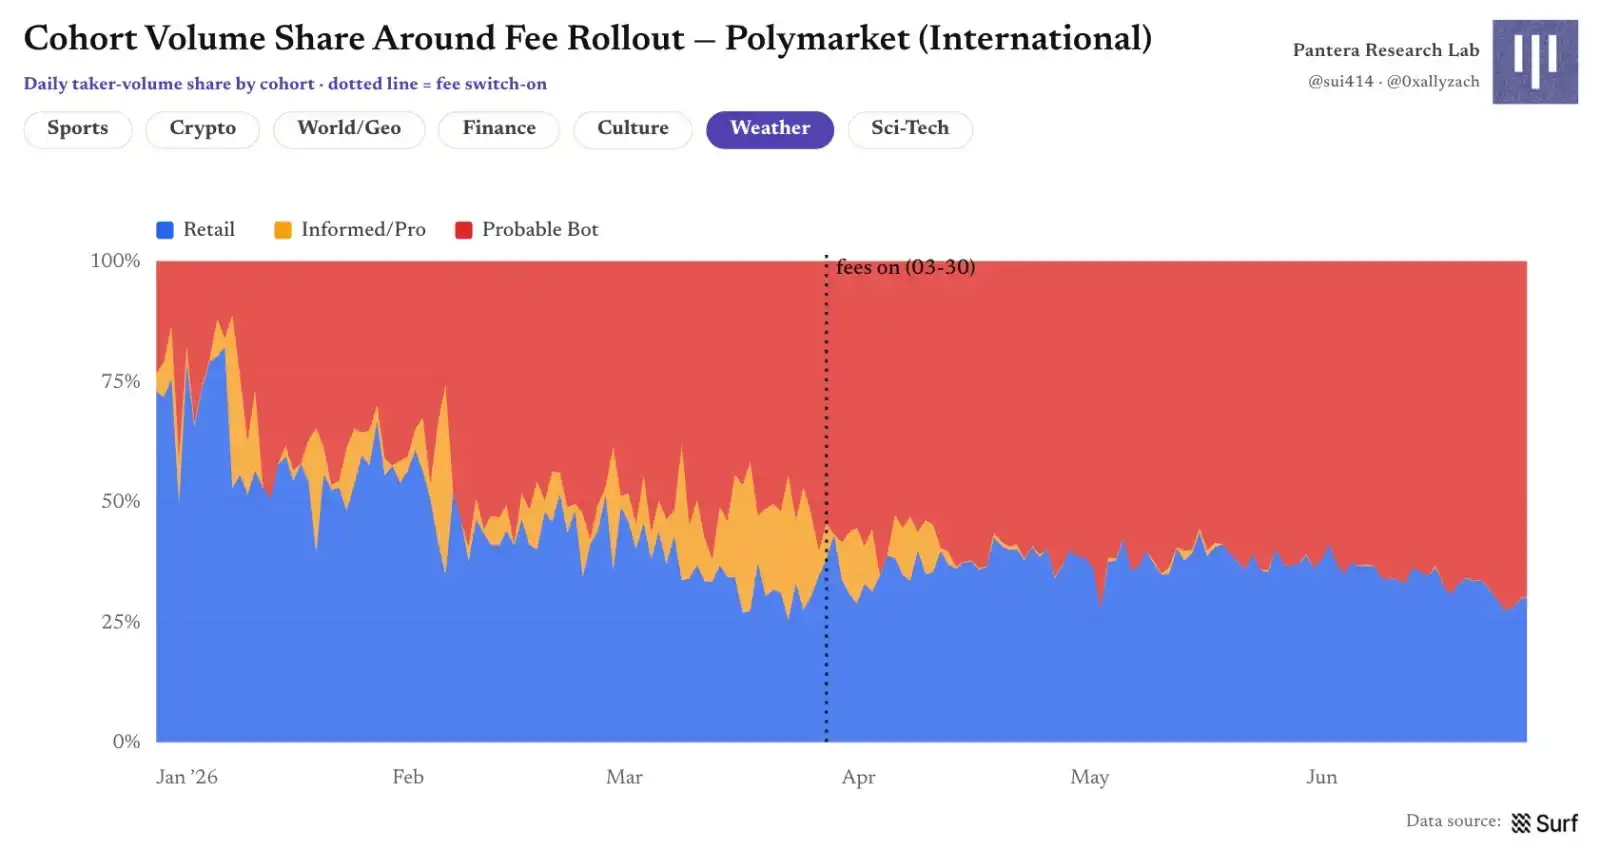
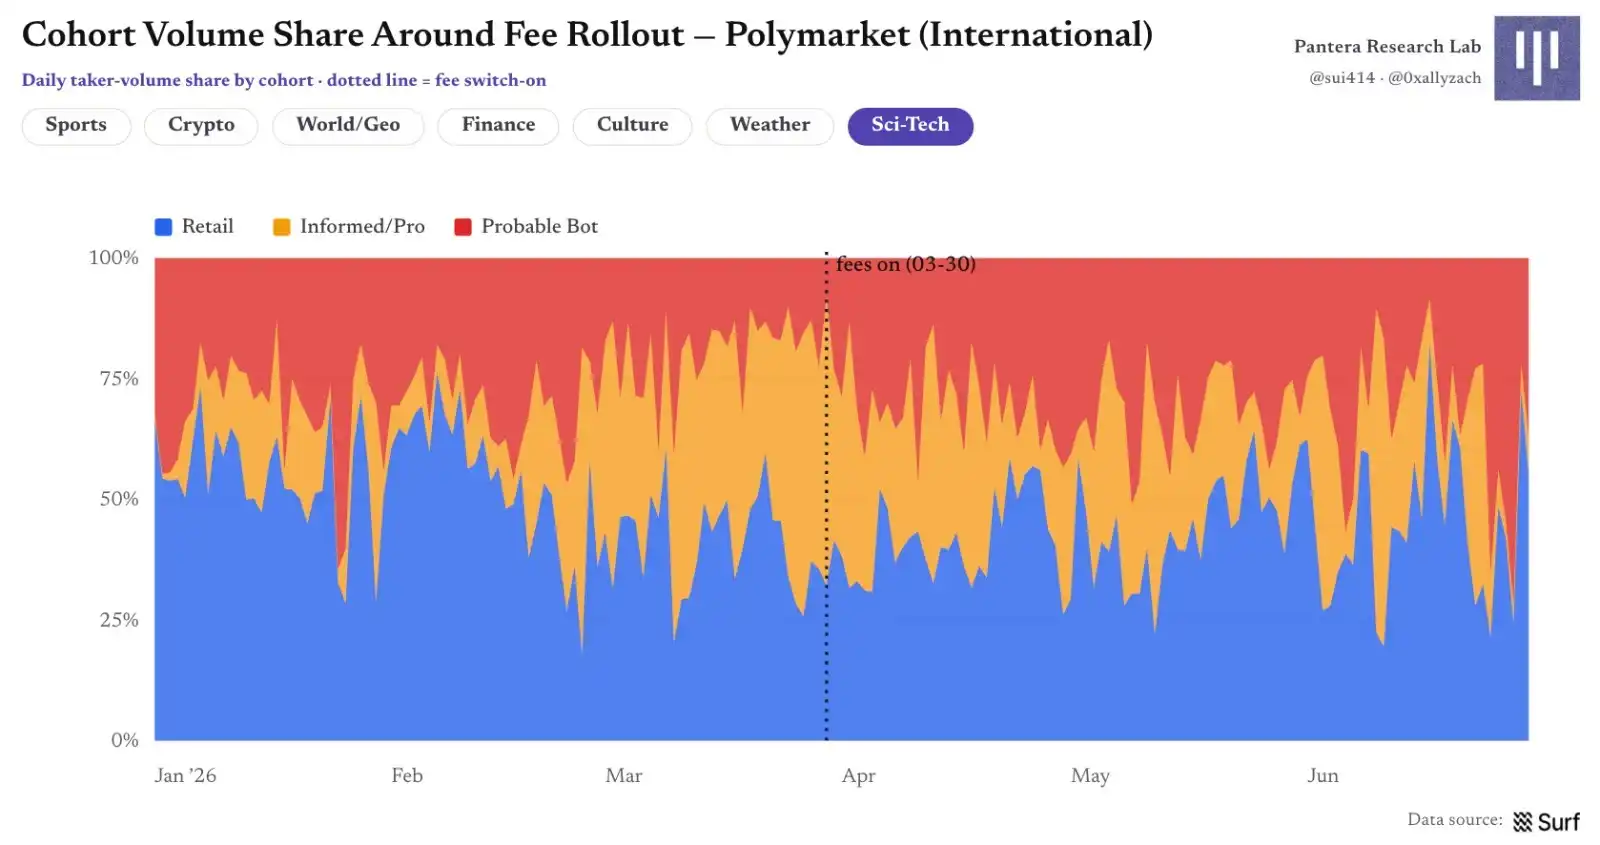
Figure 21 | Group Volume Share Pre- and Post-Fee Implementation
Changes in wallet share are much smaller in magnitude than volume share, but follow a consistent pattern: Professional/Informed wallets show the most noticeable decline in the three categories mentioned above. Fees change "who increases bets," not necessarily "who remains present" immediately.
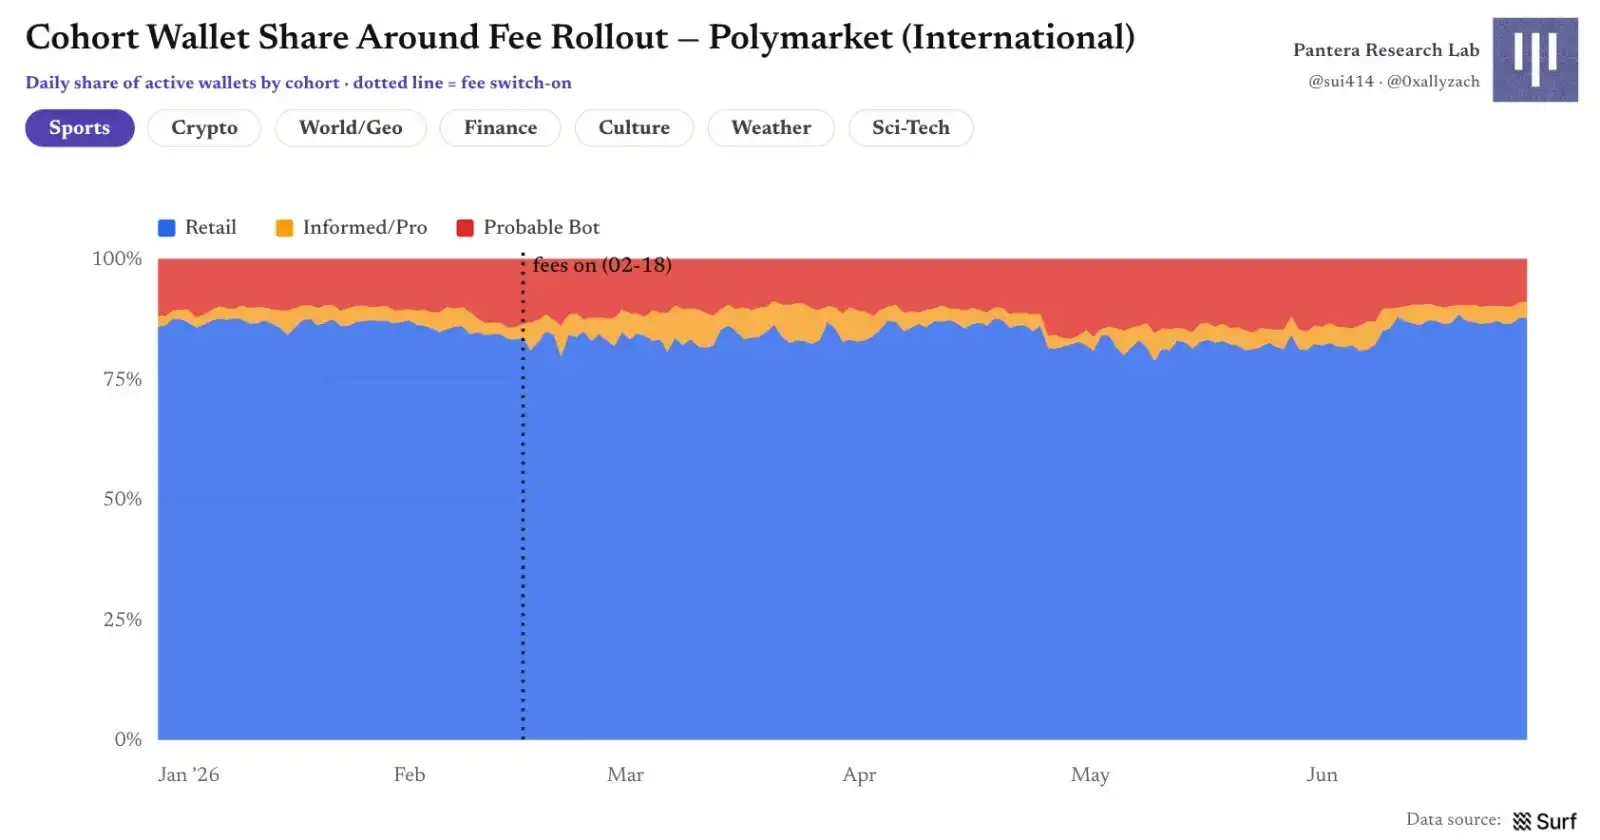
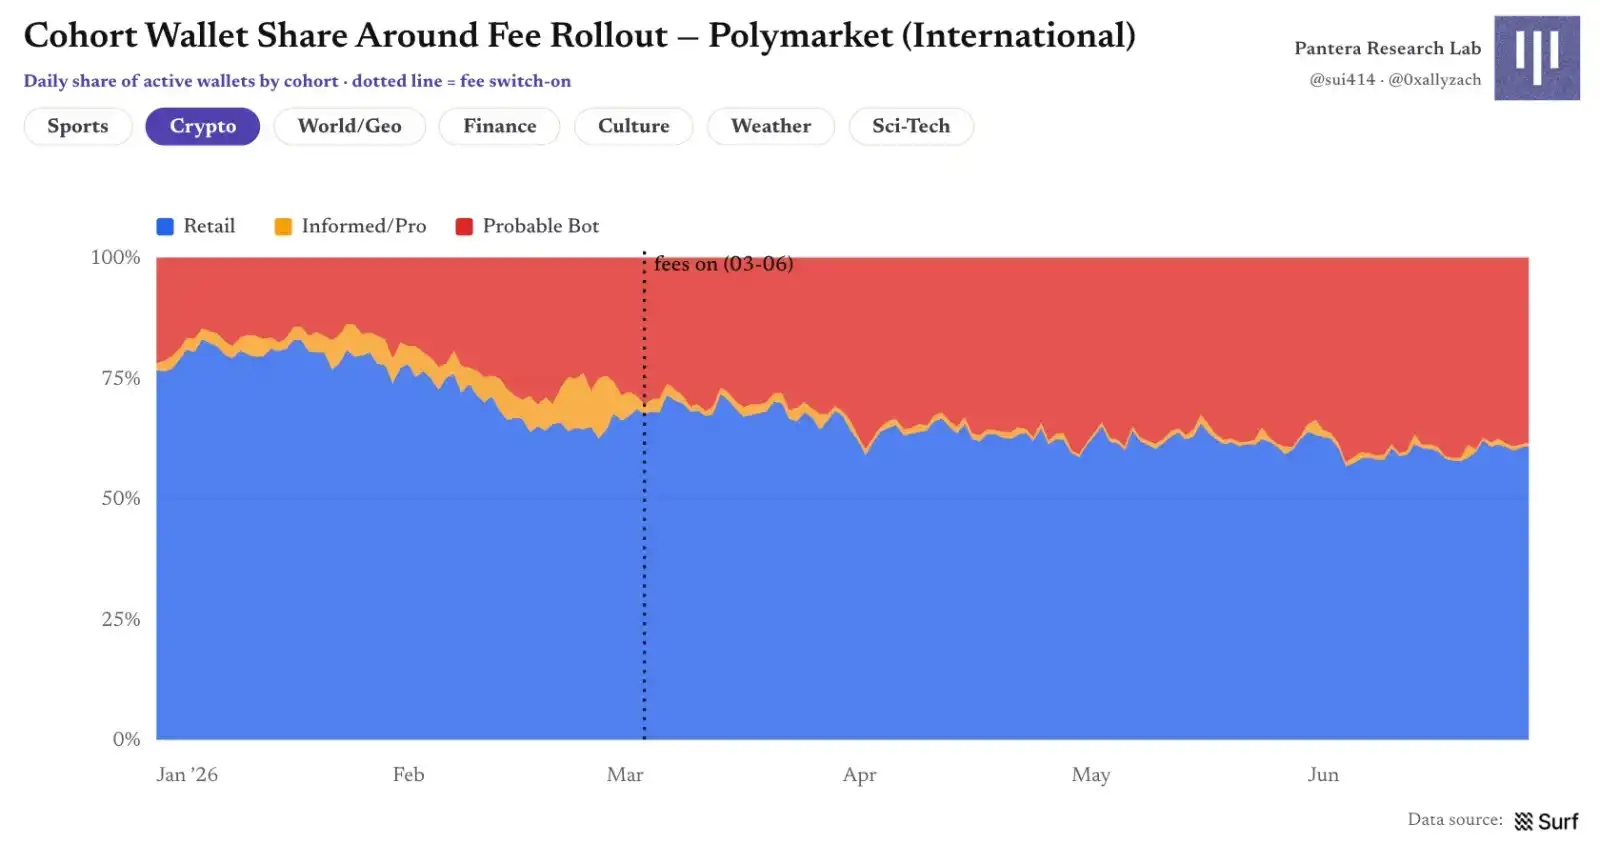
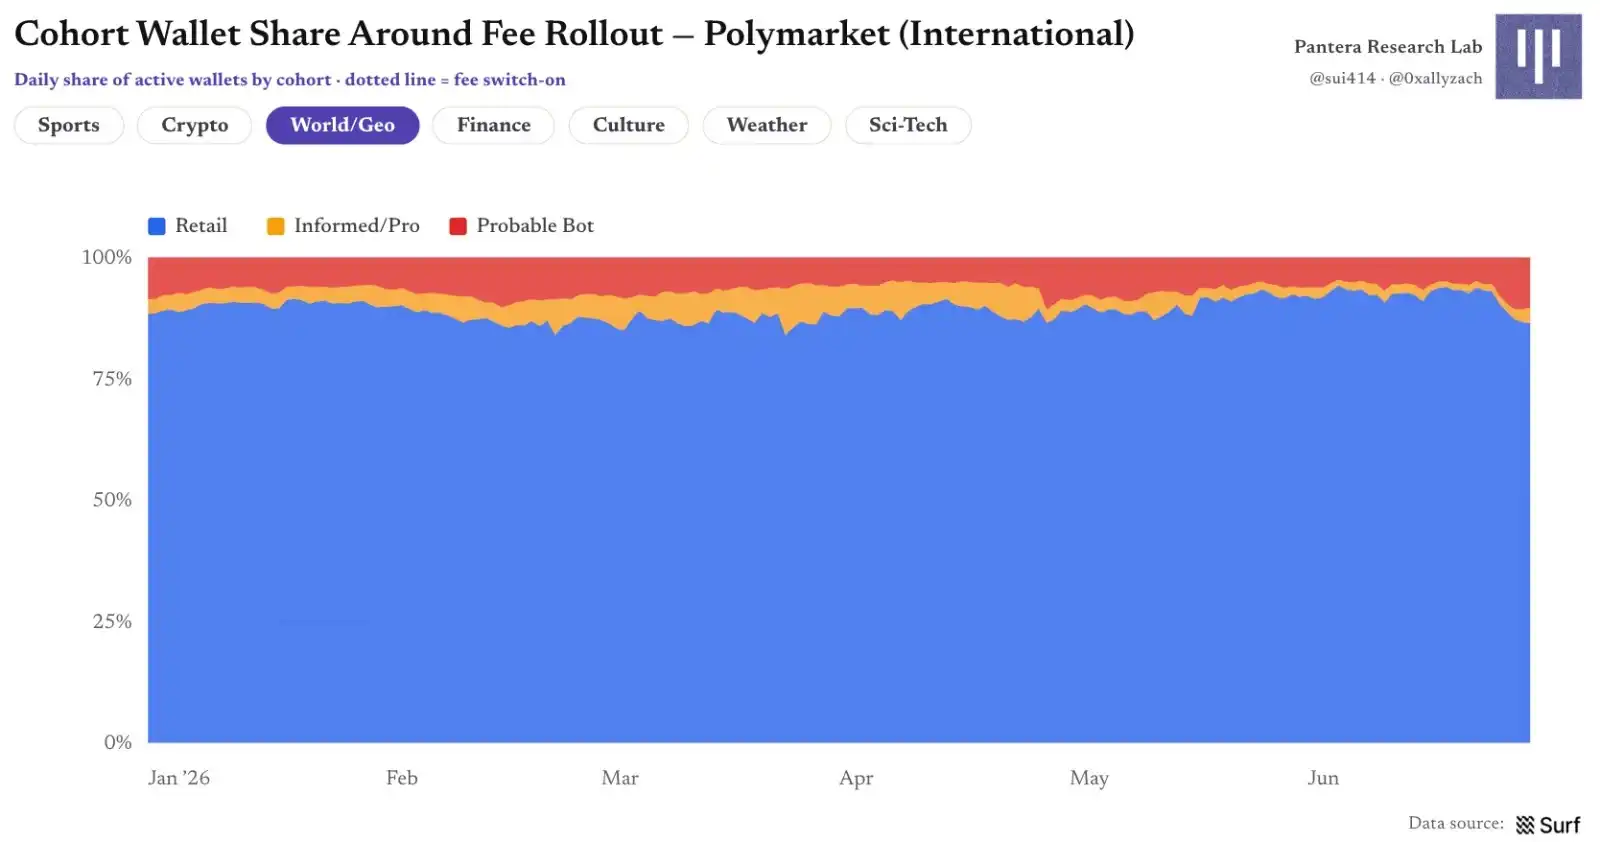
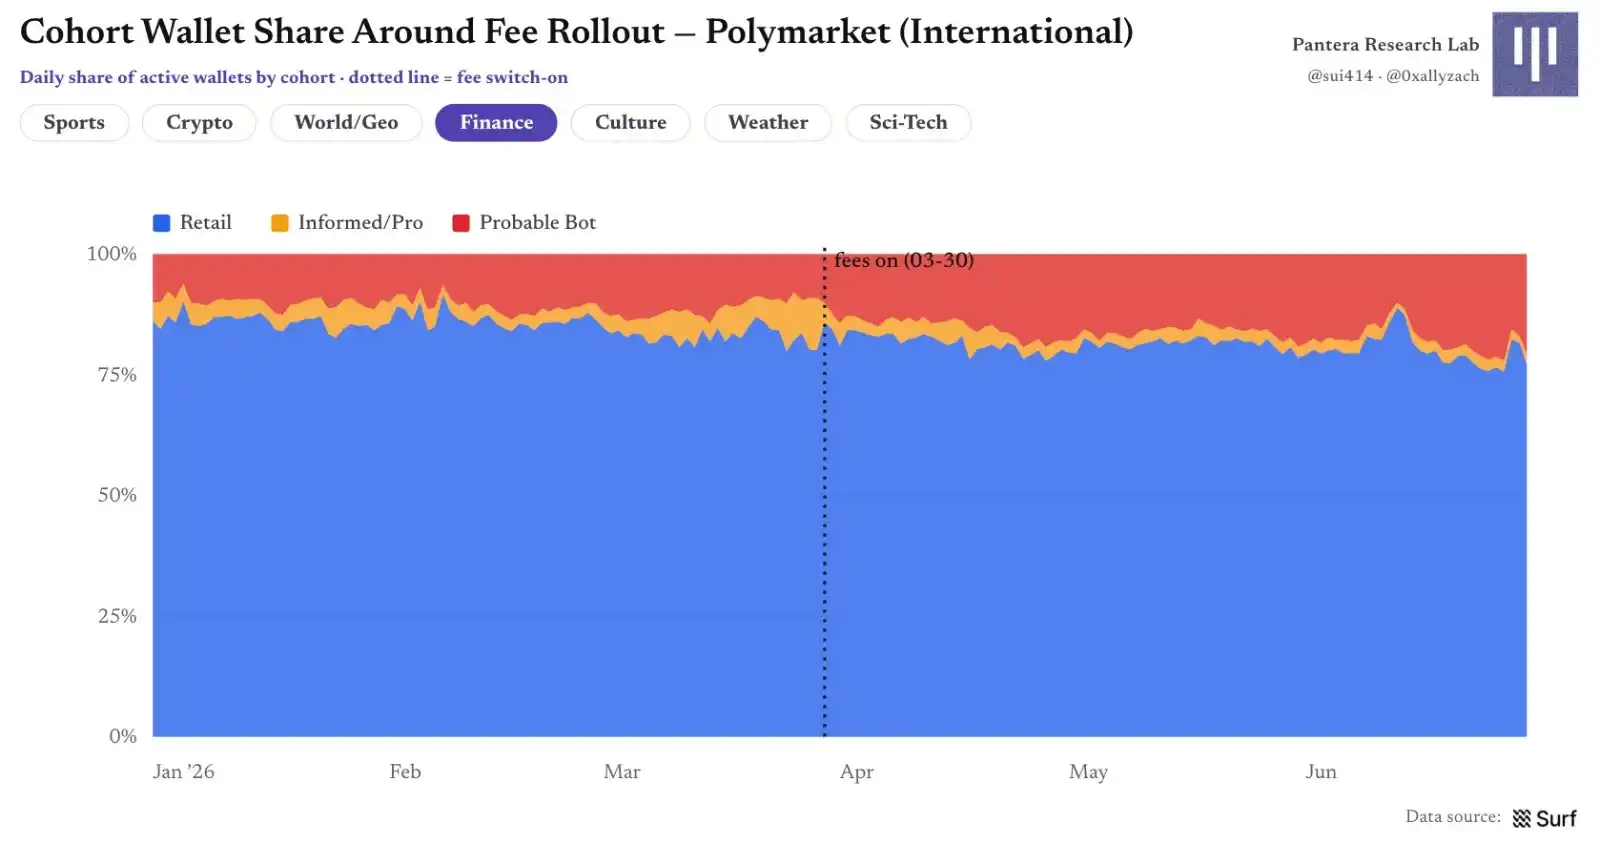
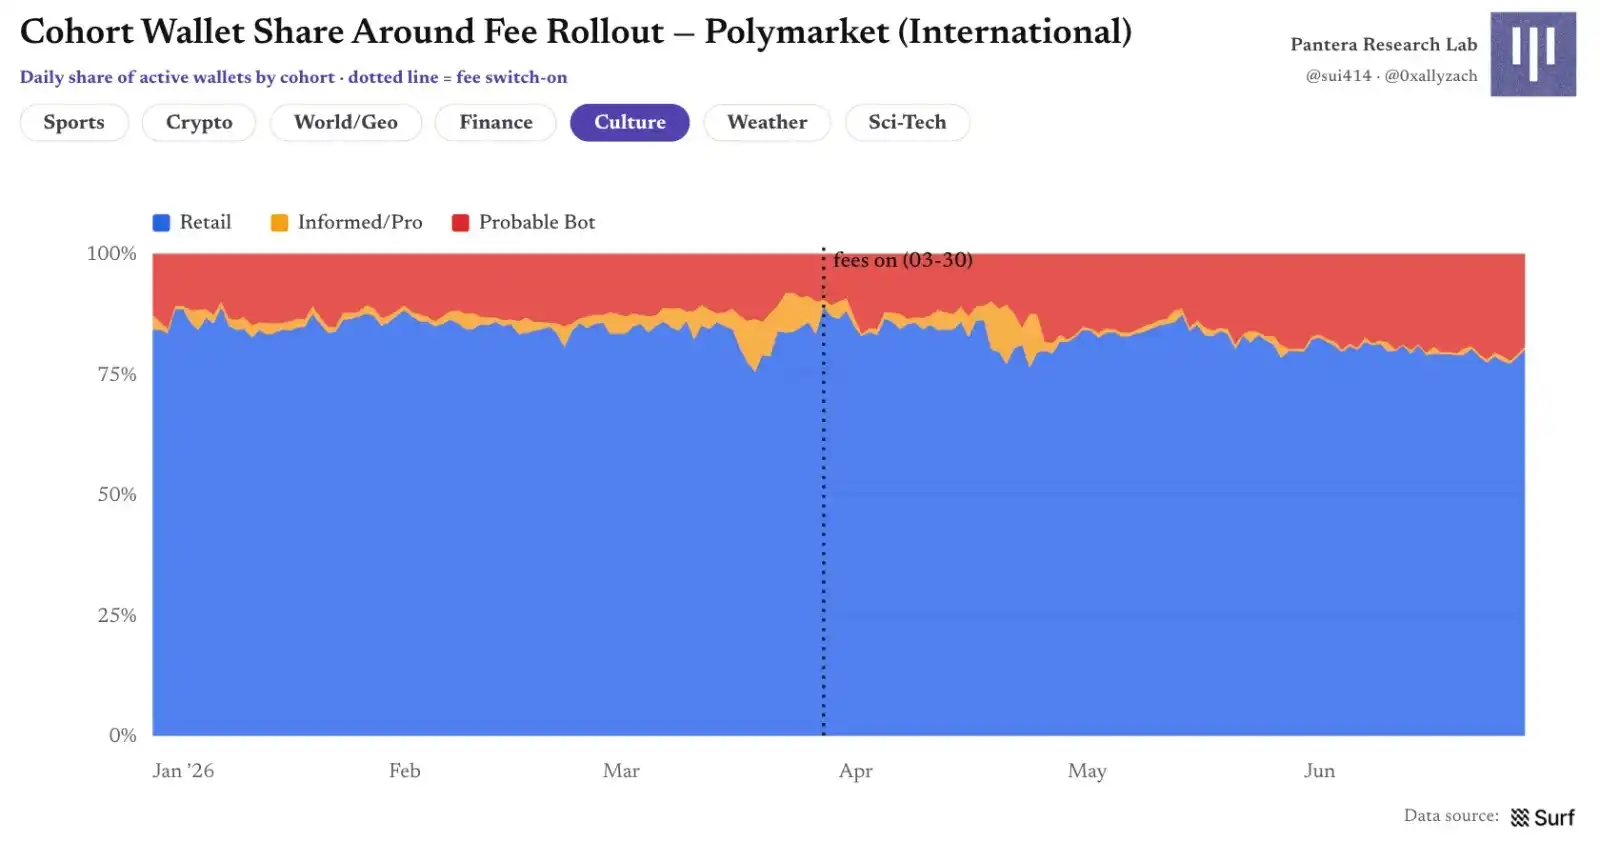
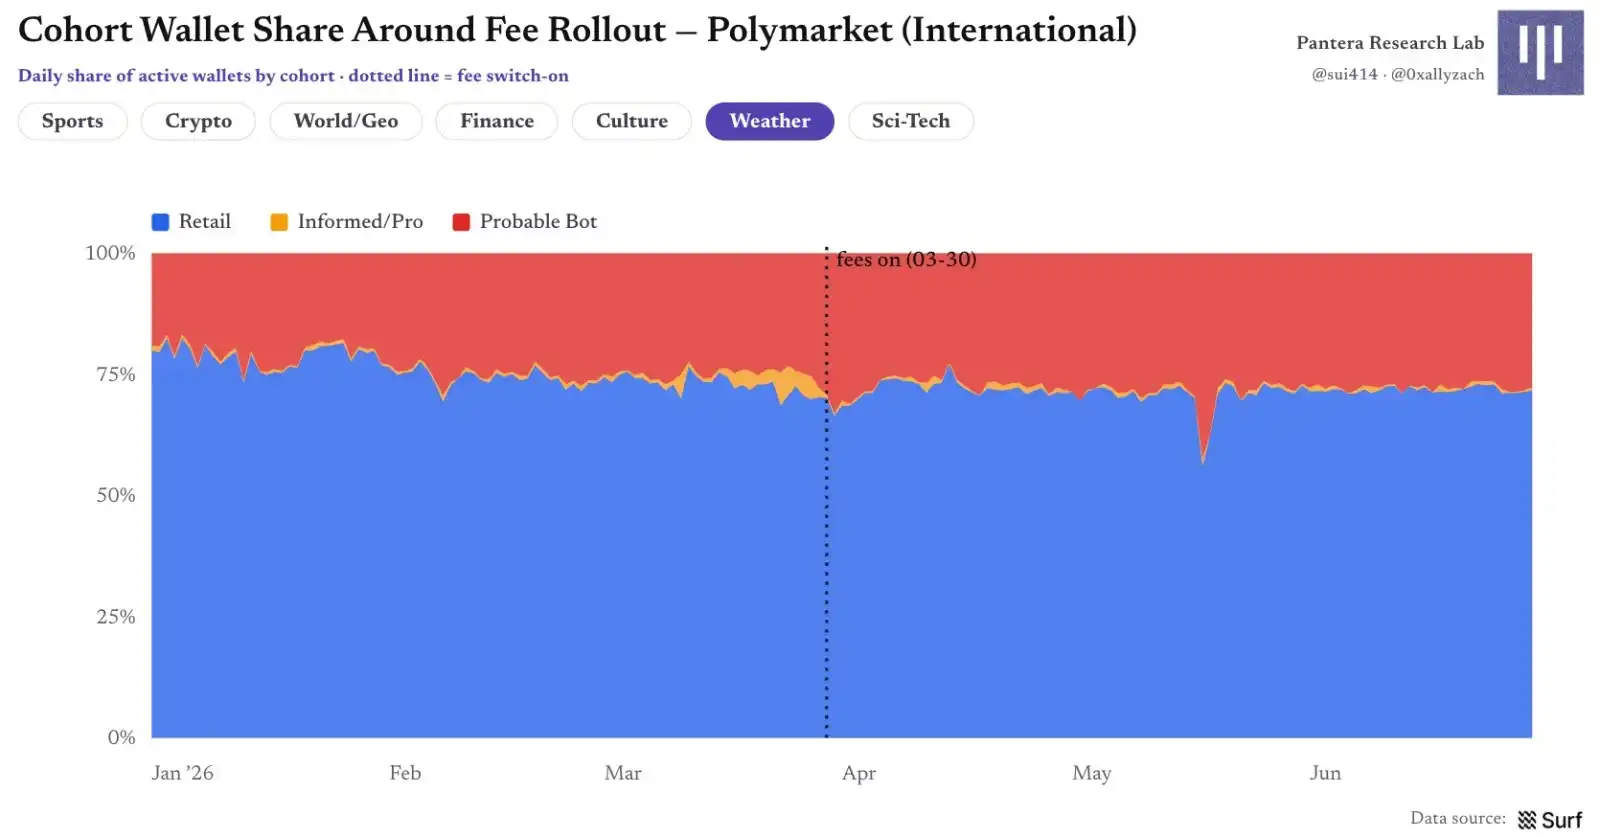
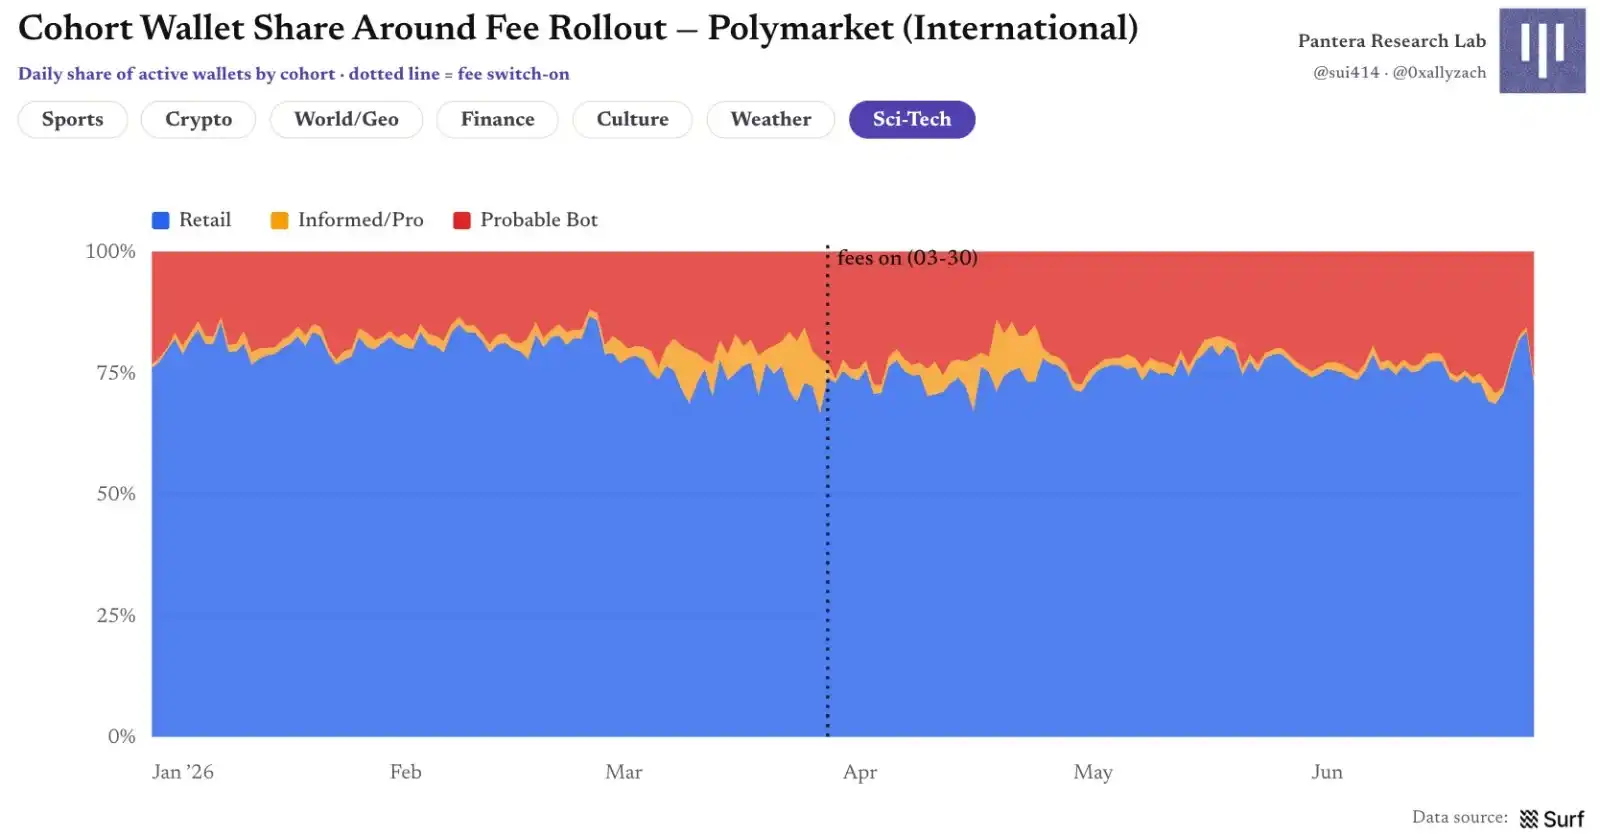
Figure 22 | Group Wallet Share Pre- and Post-Fee Implementation
Entry Timing: Most Arrive Very Late
Late entry is the norm within a market's lifecycle, but the degree of lateness differs across information games. Sports and Crypto are the most competitively delayed: median entry for all groups falls between 92%–95% of the market lifecycle, creating clear adverse selection pressure against retail users. Culture is around 85%–90%; Weather is the opposite, with the earliest entry, retail median ~61%, bots ~51%, consistent with outcome-based markets that models can price earlier. Weather is also the category where Professional users enter relatively latest, median ~83%.
Entry timing analysis only includes markets with complete lifecycles visible: markets settled in H1, with wallets tracked from the first trade, including positions entered before 2026.
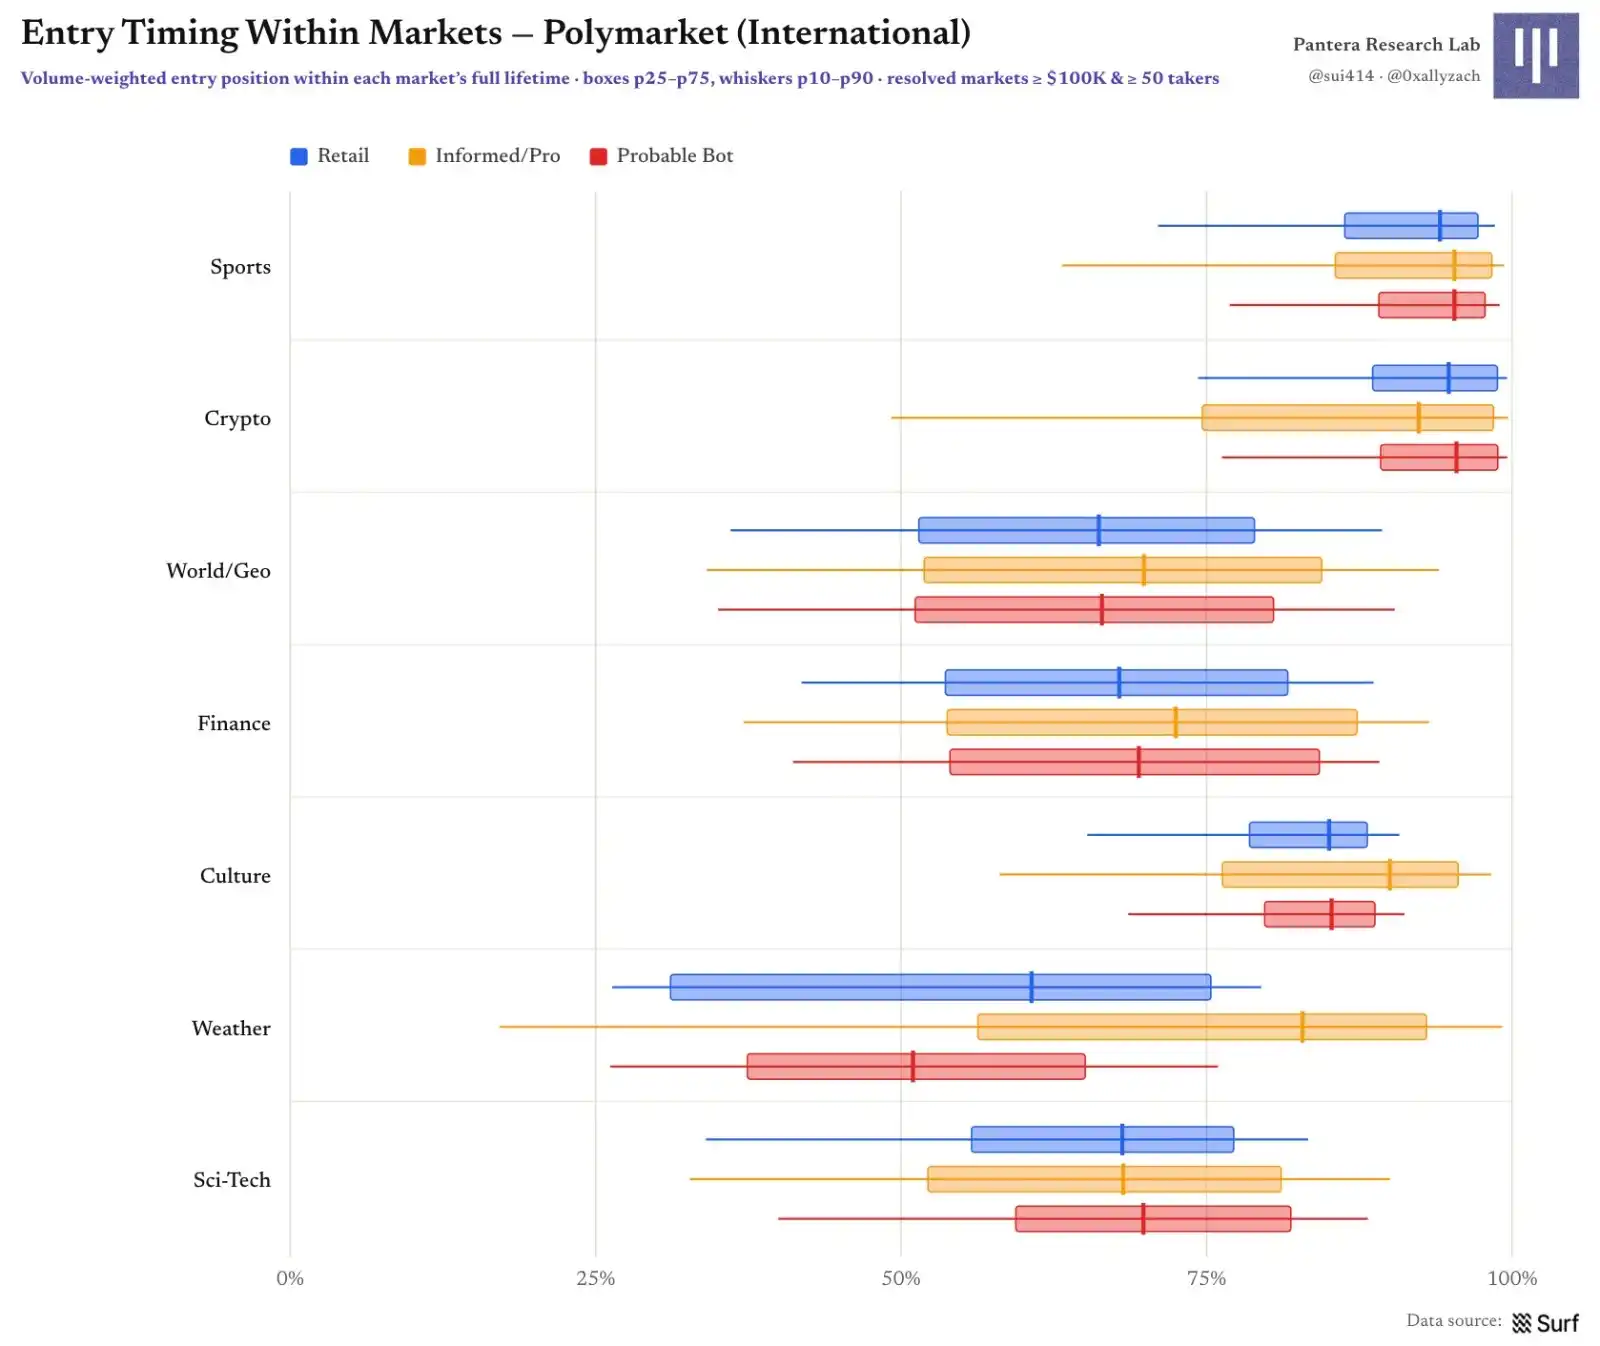
Figure 23 | Weighted Entry Position Within Market Lifecycle by Group
The top-volume market in each category reveals more intuitive intraday rhythms: retail trades often span the entire market cycle; Professional/Informed users and bots are more likely to surge when information arrives or concentrate bets near settlement.
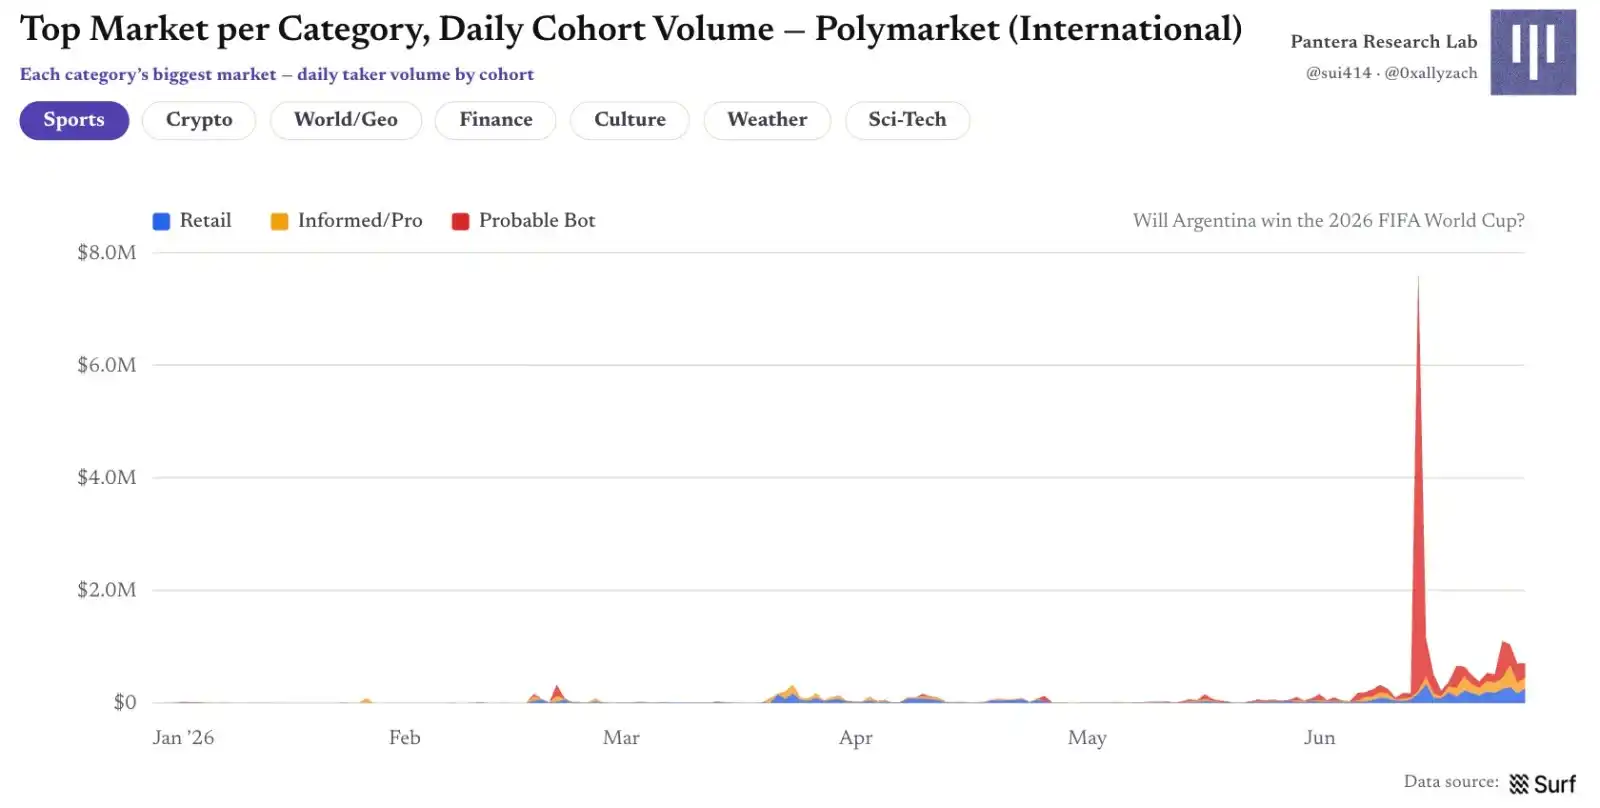
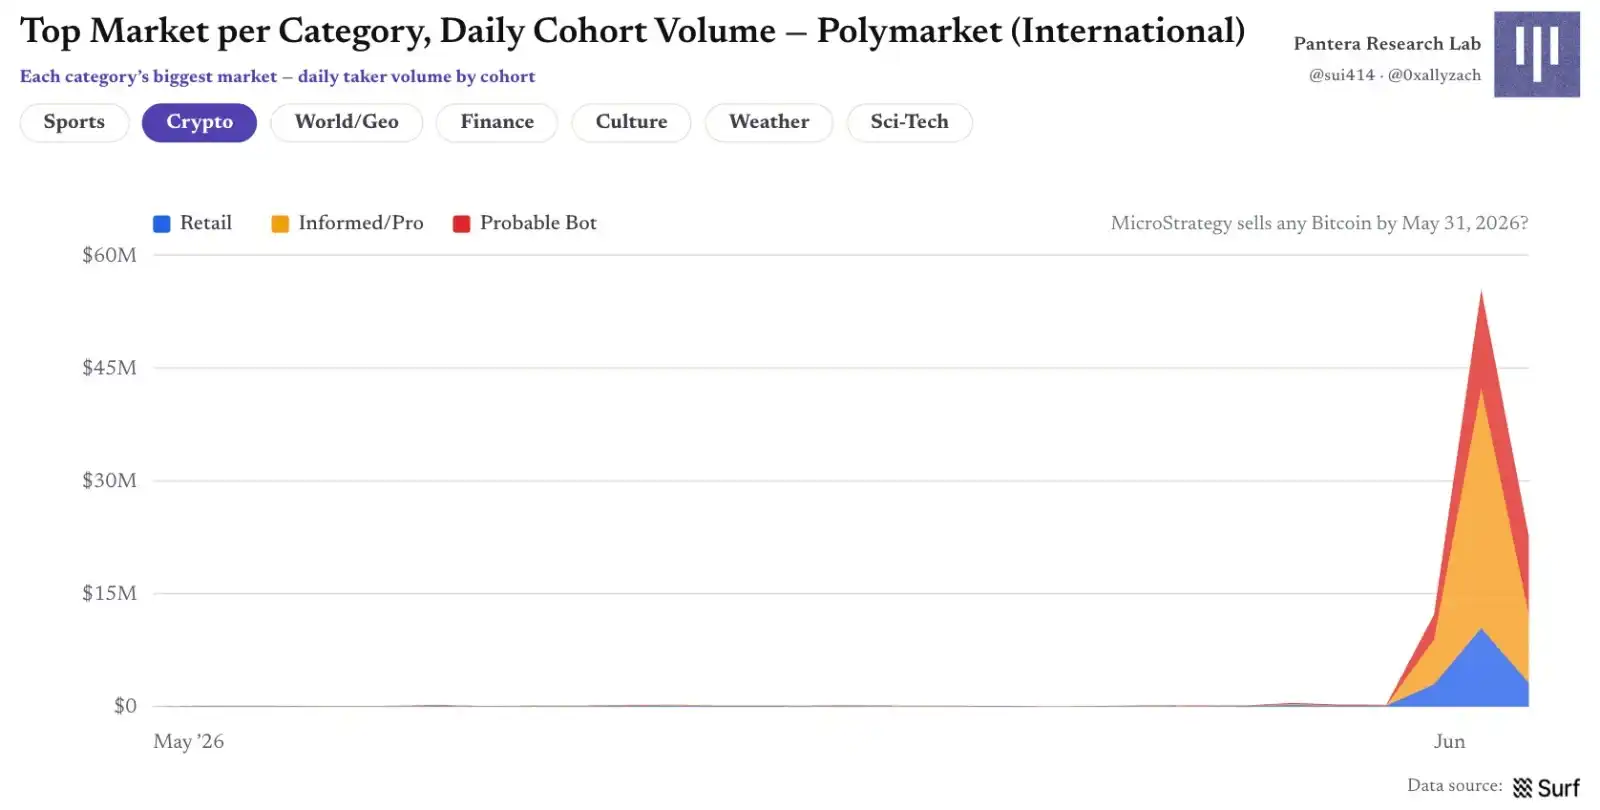
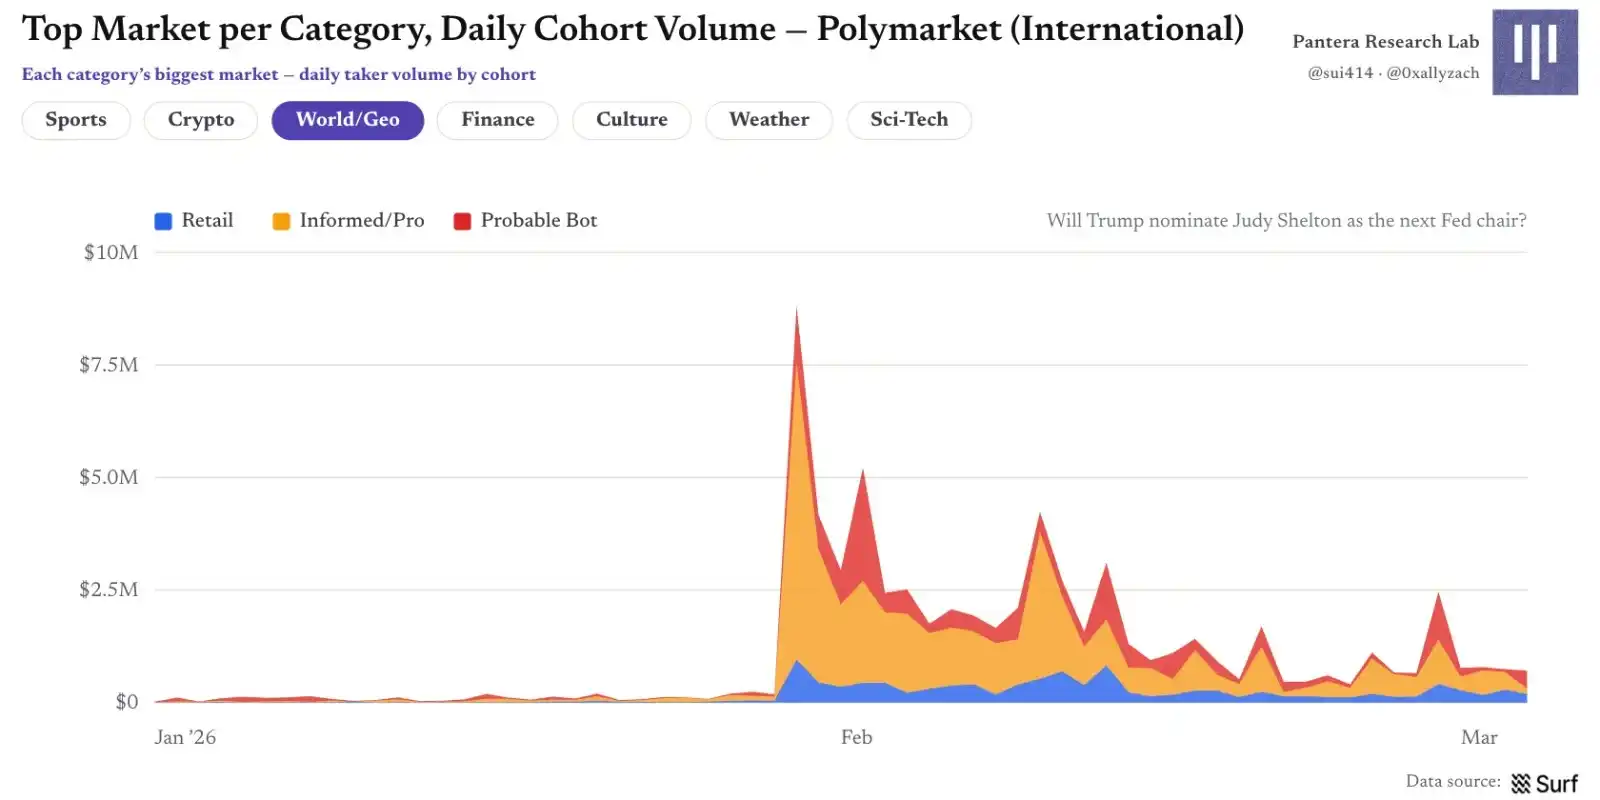
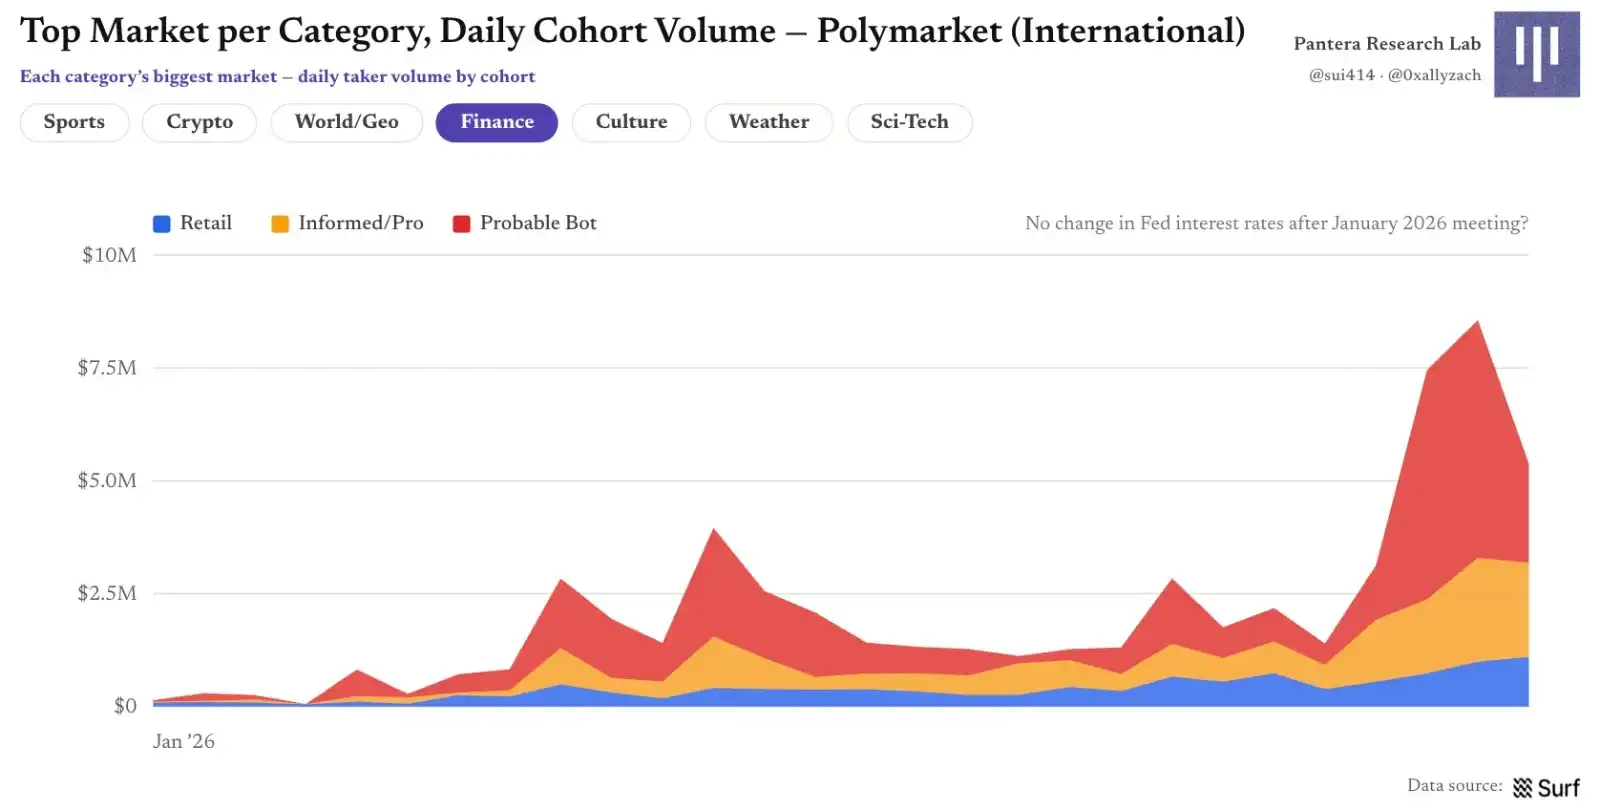
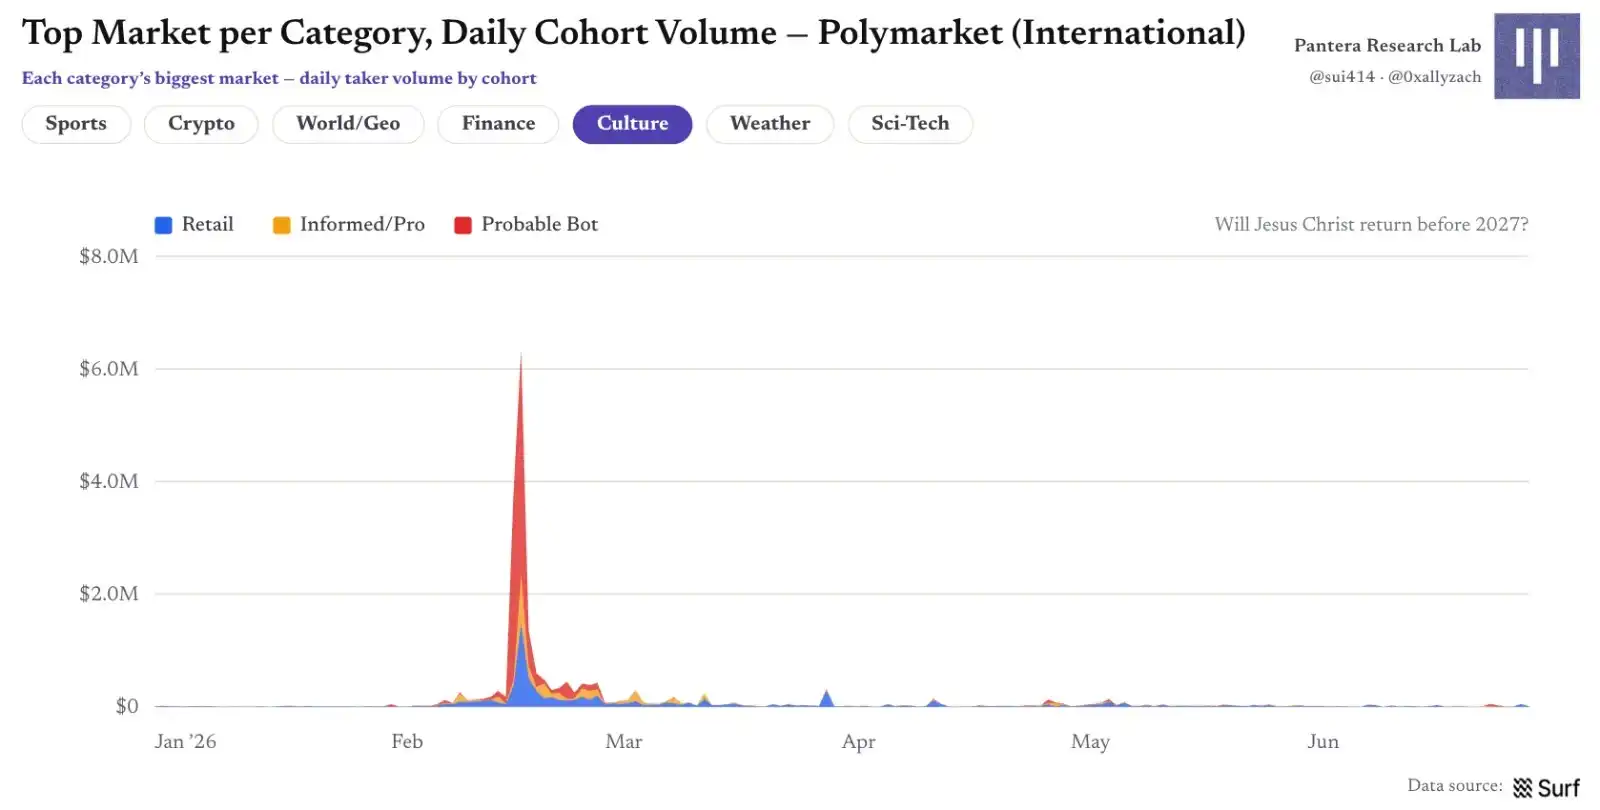
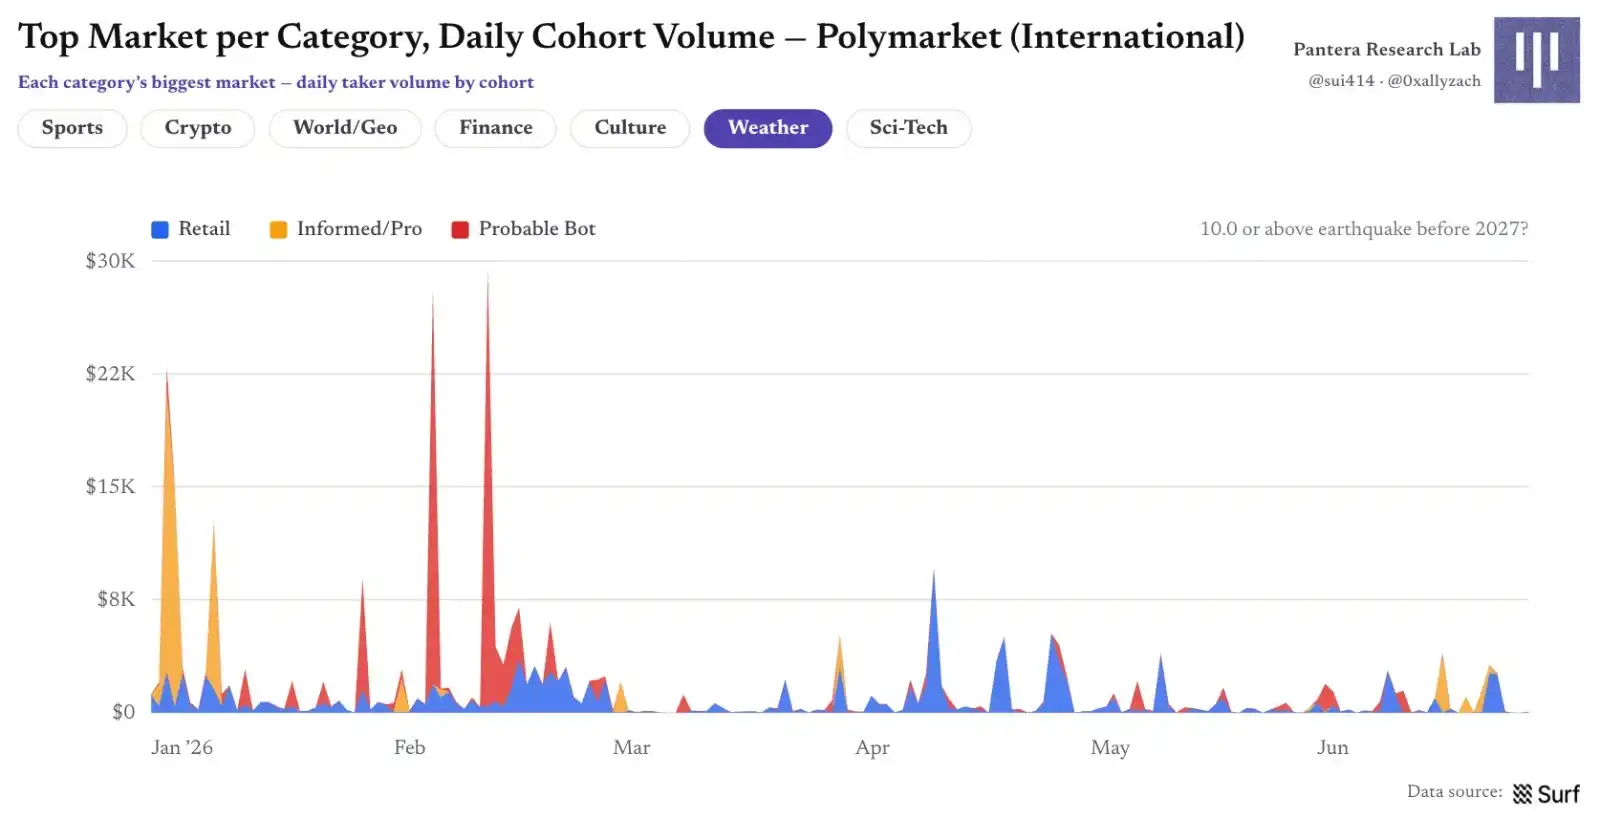
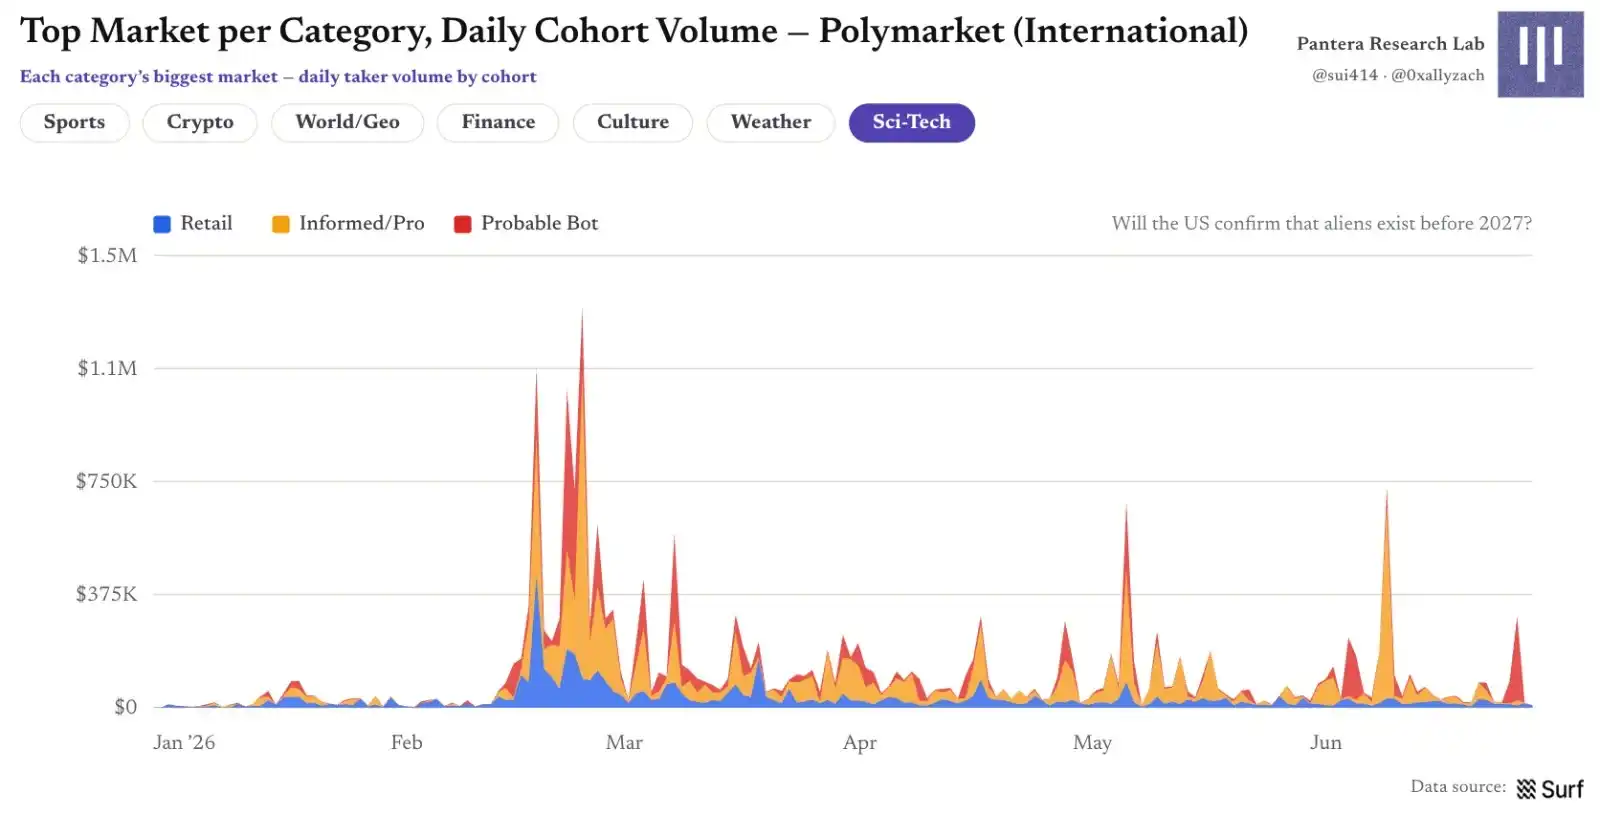
Figure 24 | Daily Group Volume for Top Markets by Category
Who Actually Makes Money?
Summing cash flows from all positions in markets settled during H1, the pre-fee ledger nets close to zero: among approximately 1.97 million wallets with settled positions, 34% ended positive. Big winners total about +$666 million, big losers about −$530 million, and all groups sum to approximately zero. This validates that this calculation is gross PnL before fees; after deducting the approximately $184 million in H1 fees, the aggregate result turns negative.
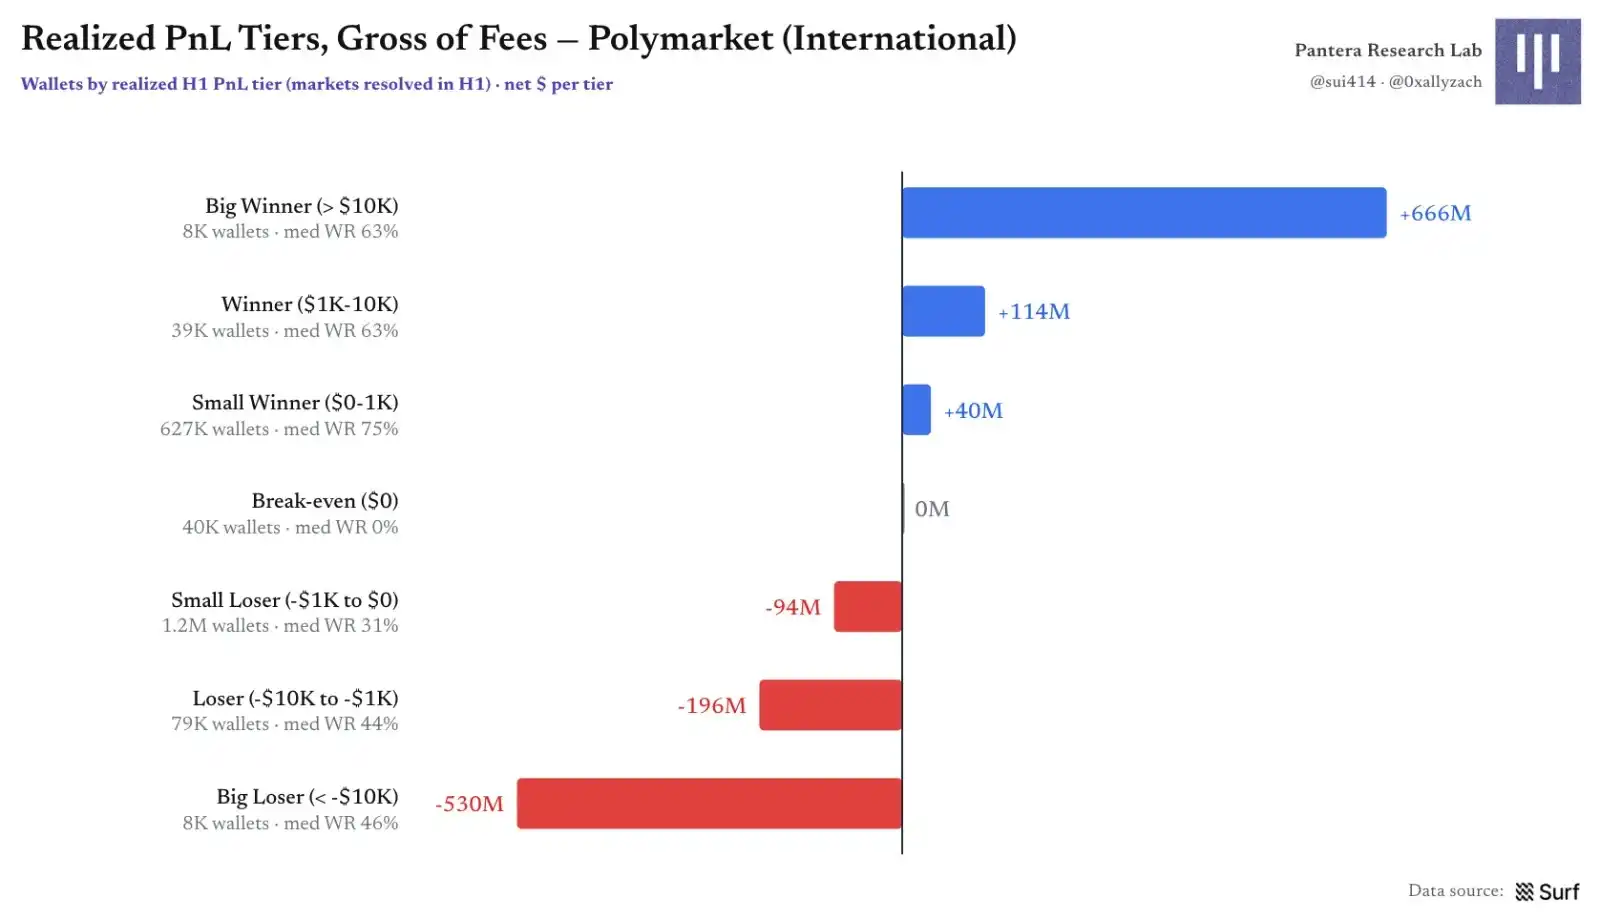
Figure 25 | Pre-Fee Realized PnL by Tier
Breaking down by group, the capital flow is clear: Retail and Professional users jointly provide the counterparty for the Bot group's positive profits. Bots are the only cohort with an aggregate net profit, totaling about +$108 million, but only 27% of bot wallets are profitable, and the median bot wallet is still in the red. Profits are carried by a minority of large-scale operations; sustained profitability is exceedingly rare.
Professional users have the highest profitability hit rate, with about 42% of wallets positive; Retail ~35%, Bots ~27%. But Professional users still lost about $26 million in aggregate. Since various incentives and rebates are not included here, one cannot conclude that Professional users' final net profit is negative. The Retail cohort lost about $74 million in aggregate.
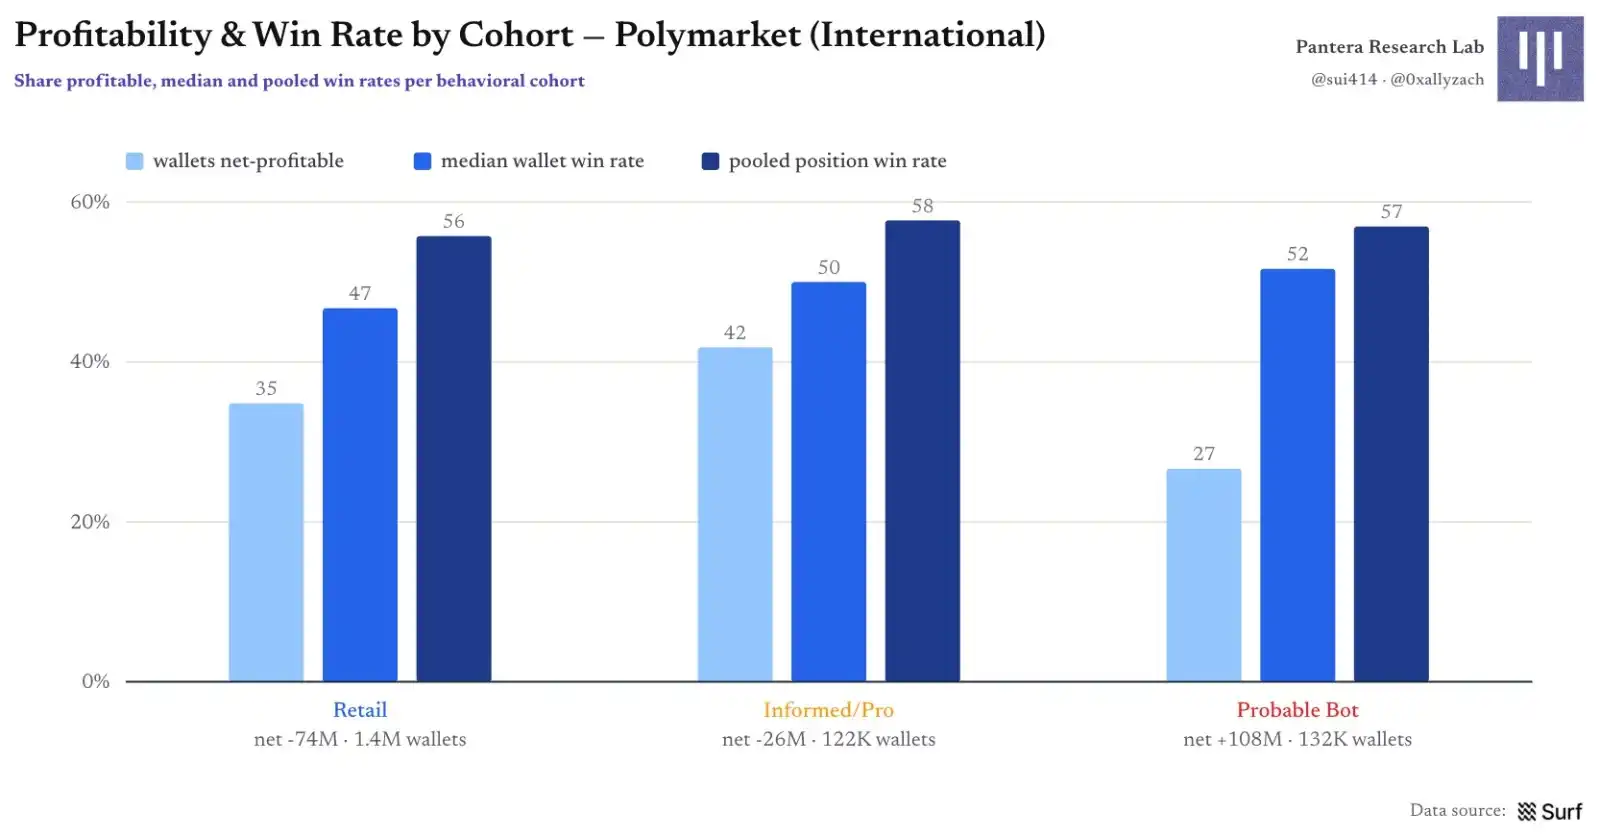
Figure 26 | Profitability Ratio and Win Rate by Group
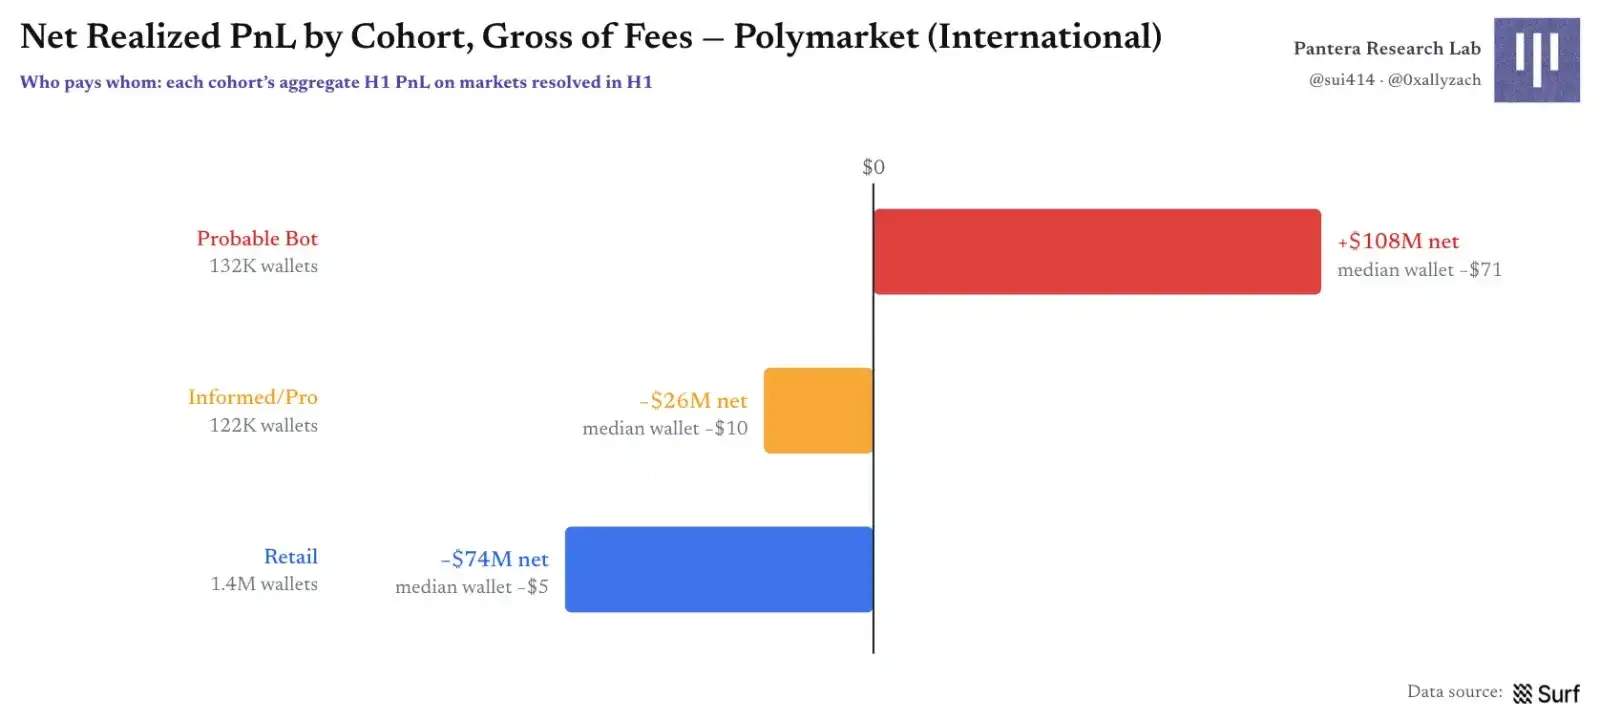
Figure 27 | Net Realized PnL by Group: Who Pays, Who Receives
Among approximately 1.75 million wallets, only 146 wallets maintained positive cash flow for six consecutive months; even among wallets that were ever profitable, for many, over 90% of their profits are concentrated in a single month. Profitability in prediction markets resembles sporadic spikes, not a stable salary stream.
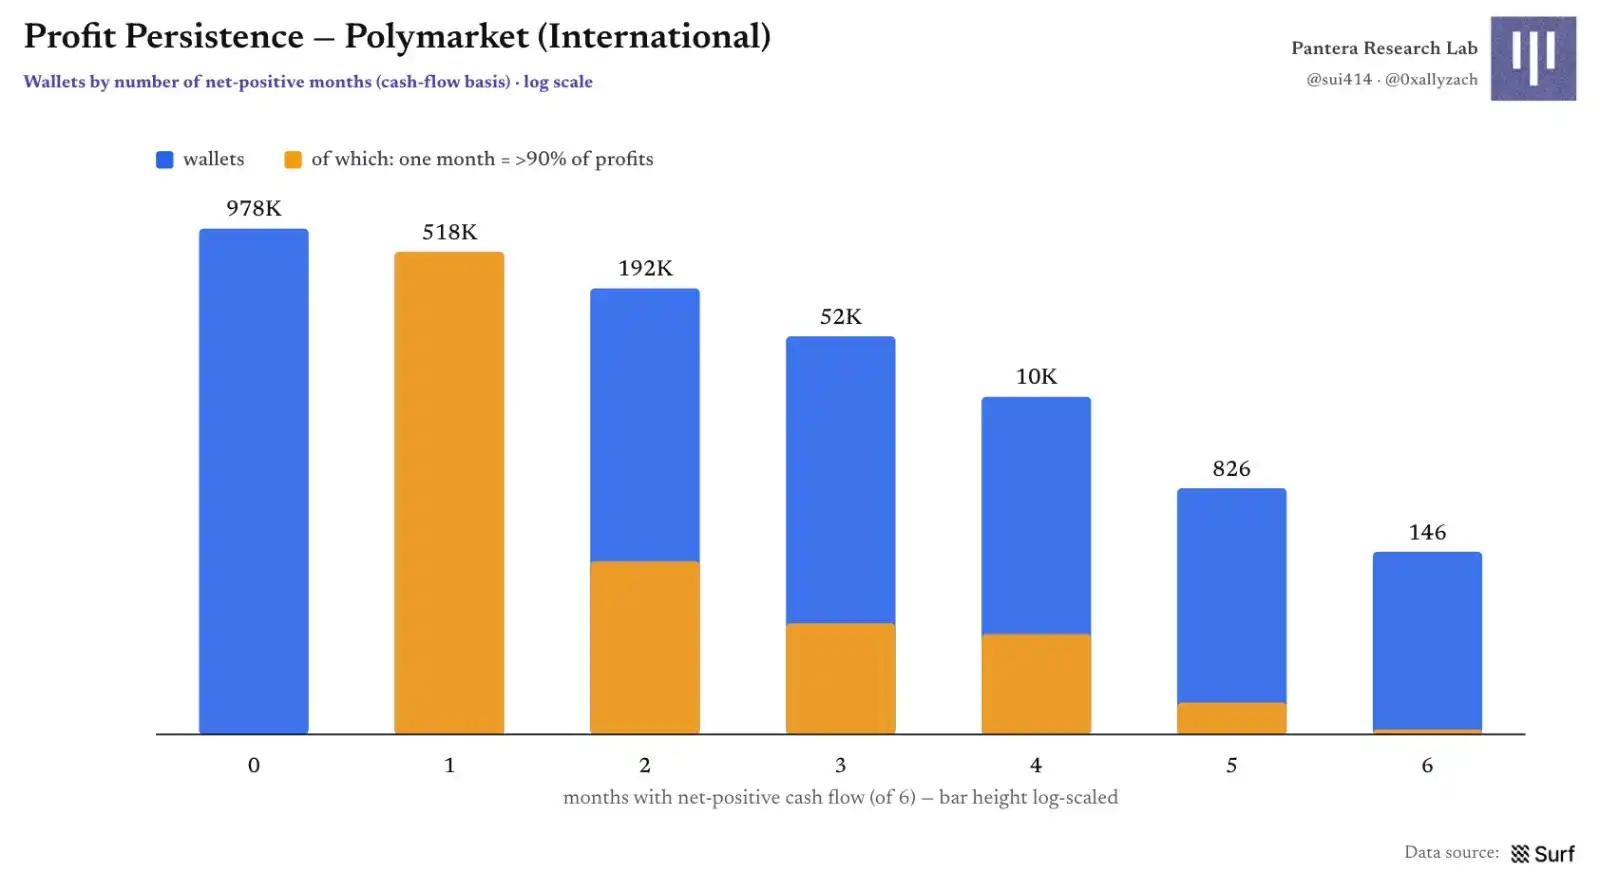
Figure 28 | Profit Persistence: Distribution of Consecutive Positive Cash Flow Months
Methodology & Metrics:
Data for this article is provided and calculated by Surf AI. PnL only counts markets settled in H1 2026 and calculates pre-fee realized results based on wallet cash flows in those markets; maker rebates, promotional incentives, and other programmed subsidies are not included in gross PnL. Group labels are behavioral heuristics for comparing trading styles and should not be interpreted as definitive identification of a wallet's actual owner.