Analyst Exposes Bitcoin Market Maker Buy Strategy, Shows What Happens When Accumulation Ends

bitcoinistPublished on 2026-04-18Last updated on 2026-04-18

Abstract

A crypto analyst, Merlijn The Trader, has presented a market structure model suggesting Bitcoin is following an institutional trading cycle. The model outlines four key phases: a "Distribution" phase where large holders sold BTC near highs, a sharp "Flush" that dropped prices 38% to eliminate weak traders, the current "Accumulation" phase where institutions are buying in a tight range between $60k-$77k, and a future "Re-accumulation" period. The analyst projects that once accumulation ends, Bitcoin could break out to new all-time highs, with a potential target above $142,000 by early 2027. Holding above the $70,000 resistance level is critical for this bullish scenario to remain valid.

A crypto analyst has outlined a detailed market structure, suggesting that Bitcoin (BTC) may be entering a decisive stage after months of consolidation and price declines. His strategy maps recent price behavior into a sequence of institutionally driven phases, arguing that the end of accumulation often signals the start of a stronger upward expansion.

The Bitcoin MarketMaker Buy Strategy

Crypto market expert Merlijn The Trader has presented a market structure model on X, showing that Bitcoin’s recent price action is unfolding in line with an institutional trading cycle. The chart framework, known as the MarketMaker Buy Model, argues that large institutional players move markets in predictable stages designed to transfer Bitcoin from emotional retail traders into stronger, long-term holders before pushing prices significantly higher.

According to the analyst, the first stage of the cycle, highlighted in the first green box on the chart, began with a “Distribution” phase that occurred between about $100,000 and $120,000 in mid-2024. During this period, Bitcoin traded in a choppy downward pattern. This type of movement indicated that large holders were selling their Bitcoin amid strong demand from retail traders buying aggressively near the market top.

The second stage identified by Merlijn The Trader is the “Flush,” marked by the red box on the chart. This phase saw a sharp and aggressive price decline designed to force weaker traders out of the market. Here, Bitcoin reportedly fell from $100,000 to $62,000, a roughly 38% drop.
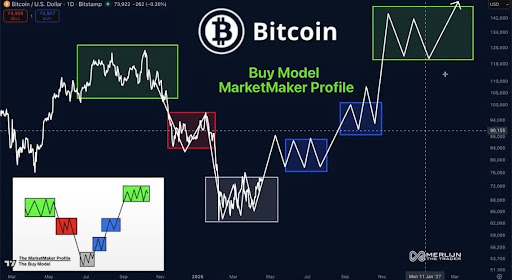
Source: Chart from Merlijn The Trader on X

Following this correction, the MarketMaker model transitions into the “Accumulation” phase, represented by the larger grey box on the chart. According to the model, this is the stage where the market is currently consolidating. Merlijn The Trader places this phase between roughly $60,000 and $77,000.

Within this zone, Bitcoin is trading in a relatively tight and choppy range rather than trending strongly in one direction. The sideways movement during this period also suggests that Bitcoin is building a foundation near a potential price bottom, as institutional buyers gradually accumulate more coins.

In the fourth stage, Merlijn The Trader identifies the two blue boxes on the chart as a “Re-accumulation.” This zone, between approximately $80,000 and $95,000, marks a secondary consolidation period that typically follows a price bottom. This phase provides another opportunity for large investors to strengthen their positions before BTC potentially begins its next upward movement.

What’s Next For BTC After Accumulation

Looking ahead, Merlijn The Trader projects a potential upside target above $142,000 once Bitcoin emerges from its accumulation and re-accumulation phases. In his chart model, the path to this level may involve another short consolidation period before a possible breakout into new all-time highs by January 2027.

The analyst also highlights a key resistance level around $70,000. Holding above this resistance is critical to maintaining the integrity of the MarketMaker model. Meanwhile, falling below the level suggests the structure may not be following the expected path.

BTC trading at $75,550 on the 1D chart | Source: BTCUSDT on Tradingview.com

Related Questions

QWhat is the name of the market structure model presented by the analyst Merlijn The Trader?

AThe MarketMaker Buy Model.

QAccording to the model, what is the purpose of the 'Flush' phase?

AThe 'Flush' phase is a sharp and aggressive price decline designed to force weaker traders out of the market.

QIn which price range is the current 'Accumulation' phase taking place, according to the analyst?

AThe 'Accumulation' phase is taking place between roughly $60,000 and $77,000.

QWhat is the potential upside price target for Bitcoin once it emerges from the accumulation phases?

AThe potential upside price target is above $142,000.

QWhat is the critical resistance level that Bitcoin must hold above to maintain the integrity of the MarketMaker model?

AThe critical resistance level is around $70,000.

Related Reads

Qualcomm Chip Price Hike Deals a Blow to Android Phones

Qualcomm has officially announced a new round of price increases for its entire chip portfolio, effective September 1. The hikes, reaching up to 18% for the flagship Snapdragon 8 Elite Gen 6 Pro, follow similar moves by MediaTek, intensifying cost pressures on the already strained smartphone industry. CEO Cristiano Amon confirmed the plan, citing the need to offset rising industry-wide costs and restore declining profit margins. Qualcomm's Q3 FY2026 results showed a 25% drop in net profit, with mobile revenue plunging 20% year-over-year, hitting its lowest level since 2021. The surge in AI computing demand has led memory manufacturers to prioritize HBM production, creating a shortage in general-purpose DRAM and NAND Flash chips. Their prices soared by 93%-98% and 55%-60% respectively in Q1 2026, causing the memory cost share in smartphones to jump from 10%-15% to over 30%. Coupled with the soaring cost of advanced nodes like TSMC's 2nm and packaging, overall chip costs have reached historic highs. These upstream pressures are forcing downstream smartphone brands like Xiaomi, OPPO, and vivo to cut orders for mid-to-low-end models by up to 20% and use cost-saving measures like older chipsets. Reportedly, the Snapdragon 8E5 will be repurposed as a "long-lasting" chip for sub-brand phones in H2 2026. Amid this cost crisis, the Android market remains sluggish. Q2 2026 smartphone shipments in China fell 4.3% year-over-year, marking five consecutive quarters of decline. Major Android brands saw market share drop, while Huawei and Apple, with their in-house chip advantages, gained share. Qualcomm is diversifying into automotive and IoT sectors to reduce reliance on smartphones, but these new segments cannot yet fill the mobile revenue gap. Industry observers warn that the full impact of component cost hikes will hit in the second half of 2026, likely leading to higher-than-expected price increases for Android flagships and a further contraction in the Chinese smartphone market.

marsbit1h ago

Qualcomm Chip Price Hike Deals a Blow to Android Phones

marsbit1h ago

Trading

Spot
活动图片