Author:Rita
Bitcoin ETP inflows are becoming increasingly concentrated, while overall funds are continuing to flow out. This contrast is defining the current capital landscape of the crypto ETP market.
On September 8, JPMorgan Chase released a report on cryptocurrency market fund flows, pointing out that on September 4 (Friday), US spot Bitcoin ETPs saw a net outflow of $175 million, Ethereum ETPs a net inflow of $9 million, and Solana ETPs a net outflow of $5 million. For the week (ending September 4), the combined net outflow of these three categories was $1.126 billion, showing a slight deceleration compared to the previous two weeks.
Bitcoin fell 2.1% that day, Ethereum fell 2.1% in sync, and Solana fell approximately 3%. The direction of fund flows was largely in sync with price movements, but the concentration of inflows far exceeded market expectations.
Inflows Concentrated in BlackRock and Fidelity
Bitcoin ETP fund flows showed an extremely high concentration. BlackRock's IBIT alone saw a daily inflow of $118 million, while Fidelity's FBTC saw an inflow of $57 million, totaling $175 million. No other US spot Bitcoin ETP products tracked by JPMorgan reported net inflows that day.
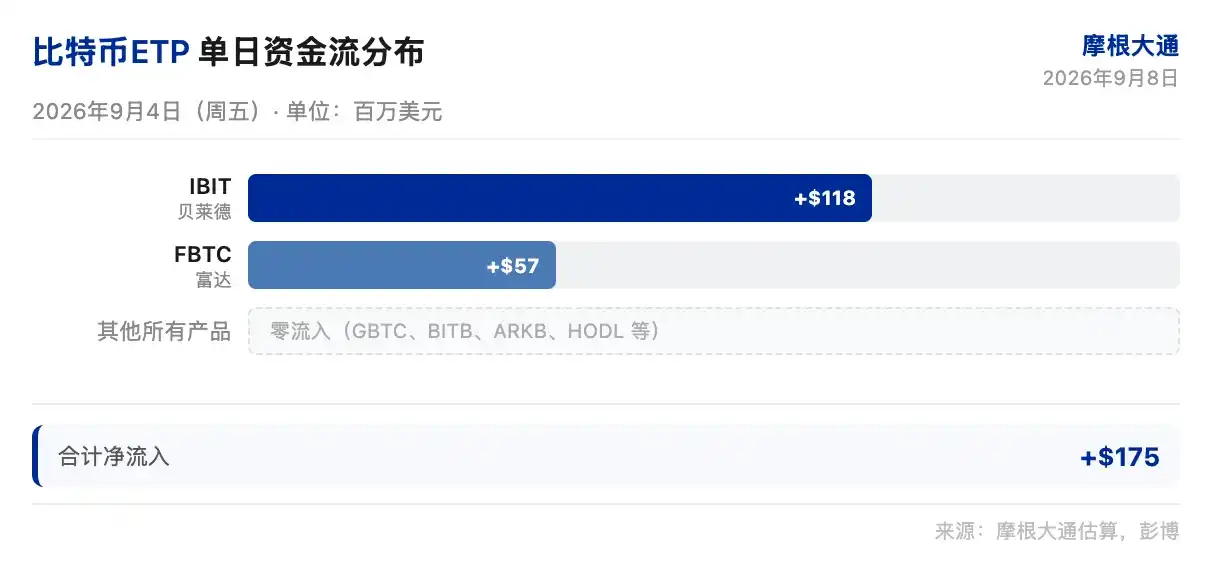
Grayscale's GBTC saw zero inflows that day, and its assets under management have shrunk significantly from historical peaks. Products like ARKB, BITB, and HODL also saw no new funds. This concentration is not new but stands out prominently against the backdrop of overall outflows.
Fee differentials are a significant reason for this concentration. IBIT and FBTC have fee rates of 0.25%, while Grayscale's GBTC has a fee rate as high as 1.50%, six times that of the former. The migration of long-term holders from high-fee products to low-fee products is more pronounced during periods of fund outflows.
The total assets under management for Bitcoin ETPs stood at $101.25 billion after the close on Friday, with a daily notional trading volume of $2.945 billion, essentially flat compared to the average daily volume of $3.229 billion since their launch in January 2024. The lack of an increase in trading volume suggests that fund flows are more driven by adjustments in allocation behavior, with limited impact from short-term trading.
Ethereum ETP Flows Show Internal Hedging
Ethereum ETP flows exhibited a different structure. BlackRock's ETHA saw a net inflow of $58 million that day, while Fidelity's FETH saw a net outflow of $48 million, almost completely offsetting each other. Other products saw zero inflows, resulting in a combined net inflow of only $9 million for Ethereum ETPs.
Total assets under management for Ethereum ETPs were $14.54 billion, with a daily trading volume of $806 million, slightly below the average daily volume of $949 million since their launch in July 2024. Ethereum's price fell 2.1% during Friday's session and was essentially flat at the time of the report's release.
Grayscale's ETHE continued its outflow trend, with cumulative net outflows exceeding $5 billion. Grayscale's Mini Ethereum Trust (ETH) maintained zero inflows. The standoff between BlackRock and Fidelity products indicates divergence among investors regarding Ethereum allocation, with a clear trend of inflows or outflows yet to emerge.
Solana ETPs See Net Outflows
Solana ETPs saw a net outflow of $5 million that day. Bitwise's BSOL accounted for about $3 million of the outflow, and Fidelity's FSOL accounted for $2 million, being the only two contributors. Total assets under management for Solana ETPs stand at $1.351 billion, with a daily trading volume of $64 million, higher than the average daily volume of $48 million since their launch in October 2025.
Solana's price fell approximately 3% that day. The increase in trading volume coincided with the price decline, suggesting some investors chose to reduce their positions amid price weakness. Compared to other categories, the Solana ETP market is smaller, making fund changes in individual products have a more direct impact on the overall flow direction.
Weekly Outflows Show Deceleration Signal
For the week (ending September 4), US spot Bitcoin, Ethereum, and Solana ETPs combined saw a net outflow of $1.126 billion. This figure shows deceleration compared to the previous two weeks but still marks the third consecutive week of net outflows.
JPMorgan's report noted that the US stock market was closed on September 7 (Monday) for Labor Day, with no fund flow data for that day. The fund flow data after trading resumes on September 8 will be a key observation point for judging whether the outflow trend continues.
From a longer-term perspective, Bitcoin ETPs have accumulated net inflows of approximately $58.2 billion, Ethereum ETPs about $12.6 billion, and Solana ETPs about $1.4 billion. Despite the recent continuous outflows, the cumulative net inflow scale remains positive, indicating that most early allocation funds have not yet withdrawn.
Fund Flows Reflect Allocation Pace
The fund flow data for September 4 reveals the core characteristics of the current crypto ETP market: top issuers are absorbing almost all new funds, while other products are being marginalized. This concentration appears in both Bitcoin and Ethereum ETPs.
Weekly outflows of $1.126 billion show deceleration compared to the previous two weeks, but the trend has not reversed. In the absence of clear catalysts, crypto ETP fund flows may continue to exhibit a pattern of "concentration at the top, overall outflow."
It is noteworthy to monitor whether, once outflows decelerate to a certain extent, a signal will appear where top products lead a turn to net inflows. Only if the inflows into BlackRock and Fidelity products can continue to amplify sufficiently to offset outflows from products like Grayscale, might the direction of overall fund flows potentially reverse.

Disclaimer
This article is a compilation and interpretation by Chaoxiang Research of a third-party brokerage research report (JPMorgan Chase, September 8, 2026), combined with a review of publicly available market information. The ratings, price targets, earnings forecasts, and related judgments cited in the article are the views of that brokerage analyst, representing only the stance of their affiliated institution. They do not represent the views of Chaoxiang Research and do not constitute any investment advice.
The market carries risks, and decisions should be made independently. This article should not serve as a basis for buying or selling any securities.