Source: Wall Street News
A clear divergence has emerged on Wall Street following the sharp decline in U.S. tech stocks. Bank of America issued a warning, stating there are "too many danger signals" in the market and advising investors to take profits; while institutions such as Morgan Stanley and Citigroup remain bullish, recommending buying on dips.
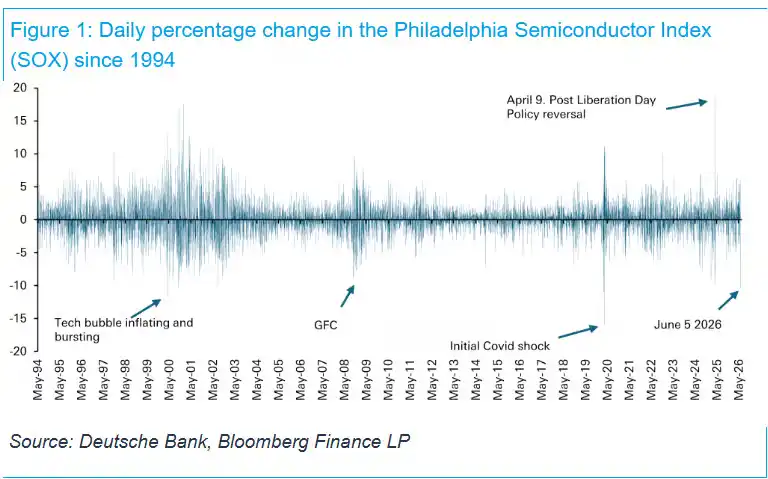
The Philadelphia Semiconductor Index plummeted over 10% last Friday, marking its largest single-day drop since March 2020 and the fourth-largest single-day decline since data records began in 1994. Strong U.S. employment data pushed bond yields higher, increasing market bets on the Fed's next move being a rate hike, further dampening risk appetite. (Related Reading: Seeking Alpha Hot Article: Why U.S. Stocks Might Crash in June?)
Savita Subramanian, Head of U.S. Equity & Quantitative Strategy at Bank of America, promptly released a report, stating "Too many danger signals, take profits," maintaining the year-end target for the S&P 500 at 7,100 points, implying approximately 6% downside from last Friday's close.
Despite this, Morgan Stanley strategist Mike Wilson maintains his forecast for the S&P 500 to reach 8,000 points by year-end, while a team led by Citigroup strategist Scott Chronert raised their year-end target price from 7,700 to 8,100 points. Both institutions cited strong corporate earnings growth and supportive macroeconomic data as their primary arguments.
These two diametrically opposed judgments leave investors facing a directional choice after the tech sell-off: whether to buy the dip or lock in profits before market volatility intensifies.
Bank of America: Bear Market Signals Triggered at 70%, Reaching Historical Peak Levels
The core basis for Bank of America's warning this time is the bank's quantitative signal system tracking bear market precursors. According to Subramanian's report, seven out of the ten monitored indicators have now been triggered — two new in May, five triggered in April, and four in March — reaching a trigger ratio of 70%, comparable to the average level before the seven S&P 500 market tops since 1990.
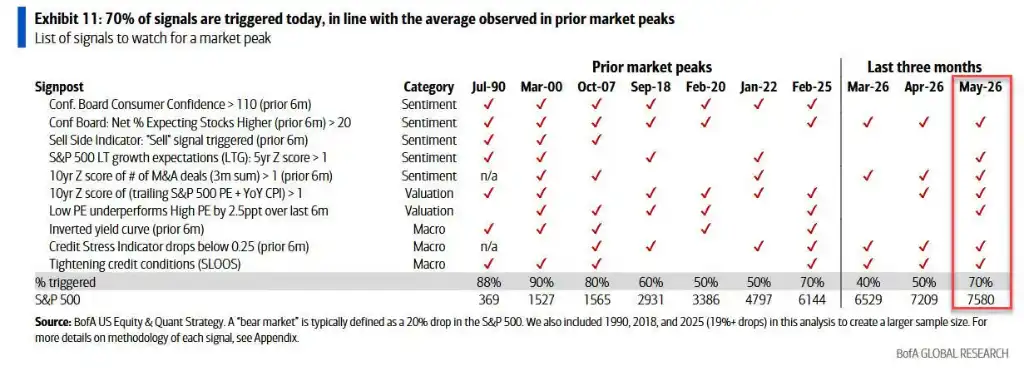
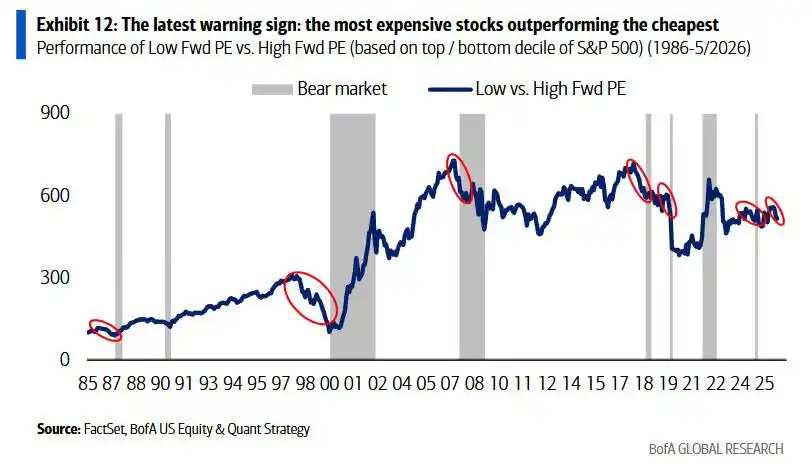
Two of the most recently triggered signals are particularly noteworthy: first, high-P/E stocks significantly outperforming low-P/E stocks, seen as a typical characteristic of excessive market speculation; second, overly high long-term growth expectations, with valuation levels entering a zone where stocks are highly sensitive to earnings disappointments.
Bank of America's sentiment model, the "Sell Side Indicator," has not officially triggered yet, but it showed significant deterioration in May, with market sentiment continuing to trend towards extreme optimism. Meanwhile, the yield curve has not yet inverted, but the spread between 2-year and 10-year Treasury yields has compressed to 39 basis points, its lowest level since the equivalent tariff period.
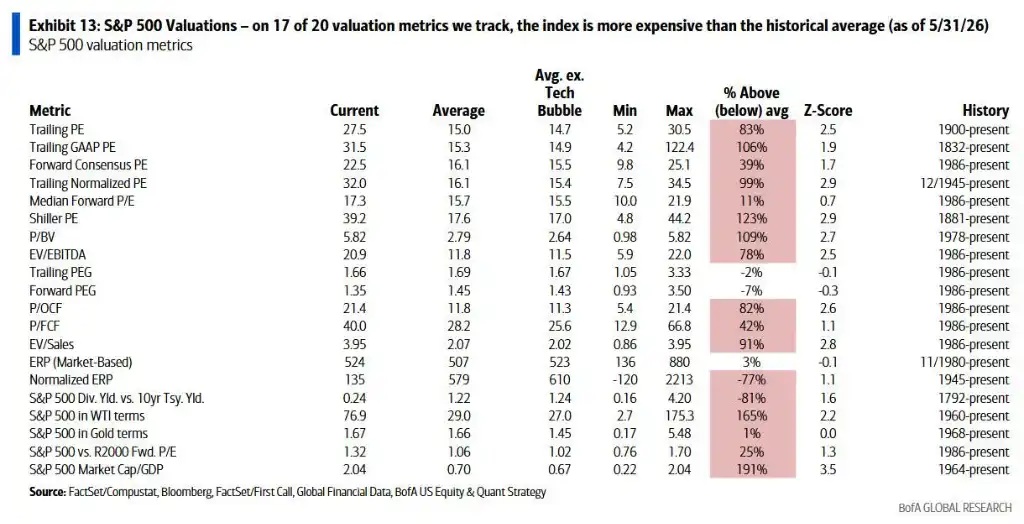
The report also points out that even from a pure valuation perspective, the S&P 500 is above its historical average in 17 out of the 20 metrics tracked by Bank of America, indicating overall index overvaluation risk.
Technology Sector Mirrors February 2000 Internet Bubble Peak
The most impactful assertion in Bank of America's warning is the direct comparison of the current technology sector's trajectory to that of February 2000—approximately one month before the peak of the dot-com bubble.
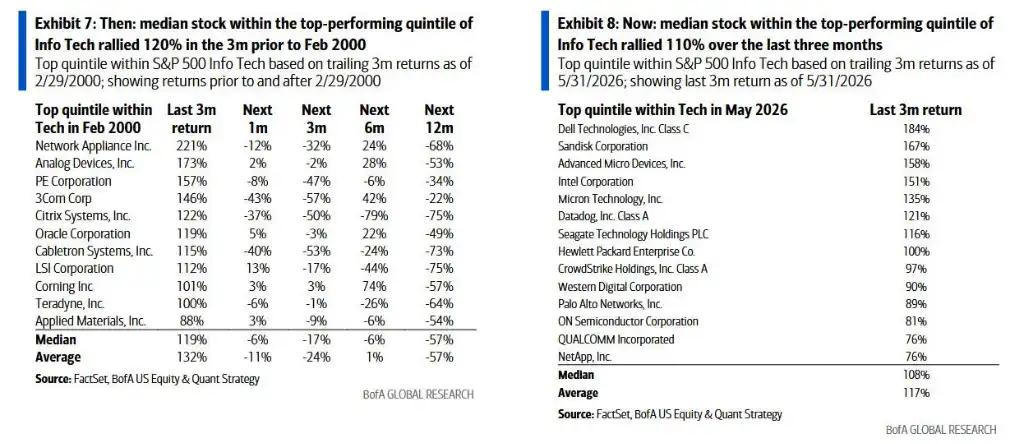
The most crucial metric cited in the report is the degree of internal sector dispersion: the median return gap between the best and worst quintile stocks within the technology sector has currently reached about 120 percentage points, the highest level since February 2000—at that time, this indicator reached about 130 percentage points before the market top on March 24, 2000.
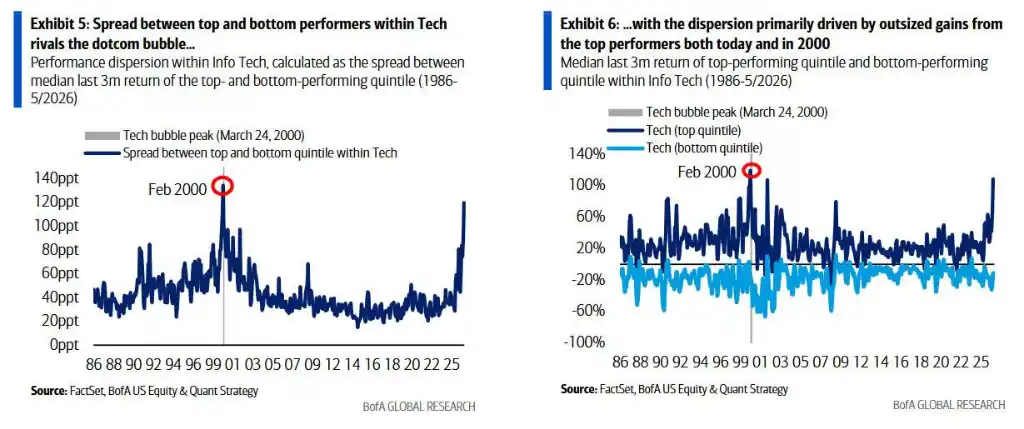
In terms of individual stock gains, within the best-performing quintile of the current tech sector, the median stock has risen about 110% over the past three months; during the internet bubble, similar stocks saw maximum gains of about 120% before the bubble burst.
Bank of America concludes that the current situation shares three highly similar characteristics with February 2000:
The energy sector ranks first in Bank of America's tactical sector model, combining momentum, earnings revisions, and valuation advantages; Information Technology and Communication Services tie for second place, with strong momentum and earnings revisions but elevated valuations; Consumer Staples rank last, identical to February 2000—and this sector performed most resiliently after the tech bubble burst, cumulatively outperforming the index by 73 percentage points from March 2000 to October 2002 when the S&P 500 bottomed.
Morgan Stanley, Citigroup Maintain Bullish Stance: Earnings Revision Breadth Hits Cycle High
Regarding the same market volatility, Morgan Stanley's Mike Wilson reached a completely different conclusion. In a research report released on Monday, he noted that the rapid rally of the S&P 500 from its March lows was inherently unsustainable, and this correction is "inevitable and ultimately beneficial for the bull market to extend through year-end."
Wilson attributes the core basis for his bullishness to earnings revision breadth: the S&P 500's earnings revision breadth has now reached 26%, a new high for this cycle.
On the macro front, the ISM Manufacturing PMI rose to 54 last week, the highest since 2022; the three-month average of private sector payroll growth improved to 166,000, the strongest since 2023. He believes that after the normalization of crowded semiconductor and memory stock holdings, cyclical sectors such as Consumer Discretionary, Transportation, and Regional Banks are expected to take over leadership.
Citigroup's Scott Chronert raised the S&P 500 year-end target from 7,700 to 8,100 points, citing a "significant jump in earnings expectations," implying 9.7% upside from last Friday's close.
Bank of America Acknowledges Tech Fundamentals Stronger Than Dot-Com Era, But Deterioration Trends Emerging
Bank of America does not completely negate the current fundamentals of the tech industry. The report points out that on multiple metrics including leverage, valuation, and capital intensity, the current health of the tech industry is superior to that during the dot-com bubble era.
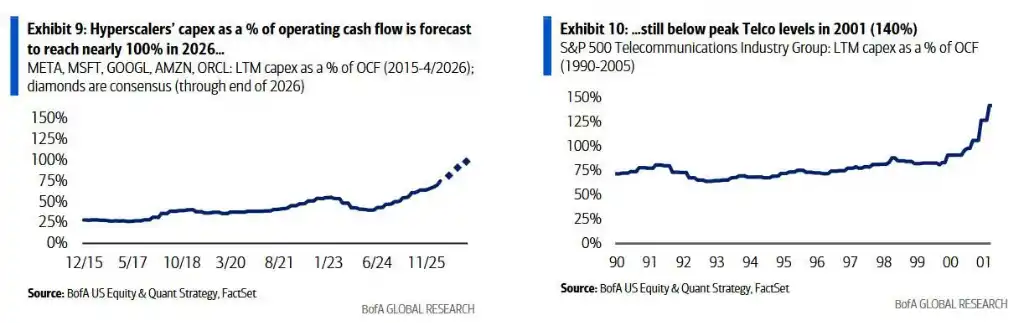
However, the report also documents several deteriorating trends emerging since the beginning of the year: cash flow conversion rates have plateaued, investment-grade bond and equity supply have increased, and the proportion of buybacks to market capitalization has slowed; the ratio of capital expenditure to operating cash flow for hyperscale cloud computing companies is expected to approach 100% by year-end, a significant increase from 40% in 2023. Although this figure remains below the 140% seen at the peak of the telecommunications industry in 2001, the pace of increase has drawn attention.
Subramanian wrote in the report that while the S&P 500 is up about 11% year-to-date, the market's overall gains have been primarily driven by earnings revisions, and the overall valuation multiple has actually compressed slightly from 22x forward P/E at the start of the year to 21x.
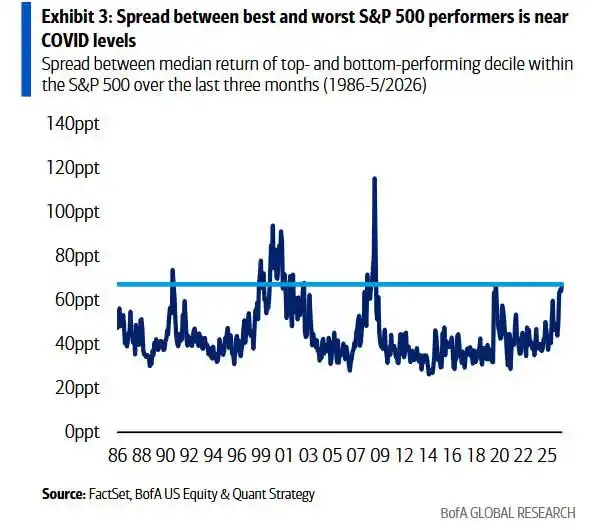
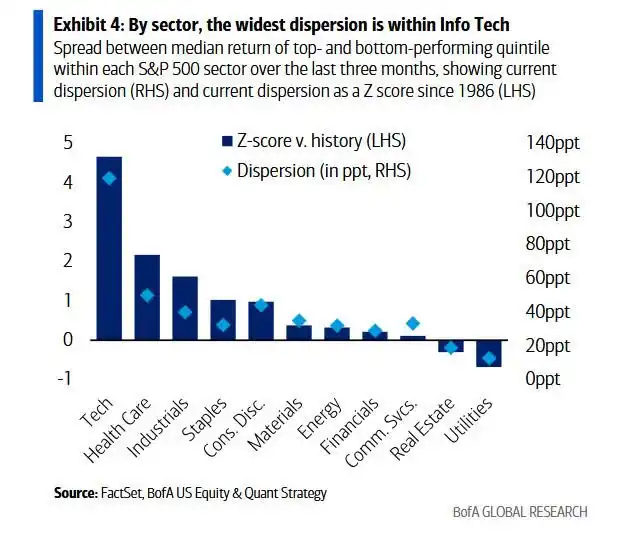
At the same time, sectors like Financials, Healthcare, and Consumer Discretionary have recorded negative returns year-to-date. The strong performance at the index level masks the fact that internal return dispersion has continued to climb to its highest level since the pandemic.