Original article by Frederik Theissen, Glassnode
Compiled | Express Messenger @Odaily Planet Daily
Key Points:
- Bitcoin rose 23% in 21 trading days while equities were flat, but it's still down 10% year-to-date.
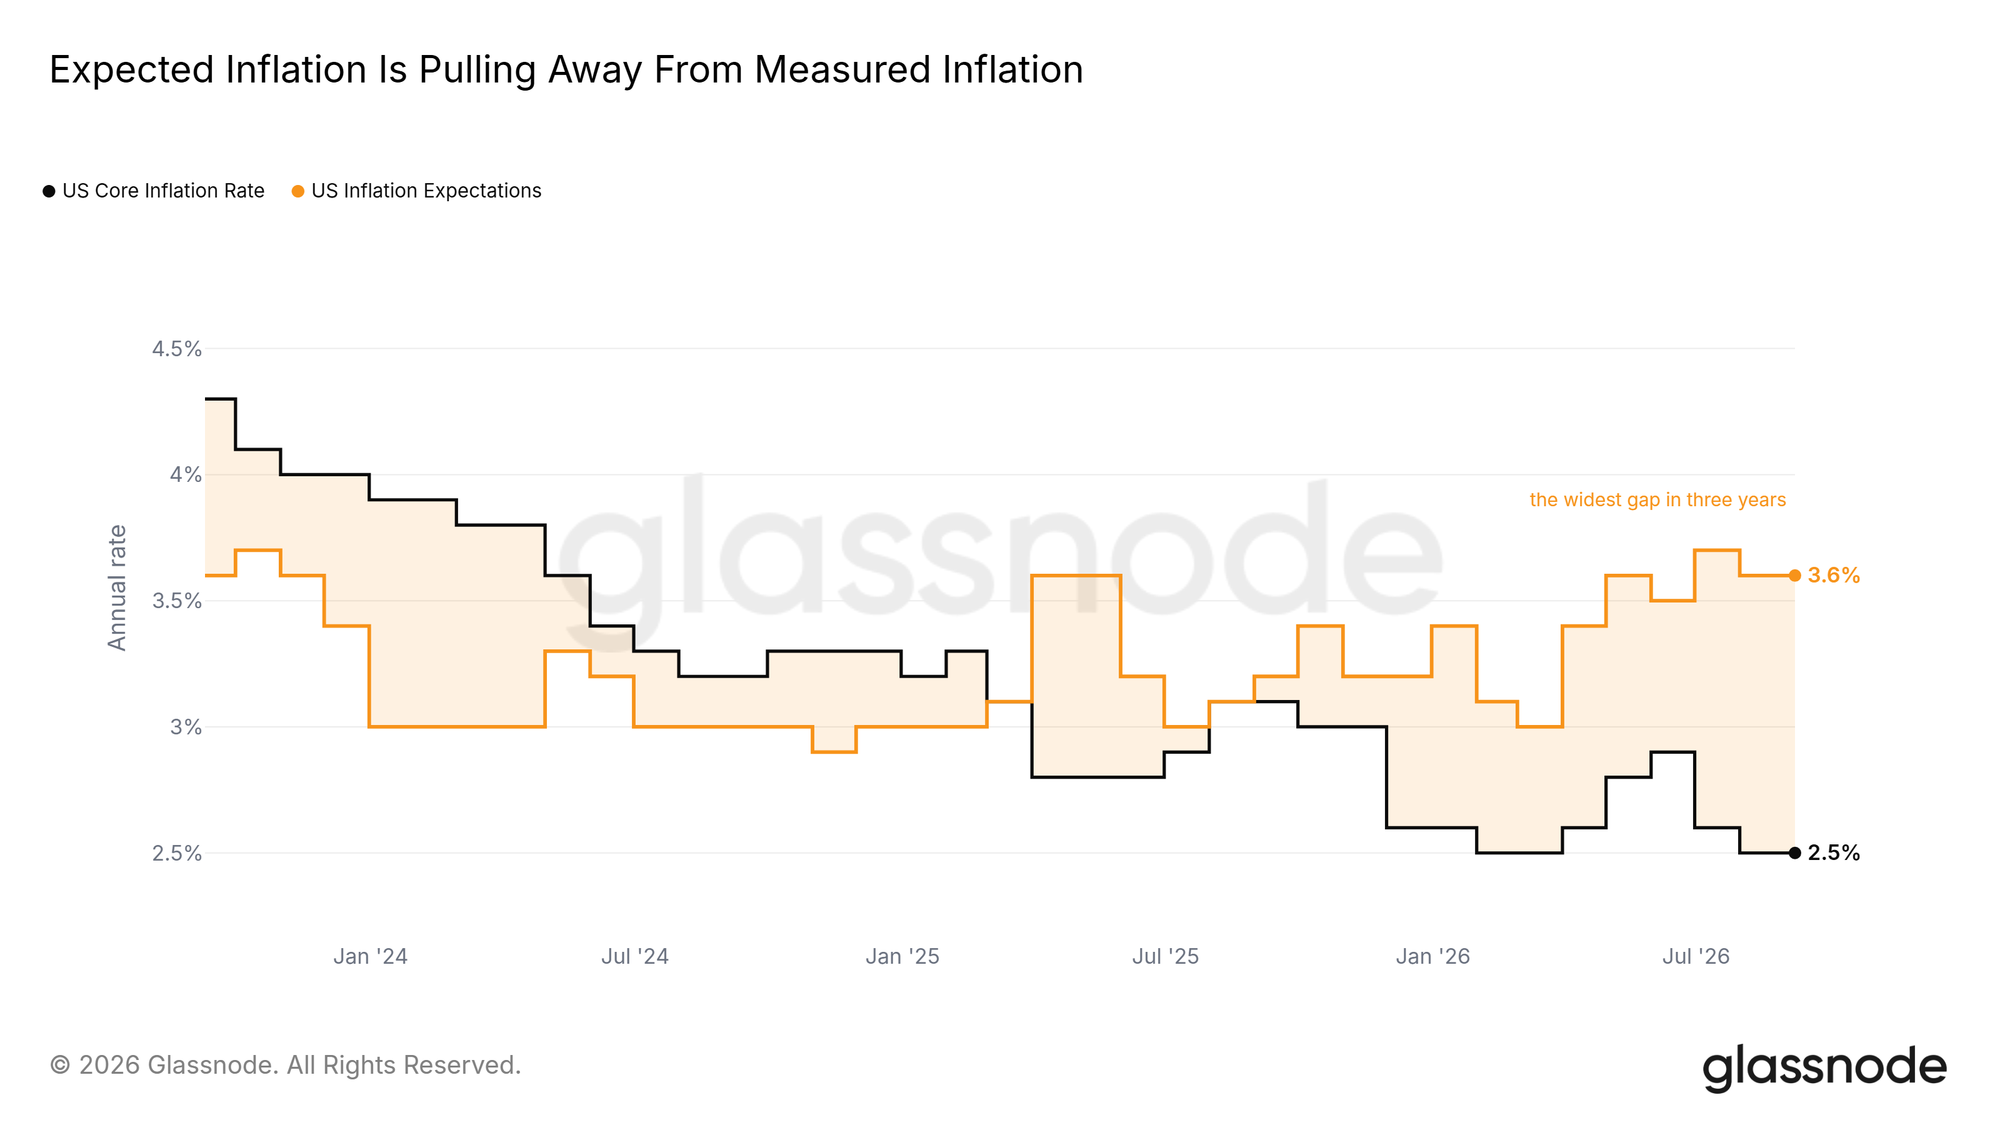
- Core inflation has dropped to a two-year low of 2.5%, while inflation expectations sit at 3.6%, the widest gap in three years.
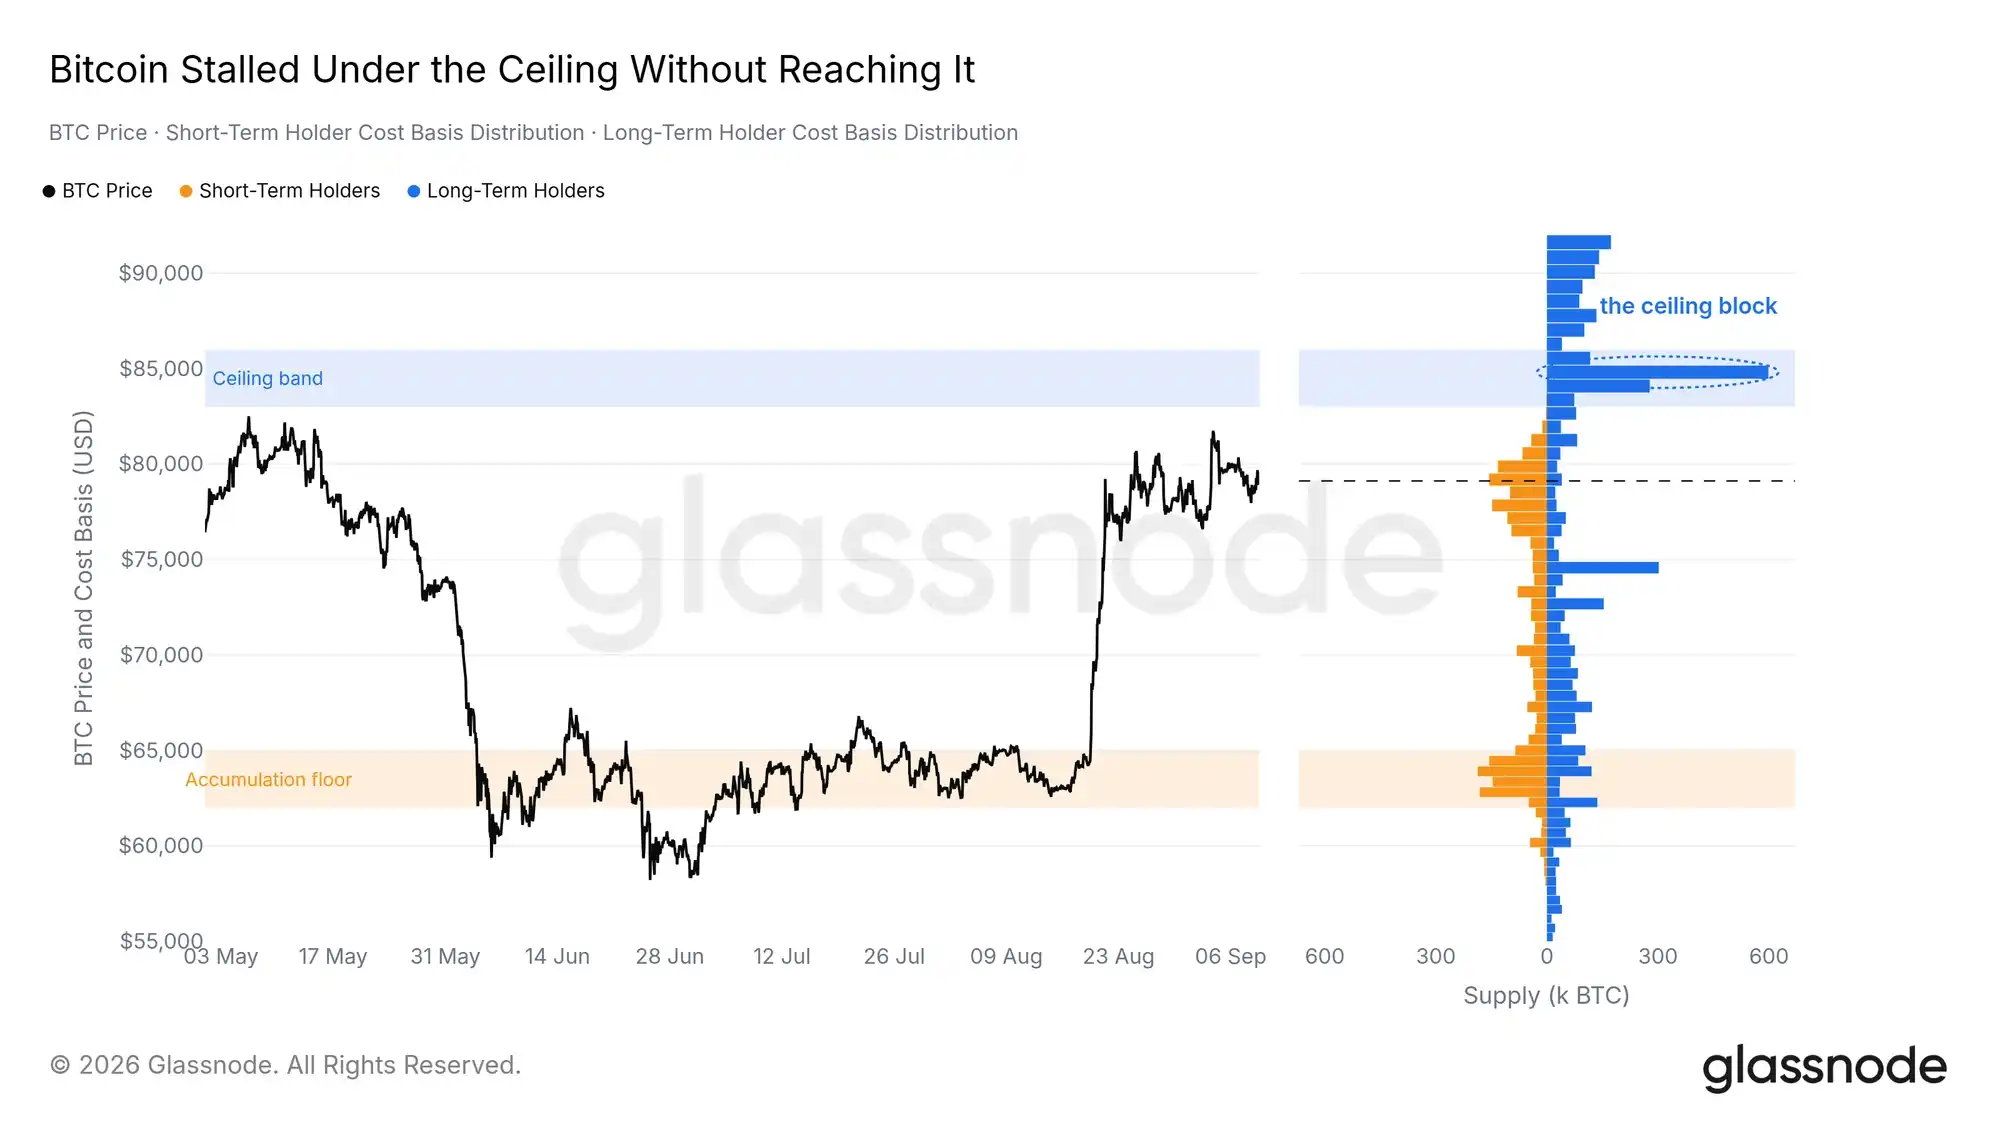
- The Long-Term Holder cost basis, liquidation map, and ETF breakeven all point to a ceiling at $83,000 to $86,000; spot price stalled 1.5% shy of that range.
- The pace of selling into the range high is less than half of August's, with long-term holders not participating this round.
- The strong resonance of bottom signals has faded after months; altcoins are not taking share from Bitcoin as they did prior to previous tops.
A Late Start to the Year, Narrowing the Gap from the Bottom
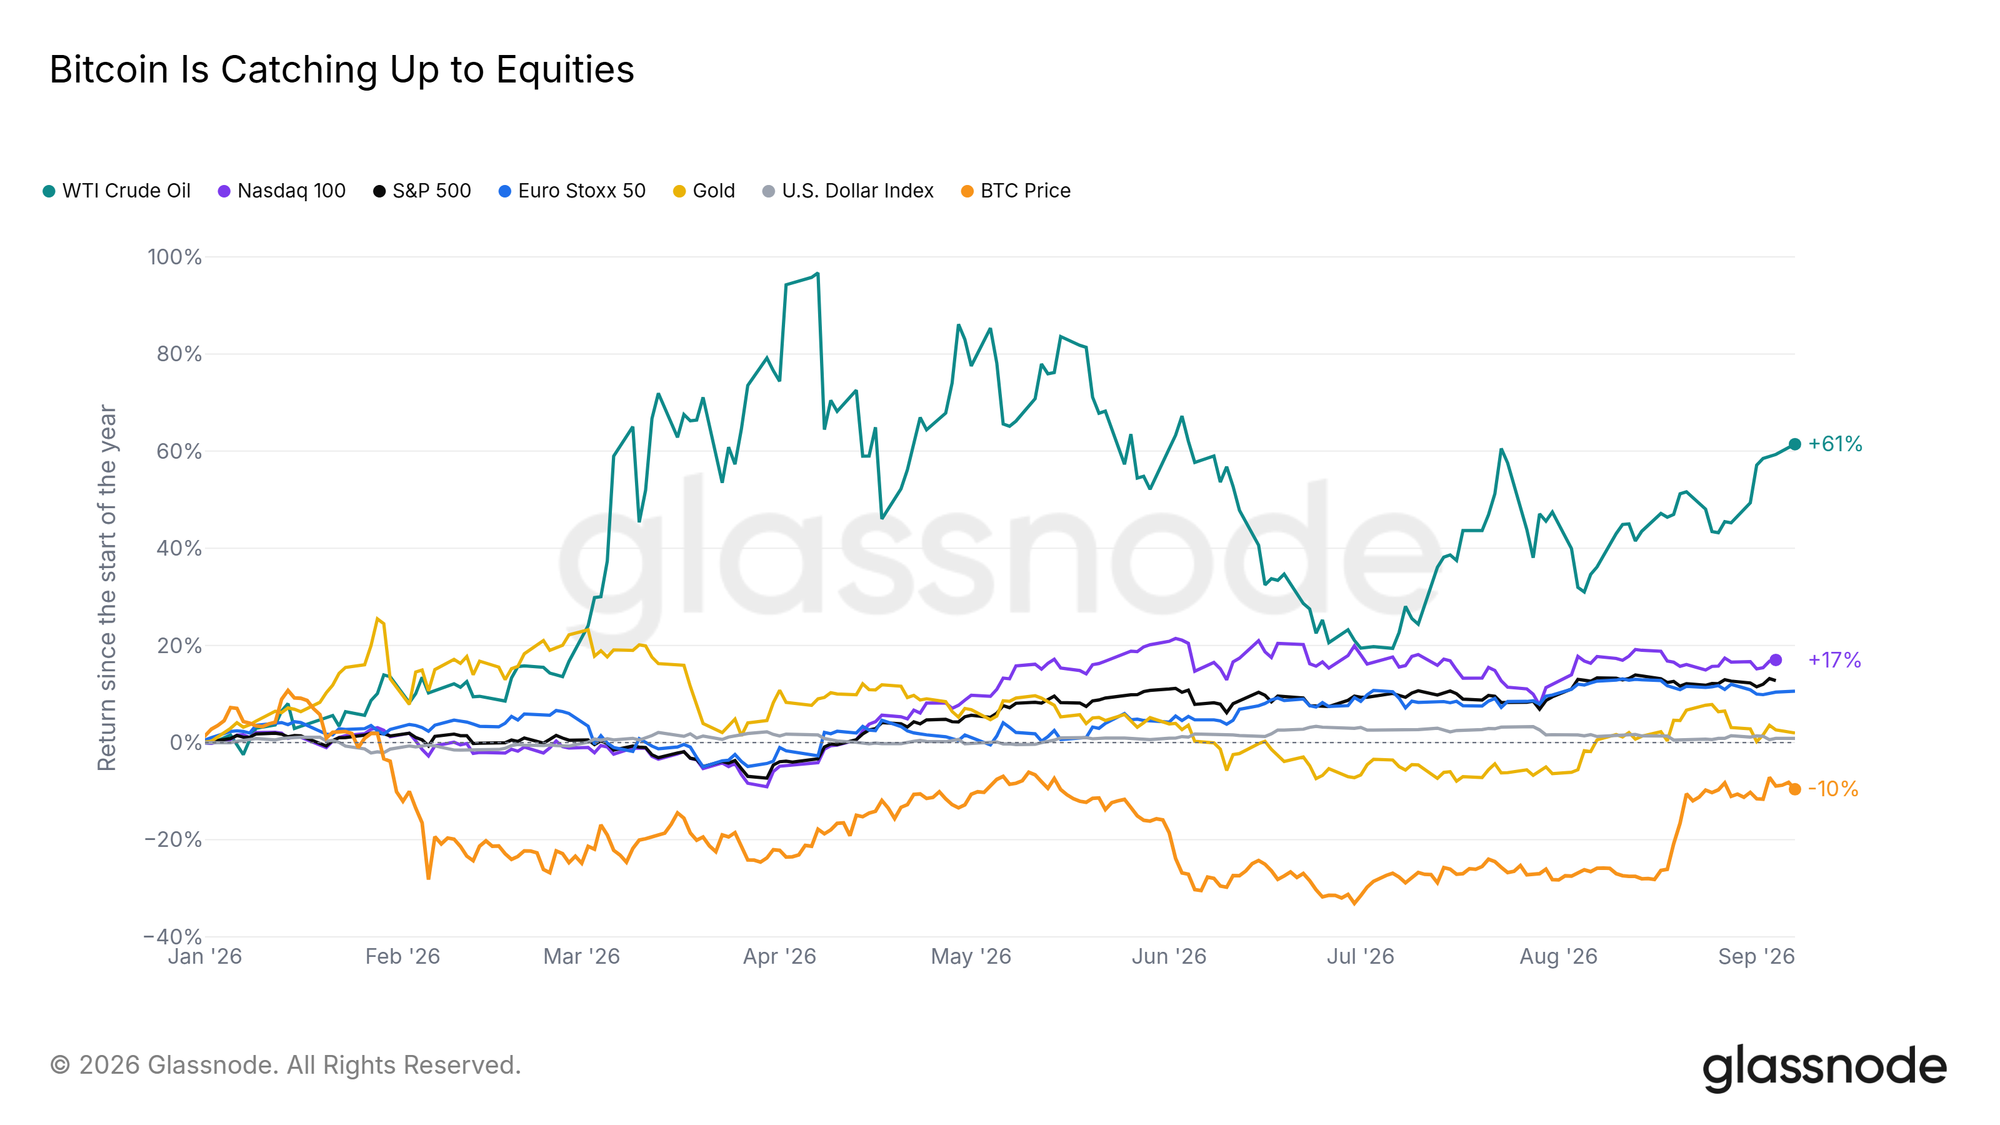
Over the past 21 trading days, Bitcoin returned 23%, while the S&P 500 and Nasdaq 100 were flat and the Euro Stoxx 50 declined. Within this window, Bitcoin ranked first among the seven asset classes we track. Looking at year-to-date performance, the opposite is true: Bitcoin is still down 10% since January, while the S&P 500 is up 13%, and the year's top performer, crude oil, is far ahead of both.
Bitcoin spent the entire summer at the bottom of the rankings and is only now starting to close the gap. A month of relative strength has only repaired a small portion of the losses from the first half of the year.
Expectations Running Ahead of Data
Bitcoin is rebounding into a bond market that remains restrictive. The US 10-year Treasury yield closed at 4.8%, matching its two-year high, while the 2-year yield is about 63 basis points above the 3.75% Fed funds target rate—this is the bond market's way of leaning toward tighter policy.
The actual inflation data does not support this inclination. US core inflation has dropped to 2.5%, a two-year low, while US inflation expectations are at 3.6%. The gap between household expectations and the actual reported data is the widest in three years. Yields are at cycle highs while core inflation data is cooling, making rate hikes difficult to justify; the August CPI release on September 11, 2026, and the FOMC decision on September 16, 2026, will directly test this. If core data moves back toward expectations, the case for tight policy strengthens; if core data remains low, then the move in yields has already run ahead of the data.
Viewing the Ceiling from Every Angle
Stalling Under the Wall
Last week's report placed the overhead ceiling between $83,000 and $86,000. The current rally tested this but did not reach the range. On September 3, 2026, spot made a higher high than August but stalled 1.5% shy of the bottom of that range, subsequently stabilizing in a narrow band just below $80,000.
The Long-Term Holder Cost Basis Distribution shows why this range is important. Approximately 1.07 million BTC were acquired between $83,000 and $86,000, almost entirely by long-term holders, with the single heaviest price bucket around $85,000. This block has barely moved in thirty days. The change happened below it: supply acquired between $76,000 and $82,000 (mainly recent buyers) grew, while the accumulation floor between $62,000 and $65,000 thinned as coins bought there rotated. The market rebuilt a floor directly below spot while leaving the overhead ceiling intact.
The Same Wall on the Liquidation Map
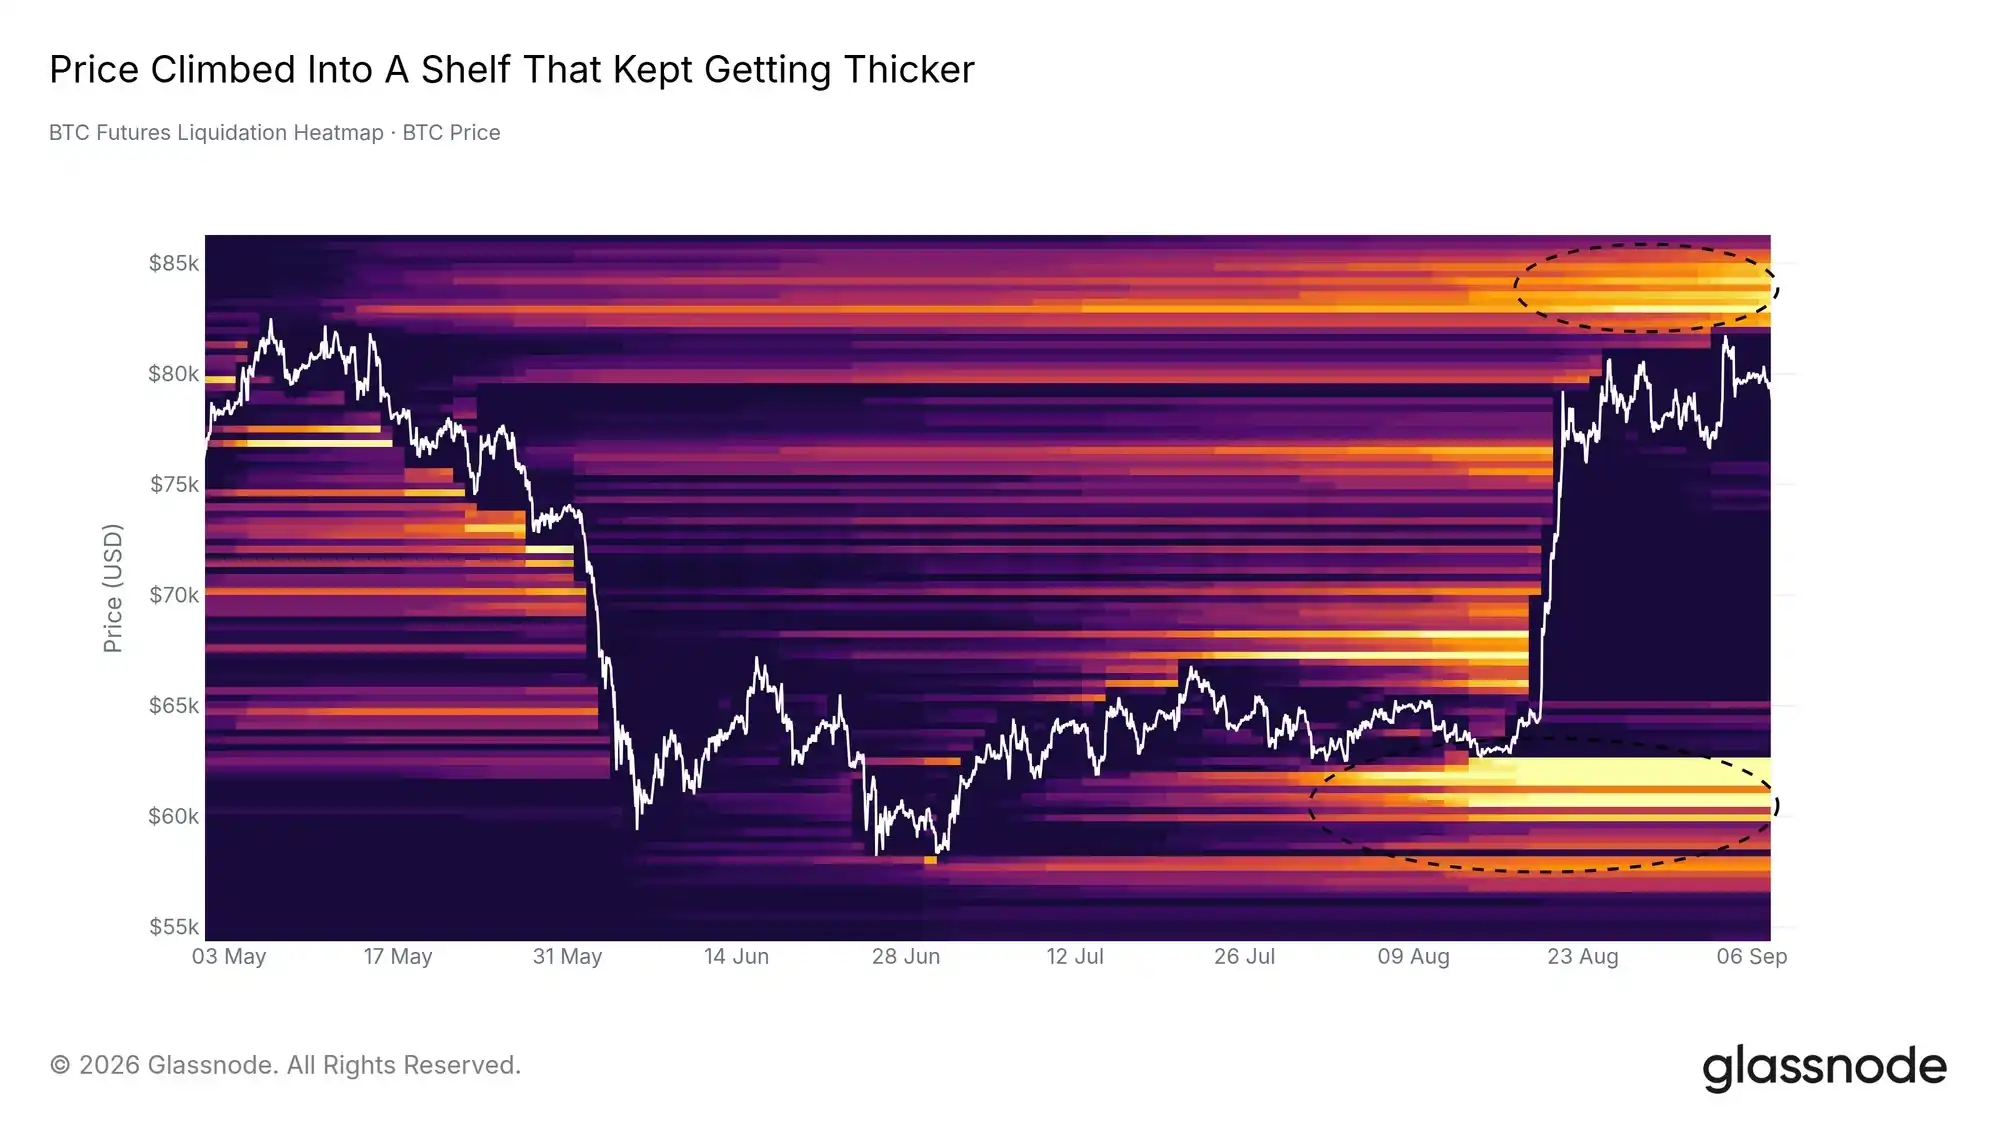
The derivatives market also draws the ceiling at the same level. On the BTC Futures Liquidation Heatmap, the wall of short liquidation levels between $82,000 and $86,000 has grown 21% since the short squeeze on August 19, 2026, while the entire map has shrunk by a third. This wall now carries a share of modeled liquidations nearing the highest level in the map's history.
Price is climbing into a wall that keeps thickening and stalled before reaching it. Below spot, the long liquidation cluster between $60,000 and $63,000 remains intact, framing the range from below. A sustained break above $86,000 would consume the densest fuel of short liquidations on the map; a break below $63,000 would start to chew through the long side.
Institutional Breakeven Just Slightly Above
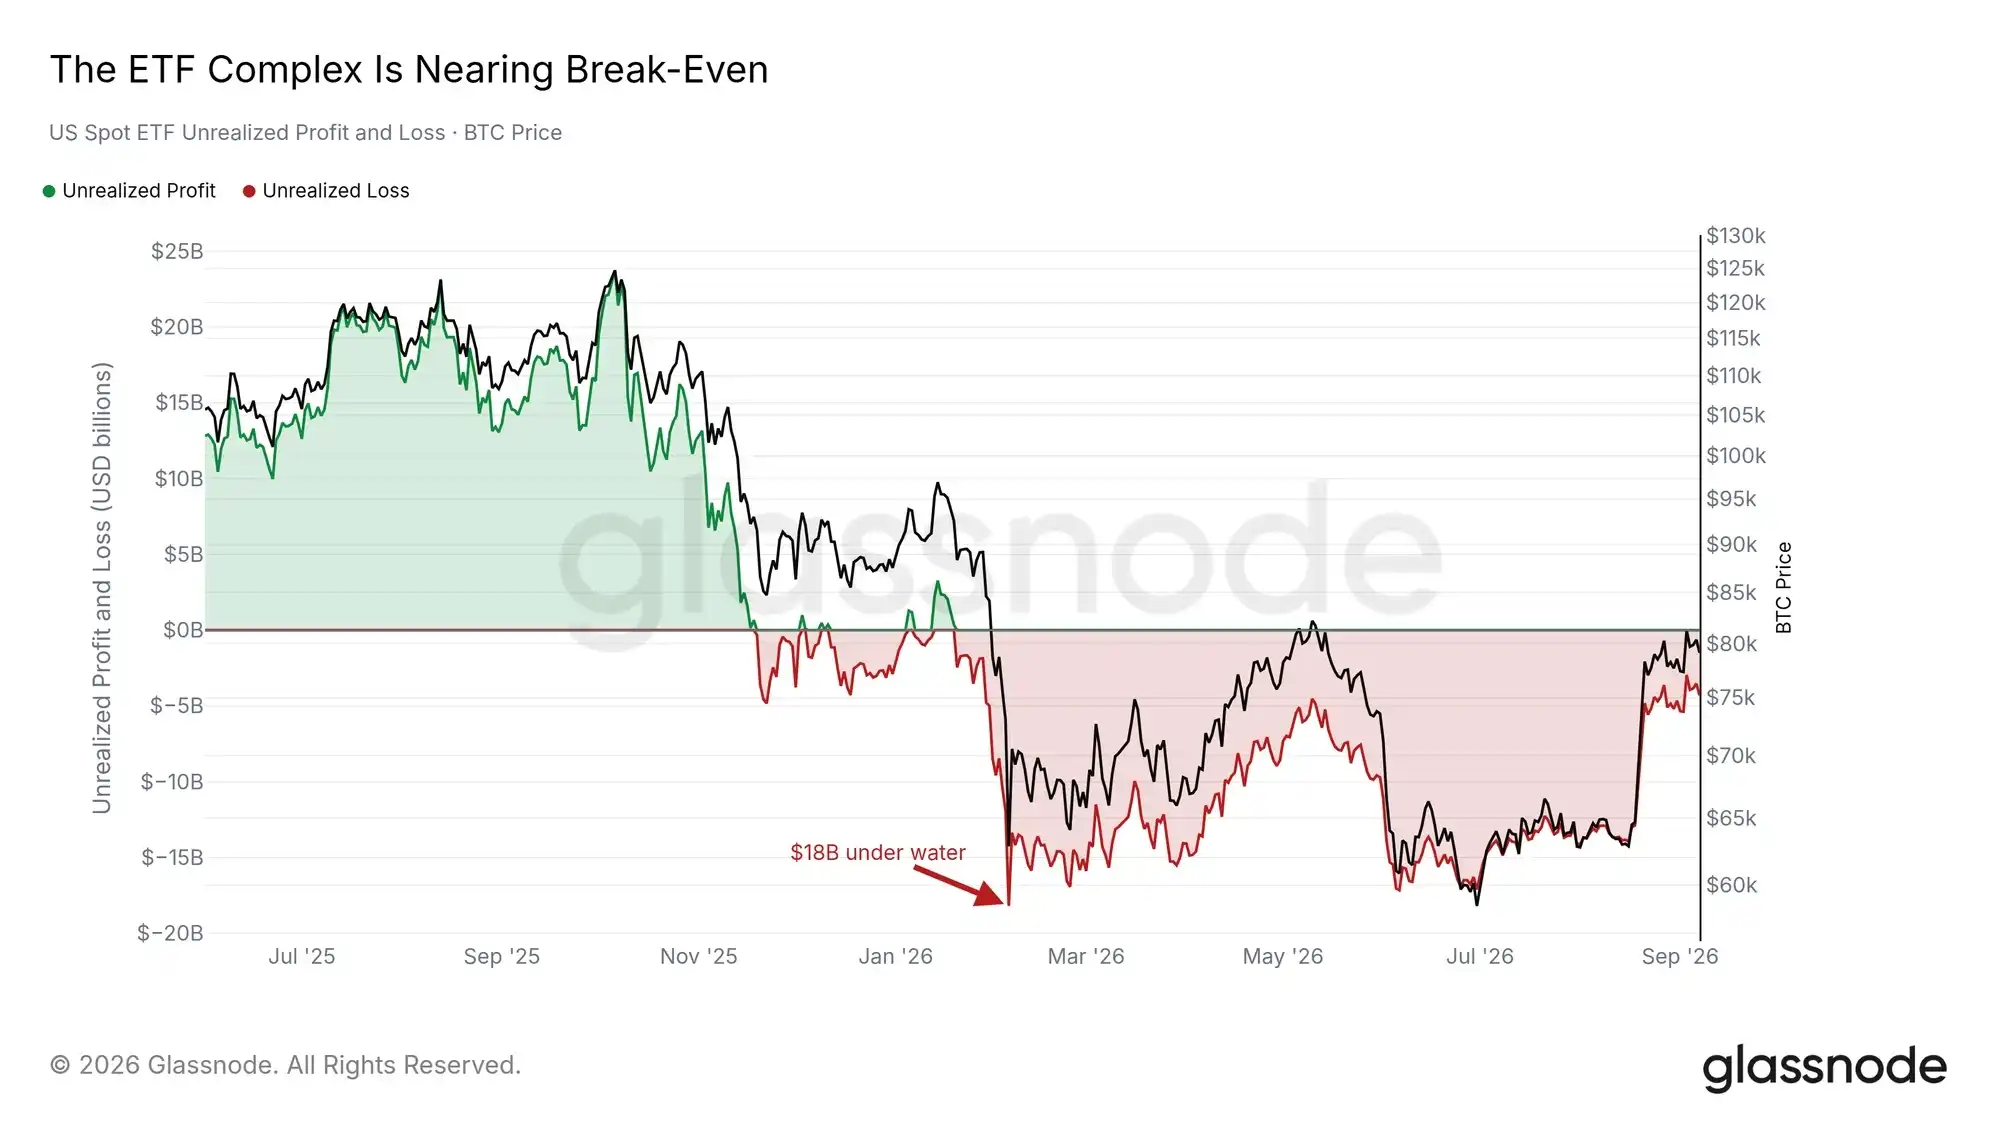
A third independent source also lands at the same level. The US spot ETF complex, measured by the coins created since its launch, has a breakeven point near $86,000. It has closed below that level for 228 consecutive trading days, with its paper loss bottoming at around $18 billion on February 5, 2026. This rally has narrowed that loss to about $3.9 billion, bringing the complex closest to breakeven since January.
Corporate treasuries' breakeven is near $80,500, slightly below spot. Among our tracked cost basis models, five are above the current price, ranging from the True Market Mean at $76,600 to the ETF breakeven at $86,000. Overhead resistance is a cluster of real cost bases, and reclaiming $86,000 would put the largest institutional holders back in profit for the first time this year.
Sellers Are Not Showing Up
Selling Dwindles on the Run Toward Highs
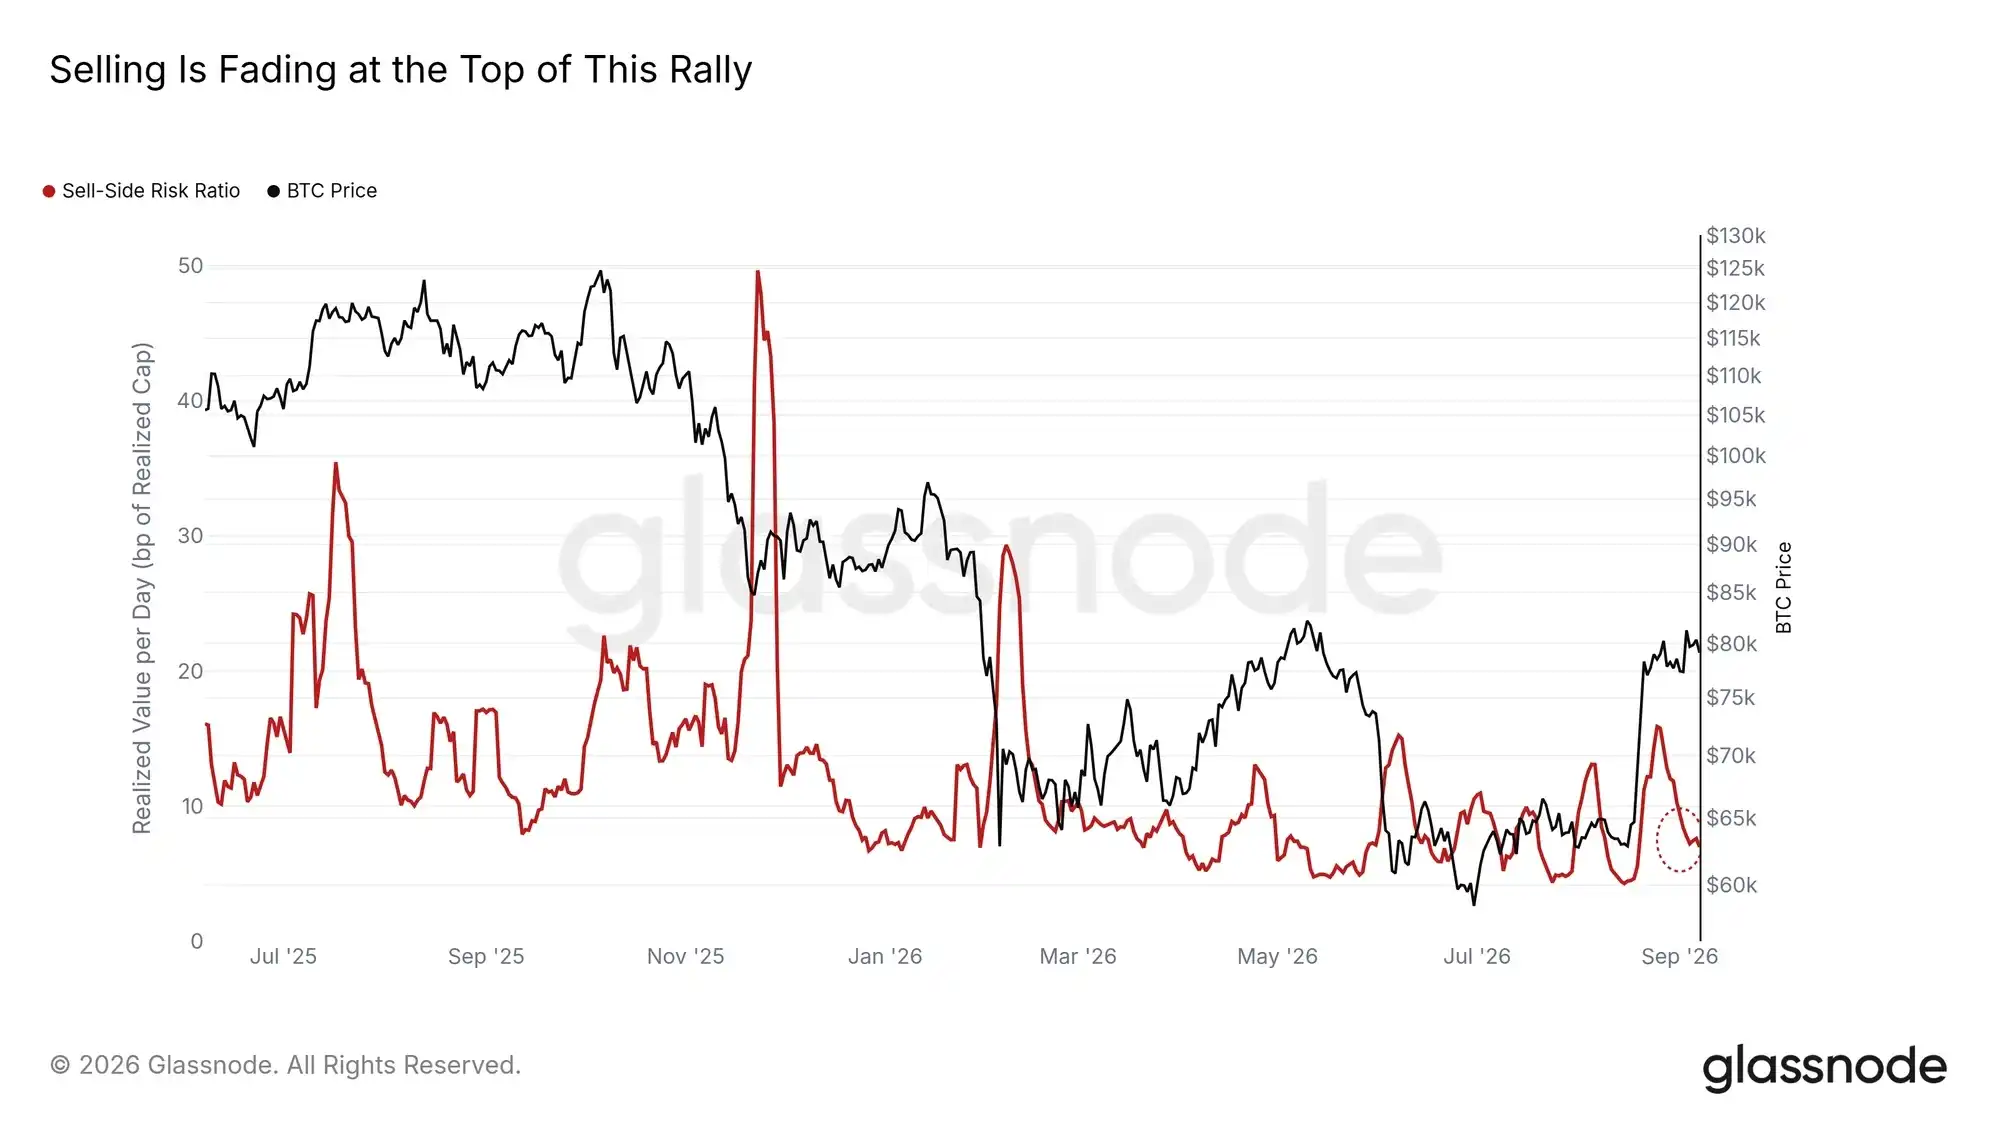
The push toward the ceiling has not drawn out much supply. The Sell-Side Risk Ratio (realized profit plus realized loss, measured relative to Realized Cap) on a seven-day basis has fallen to 7 basis points per day, less than half of August's peak of 16 bps. At the July 2025 and October 2025 highs, the same metric spiked to 35 and 23 bps, respectively. Only a handful of days in the past year have had readings lower than today.
Long-Term Holders' share of realized profit has dropped from 88% at the August peak to 47%, and the September realized profit peak on September 3, 2026, was less than half the size of August's. This month's sellers are recent buyers, and even they are selling less. If this metric sustainably returns above 16 bps, it would signal sellers of August's magnitude are back; until then, the spot market is short of sellers at these prices.
Between Bottom and Top
Bottom Signals Have Served Their Purpose
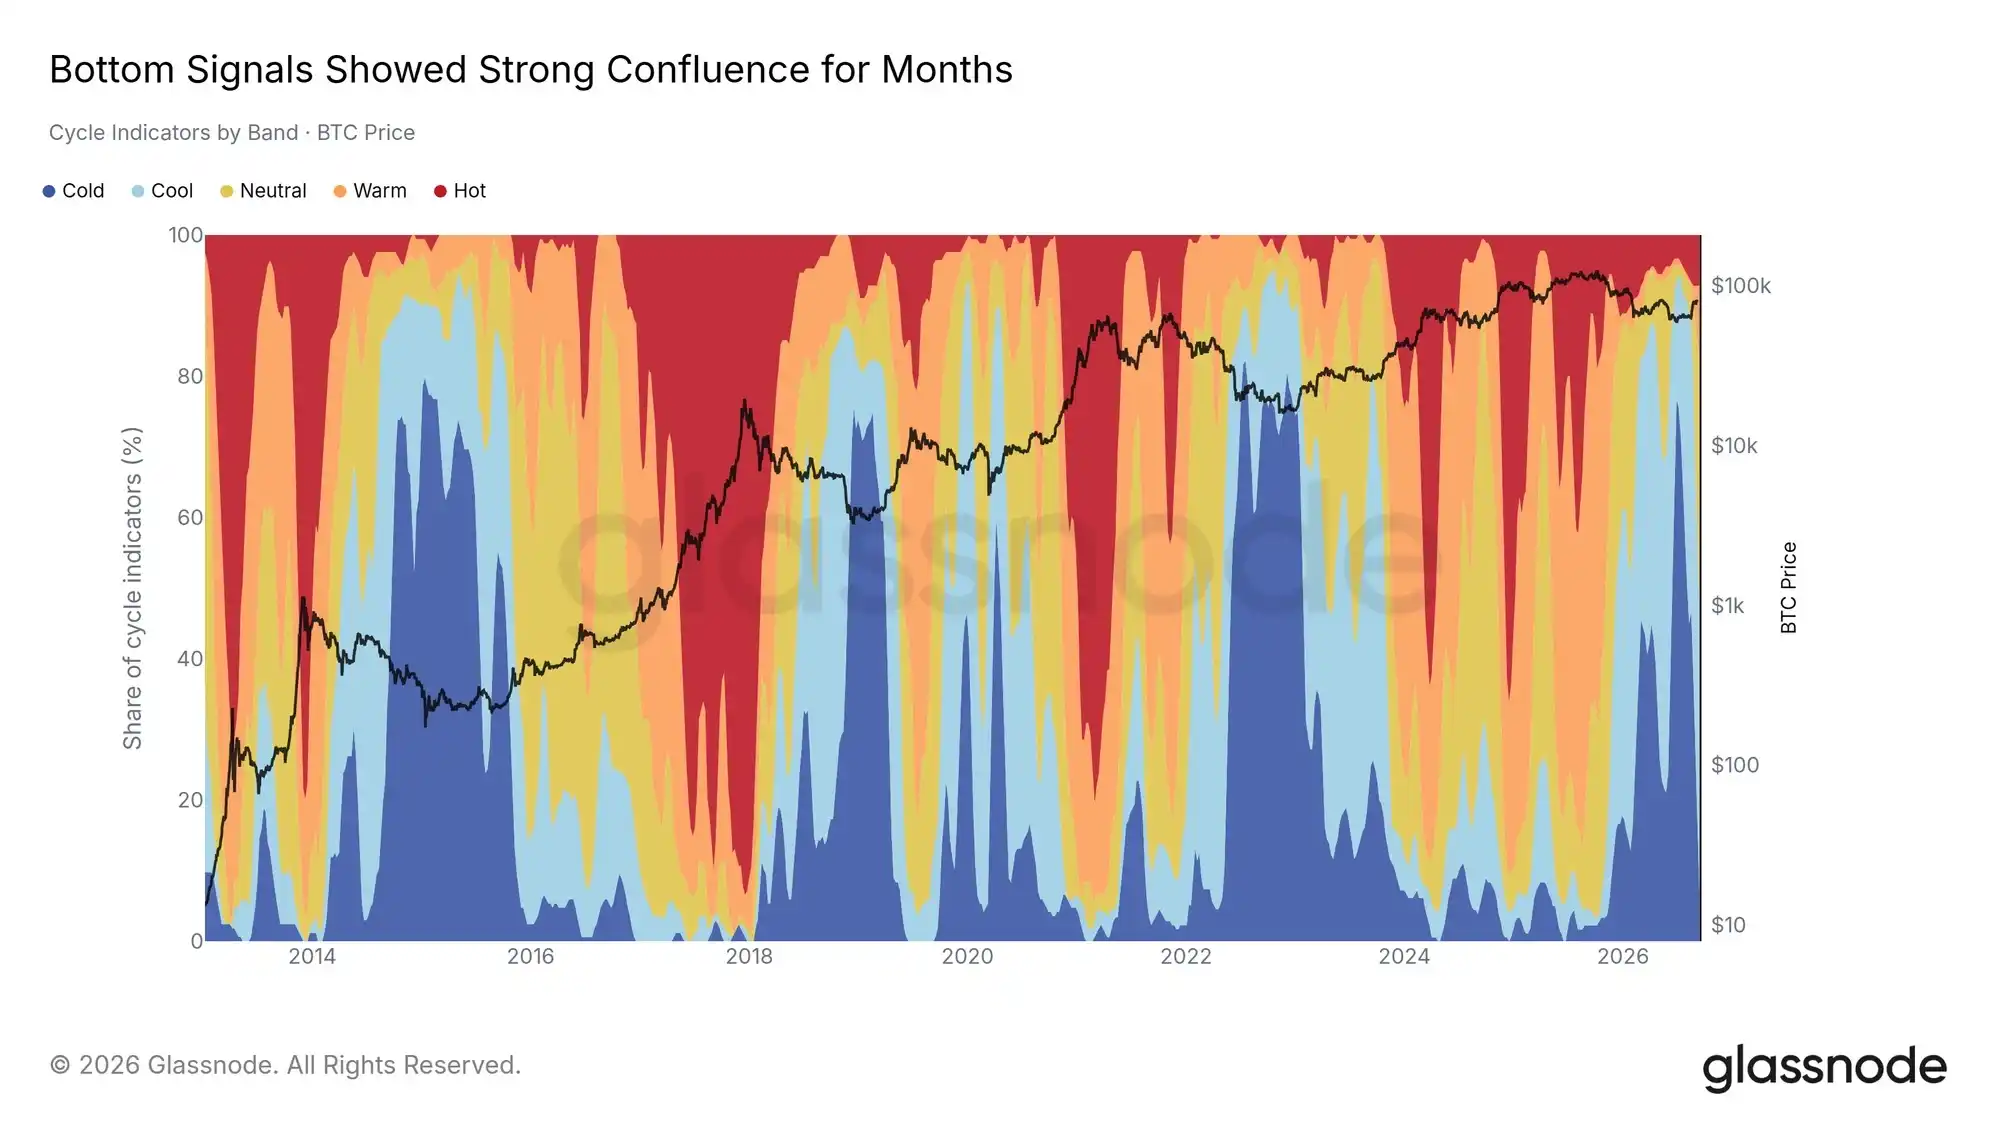
Among the 45 cycle indicators in the Market Compass panel, the share in the coldest zone peaked at 82% the week of June 29, 2026, and spent 41 consecutive weeks above its long-term median. This was the strongest resonance of bottom signals produced in this cycle. That signal has now faded: as the rally repaired valuations, the cold share dropped to 2% in the most recent complete week.
The panel has not swung to the other extreme. Three-quarters of indicators are still below the midpoint of their own history, and it has been 43 weeks since a majority were above 50. The interpretation: the market has left the value zone but is not yet expensive. A majority of indicators breaking above 50 would be the clearest confirmation the cycle position has shifted.
No Mass Rush into Altcoins
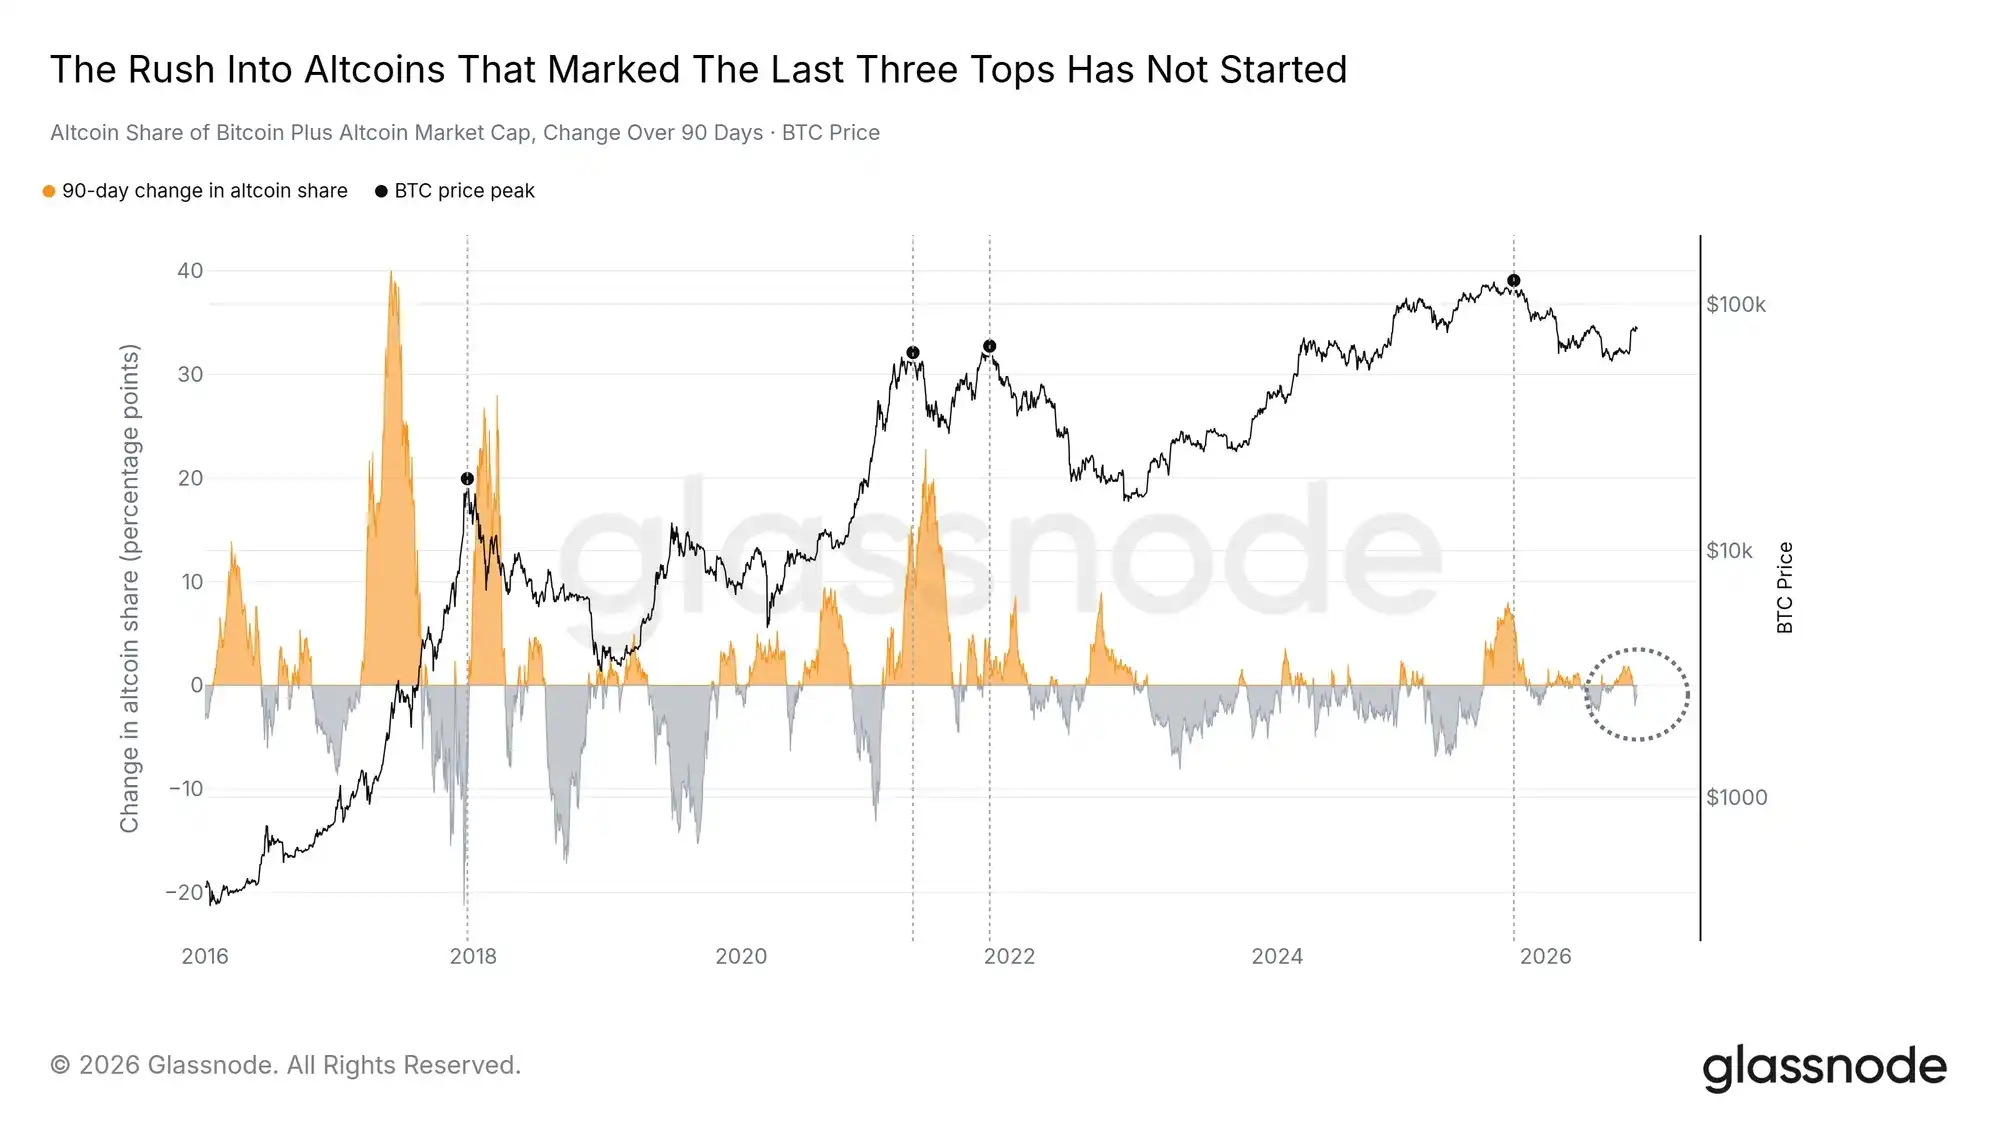
Many altcoins are rallying, with Altcoin Market Cap up 21% this month. This metric examines whether this move is oversized relative to the entire crypto market: whether altcoins are taking share from Bitcoin at the pace seen before previous tops. At four of the labeled Bitcoin price peaks, the share of altcoins in the combined Bitcoin + altcoin market cap surged in the 90 days before the peak, rising at least 2.8 percentage points; the December 2017 peak was the exception. Today, the 90-day change in Altcoin Share is negative, reading -0.9 percentage points.
Altcoins are rising in dollar terms but not outperforming Bitcoin; the entire ladder is moving as a block, with the largest-cap coins leading. The massive rotation signaling a mature top—capital cascading down the risk curve faster than Bitcoin's own market cap grows—has not yet begun. If the altcoin share rises 2.8 percentage points or more over 90 days while Bitcoin is near its all-time highs, it would be a warning based on precedent; today, neither condition is met.
Conclusion
Bitcoin is consolidating below a ceiling that three independent sources agree on: the Long-Term Holder cost basis, the liquidation map, and the ETF breakeven point, all between $83,000 and $86,000. The current state is a range with a repaired floor and an untested ceiling. The difference from the August attempt is the absence of sellers: sell-side pressure is less than half of August's, long-term holders are stepping back, and overhead derivatives fuel is thickening. A sustained close above $86,000 with a still-subdued Sell-Side Risk Ratio would confirm the ceiling is being absorbed; a return of selling with the metric breaking above 16 bps, or a break below the $62,000 to $65,000 floor, would invalidate this.
On-chain metrics, price, and derivatives data as of September 7, 2026; ETF flows as of September 4, 2026; Market Compass panel as of the week ending September 7, 2026; recent daily data points may still be revised.
Disclaimer: This report does not provide any investment advice. All data is for informational and educational purposes only. No investment decision should be made based on the information provided herein, and you are solely responsible for your own investment decisions.
The exchange balances presented are derived from Glassnode's comprehensive address labeling database, which aggregates information from official exchange disclosures and proprietary clustering algorithms. While we strive to present exchange balances as accurately as possible, please note that these figures may not always encompass the full extent of exchange reserves, particularly when exchanges do not disclose their official addresses. We urge users to exercise caution and judgment when using these metrics. Glassnode assumes no responsibility for any discrepancies or potential inaccuracies.