[Explosive data] Contract positions reached $39.2 billion, BTC funding rates as low as below 0

Huobi ResearchPublished on 2022-03-24Last updated on 2022-03-29

Abstract

BTC, Eth and other mainstream currencies rebounded in the short term.

This column combs the trading status of the spot market and futures market within the day, and analyzes the trading performance of BTC and the overall market. Help investors tap effective trading signals.

Market view

BTC, Eth and other mainstream currencies rebounded in the short term. On the brin online track, the price performance was relatively strong, and further change signals appeared at any time. The current trend is favorable for bulls, and the contract position has reached a recent high, indicating that the willingness to do long has increased.

goods in stock

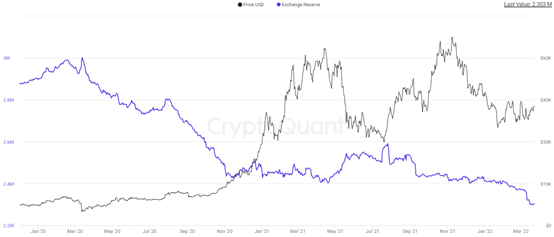
1. Exchange BTC stock

The stock of BTCs in the exchange fell to 2.303 million BTCs on March 23. From the change of BTC stock in the exchange, the outflow increased from February to March, indicating that the selling pressure of BTC continues to reduce. Since July 26, 2021, the trend of BTC outflow from the exchange has continued, which means that investors' willingness to operate has decreased and the price of BTC has been supported by growth.

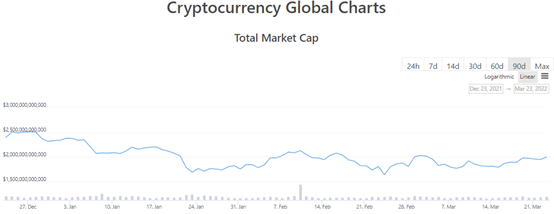
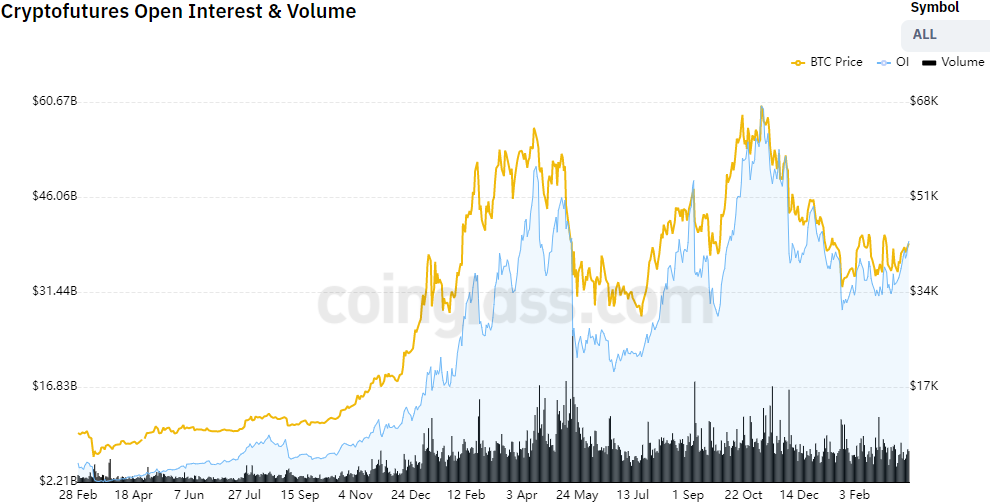
2. Market value and trading volume of the whole network

In the past two hours, the overall market trading volume was US $102.1 billion, and the overall market value increased by 2.5% to US $2 trillion. Pay attention to the trading volume and market value performance of the overall market in the past three months. The market value fluctuation space of the whole network runs between us $16423 billion and US $25005 billion.

contract

Contract transactions in mainstream currencies such as BTC can find spot prices and improve the direction of price operation. At the same time, it can also provide hedging methods for spot investors. Analyzing the long and short position direction, position change and leverage performance of the contract can help us confirm the trading signal.

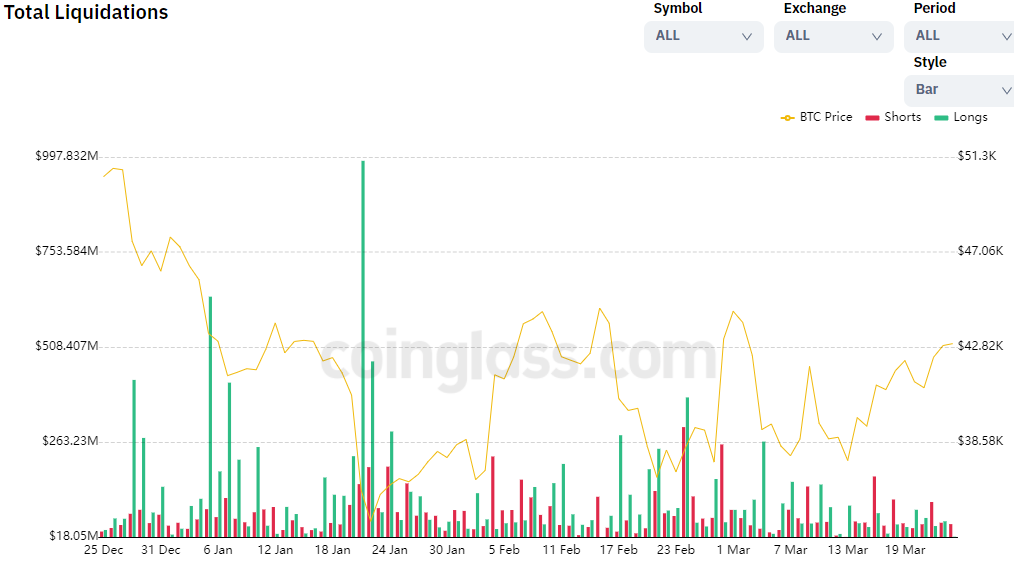
1. Statistics of warehouse explosion in the whole network

The number of open positions indicates the effect of the release of market resistance during the price operation. The larger the number of open positions, the greater the reverse capital strength. After a short period of time, the excessively high position explosion amount can also prompt the price reversal signal. Because the fund increases the number of positions in the opposite direction in a short time, promoting the reverse operation of the market in a short time.

Network wide contract explosion

On March 24, the empty single explosion warehouse of the whole network contract reached US $35.31 million, and the multi single explosion warehouse of the whole network reached US $11.68 million. From the absolute value of position explosion, it is a low level in the short term. At the same time, the number of empty single positions has been generally large since mid March. At present, the reverse view of position explosion is relatively favorable for price rise.

2. Statistics of positions and turnover of the whole network

The trading volume and position of the whole network contract were stable. On March 24, the position shrank by US $39.2 billion, a slight increase of 1.8%; The turnover was US $110.3 billion, a slight decrease of 5.9%. It is worth noting that the contract position is the highest level since January 5, indicating that the overall market heat is continuing to grow.

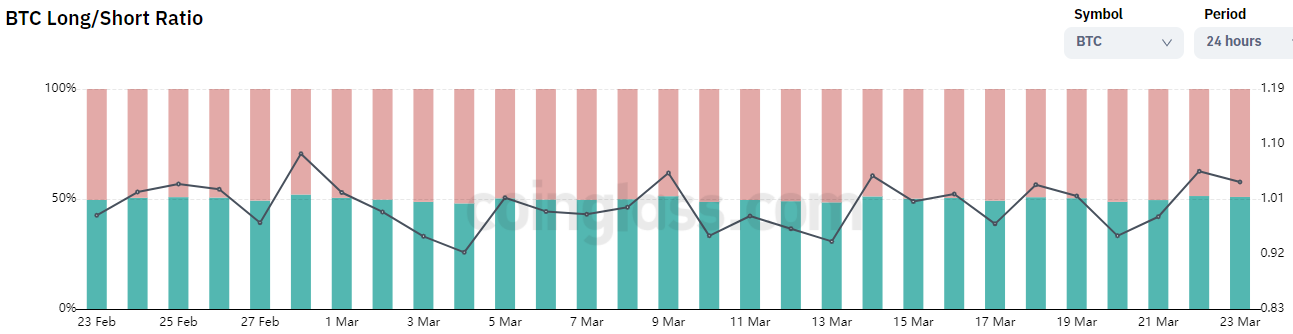
3. Statistics of long and short positions of the exchange

The proportion of long and short positions in the exchange intuitively reflects the strength of long and short positions, and the dynamic proportion of long and short positions better verifies the trading signal. When multiple positions account for a large proportion, it indicates that the buyer has strong strength, and the BTC price is easy to rise but difficult to fall. On the contrary, the short strength is strong, suggesting a short signal.

On March 24, the proportion of multiple and empty orders in BTC was 1.04%, and the proportion of multiple orders was 50.93%, while the proportion of empty orders was 49.07%. Many parties dominated for the third consecutive trading day, and BTC had strong short-term upward momentum.

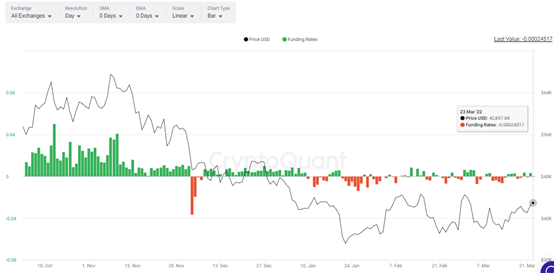
4. Contract capital rate

The higher the contract capital rate, the more information the bulls have about the price rise. The latest capital rate value of BTC shows that the fluctuation space of capital rate since 2022 is small, and the financing cost on more trading days is lower than 0, which means that the cost of financing for investors to buy BTC is very low. On March 23, the capital cost of BTC was -0.00024. The capital cost of BTC is lower than 0, the market is still in the bottom confirmation stage, and the opportunity of low absorption is relatively low.

Related Reads

Both Suffer Massive Losses Exceeding $90 Billion, Which Is in Greater Peril: Strategy or Bitmine?

Facing massive paper losses exceeding $90 billion each amidst a sharp market downturn, "Digital Asset Treasury" (DAT) giants Strategy and Bitmine find themselves in a precarious position, but with different underlying risks. Strategy, heavily invested in Bitcoin (BTC), faces significant financial strain. Its strategy relies heavily on debt, including convertible notes and preferred stock (STRC) requiring substantial dividend payments. With its cash reserves dwindling and BTC offering no staking yield for cash flow, Strategy's high leverage makes it vulnerable. A continued price decline could force asset sales to meet obligations, potentially creating a negative feedback loop. Its market value has already fallen sharply. In contrast, Bitmine, an Ethereum (ETH) holder, appears on firmer financial ground. It primarily funds its purchases through equity offerings (like ATM programs), avoiding debt pressure. It also generates income by staking a large portion of its ETH holdings. While not immune to market drops and shareholder dilution concerns, Bitmine maintains more flexibility, recently announcing a new preferred share offering to raise further capital. The core divergence lies in their financing: Bitmine uses equity (investor money), while Strategy uses debt (borrowed money). Consequently, Bitmine currently faces less immediate liquidity pressure than Strategy, which must navigate the dual challenge of servicing debt/dividends and a declining core asset (BTC) price.

marsbitHá 5m

Both Suffer Massive Losses Exceeding $90 Billion, Which Is in Greater Peril: Strategy or Bitmine?

marsbitHá 5m

Where the AI Bubble Really Is: Which Layer of Players Are Naked

AI Bubble: Where It Really Is and Who's Swimming Naked This analysis dissects the AI industry not as a single entity but as a five-layer pyramid, arguing that bubbles are concentrated in specific tiers, not uniformly distributed. **Key Distinction from the 2000 Dot-com Bubble:** Unlike 2000, where companies had stock prices before revenue, today's leading AI players have massive, contract-backed revenue driving their valuations. Core infrastructure demand is real, with every GPU running at full capacity for paying customers. **The Five-Layer Pyramid & Bubble Assessment:** * **L0 (Fab/Manufacturing) & Top L4 (Leading AI Apps): NO BUBBLE.** Companies like TSMC, NVIDIA, major cloud providers (Microsoft, Google, Meta, Amazon), and top AI labs have real revenues and orders. Supply is tightly constrained by TSMC's disciplined capacity control and physical limits like power/land for data centers, preventing a supply glut. * **L1 (Memory): BATTLEGROUND.** Sky-high HBM margins could signal a new structural cycle or a classic "boom before bust." The oligopoly of three major players may enforce supply discipline, making this a high-stakes bet. * **L2 (Interconnect/Optical Modules): BUBBLE TERRITORY.** Companies like Lumentum and AAOI have seen stock surges (4-10x) far outpacing revenue growth. This hardware segment has lower physical barriers to expansion than fabs, allowing speculation. It mirrors the 2000 bubble's epicenter—optics. * **L3 (Infrastructure/"GPU Landlords"): VULNERABLE.** GPU leasing companies profit from the current compute shortage but own no long-term moat. Their business model relies on a temporary bottleneck that will ease as big tech expands and new tech (e.g., potential space-based data centers) emerges. * **L4 Long Tail (VC-backed Startups): STRONG BUBBLE SIGNALS.** VC funding concentration in AI is twice that of the 1999 peak. Many startups with little revenue use the valuation logic of successful giants to justify their own, creating high risk of a "valuation crunch" when funding dries up. **Critical Risks to Monitor:** 1. **GPU Depreciation & Accounting:** Companies extending the assumed useful life of GPUs artificially boost profits. The true economic life depends on future generational leaps from NVIDIA. 2. **"GPU Credit" & Off-Balance-Sheet Leverage:** Emerging structures where shell companies borrow to buy GPUs and lease them out (with chipmakers sometimes investing) move debt off major balance sheets. This echoes the "vendor financing" of 2000 and the securitization risks of 2008, though currently small-scale. 3. **TSMC Abandoning Caution:** If the primary supply bottleneck (TSMC's conservative capacity planning) breaks, runaway supply could trigger a bust. 4. **Algorithmic Efficiency Breakthrough:** A major leap in software efficiency could drastically reduce the need for raw compute hardware, undermining the investment thesis. **Conclusion:** The AI boom is expensive and has frothy areas, but its core is underpinned by real demand and physical supply constraints. The bubble risk is layered: most present in optical components, GPU leasing, and the long-tail startup ecosystem, while the foundational chip manufacturing and leading application layers remain relatively solid—for now.

marsbitHá 17m

Where the AI Bubble Really Is: Which Layer of Players Are Naked

marsbitHá 17m

Standing in the Light: A Comprehensive Guide to the Optical Module and CPO Supply Chain

"Standing in the Light: Understanding the Optical Module and CPO Industry Chain" This article analyzes the critical role of optical communication technology, specifically optical modules and Co-Packaged Optics (CPO), as the "nervous system" for modern AI data centers. With exponential growth in AI computational demands (e.g., NVIDIA's Vera Rubin architecture), traditional electrical interconnects using copper cables face severe bottlenecks in bandwidth, power consumption, and signal integrity over distance. The core function of an optical module is to act as a "translator," converting electrical signals from chips into optical signals for transmission over fiber (and vice-versa). Key internal components include lasers, modulators, photodetectors, drivers, and DSP chips. The industry is currently transitioning from 800G to 1.6T modules. However, the future lies in CPO. This next-generation technology integrates the optical engine directly with the switch ASIC/XPU on the same package substrate, drastically reducing power consumption (by ~3.5x according to NVIDIA), overcoming bandwidth density limits, and minimizing signal attenuation compared to traditional pluggable modules. Key challenges for CPO include advanced packaging capacity (dominated by TSMC), thermal management, repairability, and standardization. The article details the broader technology landscape, including Near-Packaged Optics (NPO, a pragmatic intermediate step), Linear-drive Pluggable Optics (LPO), Optical I/O (OIO for chip-level integration), and Optical Circuit Switches (OCS). A comprehensive CPO industry chain is mapped, highlighting shifting power dynamics: * **Architecture Definers:** NVIDIA, Broadcom, and Marvell now hold greater influence. * **Advanced Packaging & Manufacturing:** TSMC is central; Fabrinet is a key EMS player. * **Lasers ("The Heart"):** A strategic bottleneck. EML lasers are led by Lumentum and Coherent (both receiving major NVIDIA investments). CW lasers, favored for CPO/silicon photonics, see strong Chinese players like Source Photonics and Sicoya. * **Silicon Photonics Chips:** The mainstream path for CPO engines, with key players like Broadcom, Intel, Marvell, and China's Accelink. * **Fiber Connectivity Components:** A major new, high-growth market created by CPO, including Fiber Array Units (FAU), Polarization-Maintaining Fiber (PMF), and MPO connectors. Companies like Tianfu Communication and US Conec are leaders. * **Fiber & Cable:** Experiencing a super-cycle (e.g., Corning, Yangtze Optical Fiber). * **PCB/Substrates:** Requiring advanced materials (e.g., Shengyi Tech). * **DSP & SerDes:** Functions are integrated into switch ASICs in the CPO era (e.g., Broadcom, Astera Labs). * **Optical Module Makers:** Transitioning from standalone module suppliers to providers of optical engines and NPO/LPO solutions while riding the current pluggable boom (e.g., Zhongji Innolight, Eoptolink). The investment timeline is segmented: Short-term (2026-2027) features the "last feast" for pluggable modules and CPO's initial rollout. Medium-term (2027-2029) will see CPO expand and NPO peak. Long-term (2029-2032+) involves CPO/OIO penetration into intra-rack scaling. In conclusion, optical interconnects are fundamental to AI infrastructure. The competitive landscape sees US firms leading in architecture and high-end chips, TSMC in advanced packaging, and Chinese firms holding strong positions in modules, connectivity components, CW lasers, and fiber/cable. The future belongs to companies that can navigate the technological shift from "selling shovels" (modules) to "building highways" (CPO/OIO infrastructure).

marsbitHá 27m

Standing in the Light: A Comprehensive Guide to the Optical Module and CPO Supply Chain

marsbitHá 27m

Trading

Spot
Futures
活动图片