GameFi projects showed strong resistance to the negative macro environment in February and March, with many areas of development not only growing steadily but breaking out against market trends.
Footprint Analytics data shows that the number of GameFi game projects went up to 1,406, up 5% MoM. Trading volume at the end of the month was $129 million, up 154% MoM. Active users increased 56% from February. It is worth noting that the two game projects, Par War Online and DeFi Kingdoms, have increased by more than 25,000% in active users in the past 30 days.
The following will analyze the overall situation for GameFi in March using data.
GameFi Market Overview
GameFi Project Count Up 5% MoM, BSC Project Count Up 1303% YoY
Looking at the overall development of GameFi, many blockchains and gaming projects have emerged in the past year. According to Footprint Analytics, as of March 31, there were 35 blockchains participating in the GameFi sector, with 1,406 game projects in total, up 5% MoM.
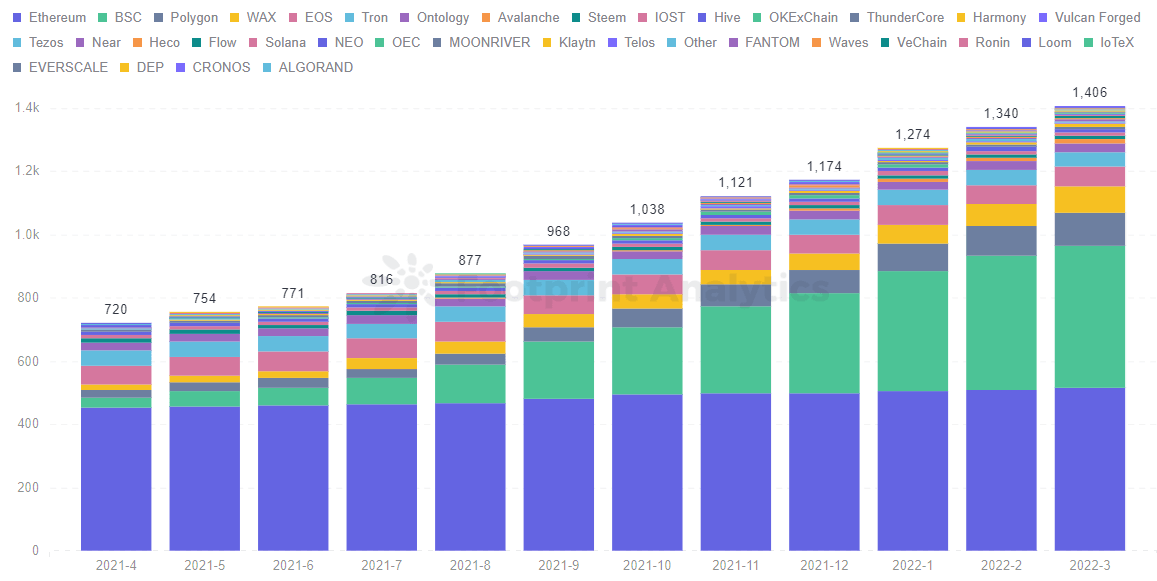
Footprint Analytics – Number of GameFi Protocols by Chains
Although most of the early projects were concentrated on Ethereum, due to the impact of network congestion and high gas fees, the poor user experience slowed down the pace of development. Instead, on-chain gaming projects such as BSC, Polygon, WAX and EOS are gradually increasing.
Notably, BSC has the fastest growing project count, up 1303% YoY. It has low gas fees and a throughput 5 times higher than Ethereum, with 449 gaming projects deployed on BSC by the end of March.
At the same time, some chain’s have faced the problem of having one project driving the entire ecosystem.
For example, Splinterlands has single-handedly driven the development of Hive, which has been a Top 5 GameFi project by number of users for the past three months. There is also DeFi Kingdoms on Harmony, which surpassed Axie Infinity multiple times in March in daily trading volume the become the largest project according to this metric.
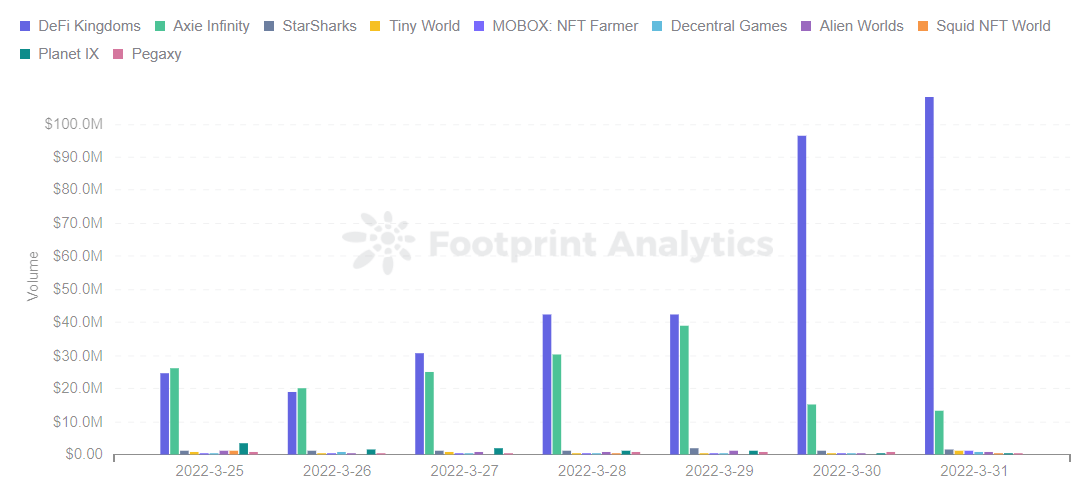
Footprint Analytics – Top 10 Games Ranking by Volume
GameFi’s Trading Volume Picks Up, Active Users Up 56% MoM
The number of users is the key to the healthy operation of the entire GameFi ecosystem. If there are no users, the game project will become worthless. As of March 31, the total number of active users was 10.96 million, including 1.27 million new users. Compared to February, the number of active users increased by 56%.
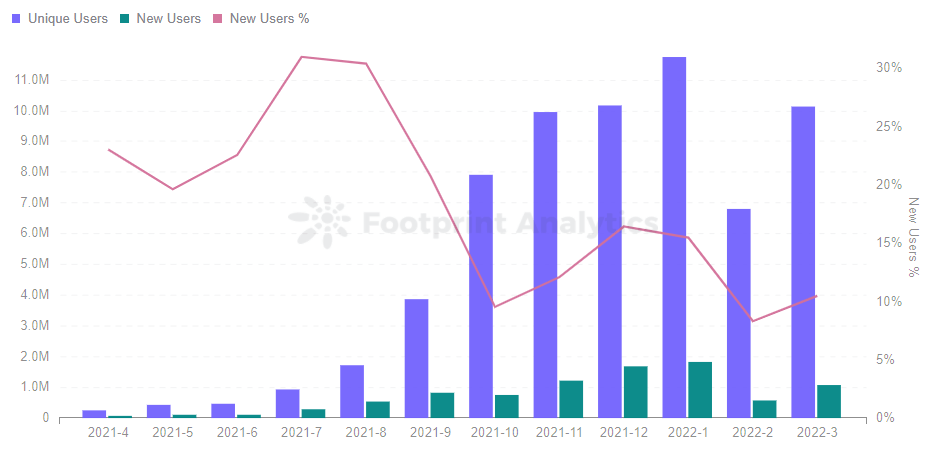
Footprint Analytics – Monthly Gamers Trend
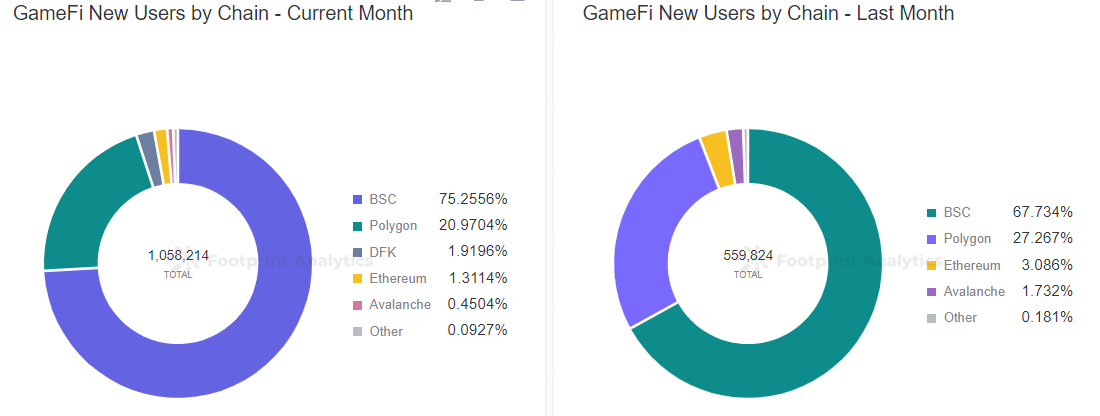
Footprint Analytics – GameFi New Users by Chain
Par War Online and DeFi Kingdoms are the games that are driving GameFi’s rapid growth in active users. In the last 30 days, active user growth has been 28,931% and 25,319%, respectively. These two games are attracting users primarily because of their high revenue generation opportunities, such as the 300% to 400% APY LP for DeFi Kingdoms.
According to Footprint Analytics data, GameFi’s trading volume has been on a downward trend due to the Russian-Ukrainian conflict. It was only after March 21 that volume picked up quickly, ending the month at $129 million, up 154 percent from February. It gradually recovered from a per capita volume of about $30 to $105 per capita.
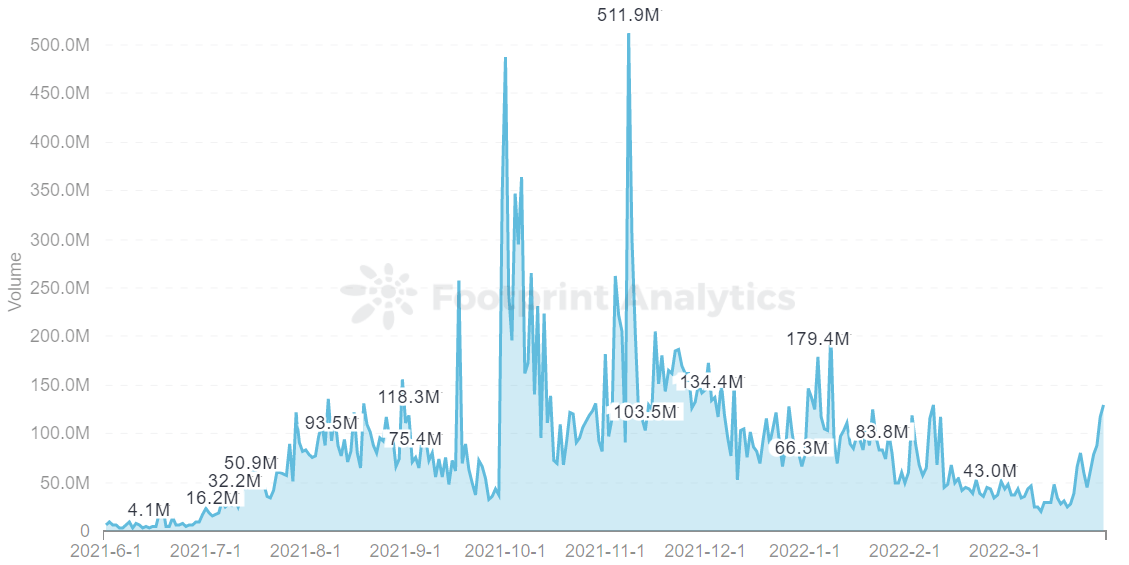
Footprint Analytics – GameFi of Volume Trend
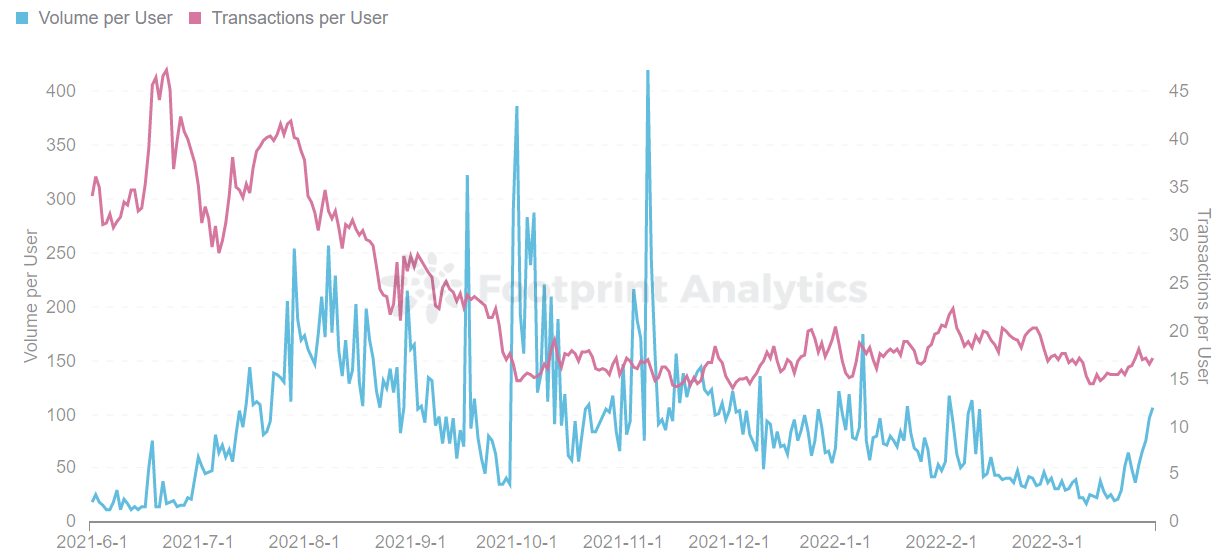
Footprint Analytics – GameFi Volume and Transactions per User
As can be seen, although the GameFi market showed a downward trend in transaction volume due to the macroeconomic impact, it quickly rebounded after late March with more new users engaging in the GameFi sector. This means that sensible tokenomics and products can create games that engage users.
GameFi Monthly Investment Volume Increased 307% MoM
The data shows that GameFi investments in March were $458 million, an increase of 307% compared to February. In terms of investment sector, NFT and Web3 in the GameFi category saw the largest increases.
As the number of GameFi protocols increases, the influx of blockchains such as BSC has broken the slow pace of Ethereum in the GameFi sector, contributing to the continued inflow of funding.
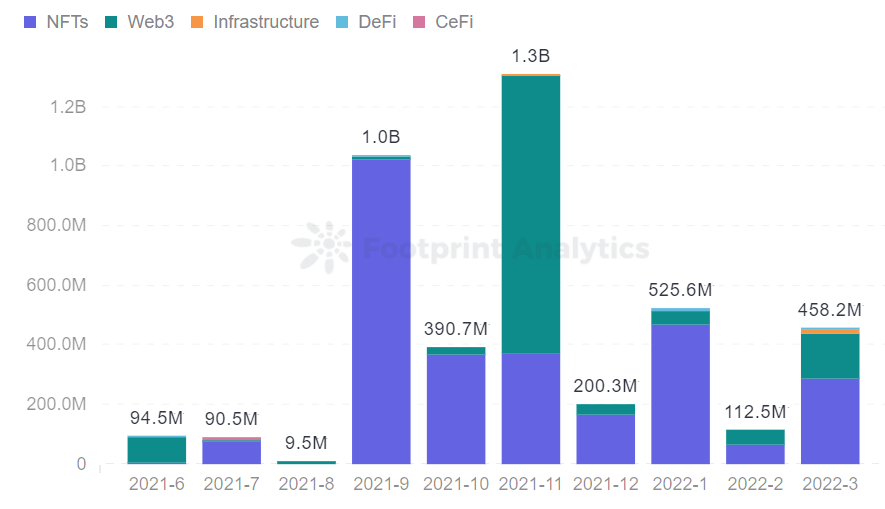
Footprint Analytics – Gaming Financing distribution
The financing received by GameFi projects mainly comes from seed rounds, the main reason behind this phenomenon is that the GameFi industry is in the early stage, and the development cycle of quality game projects is long, which is also the trend cycle for investors to observe the industry.
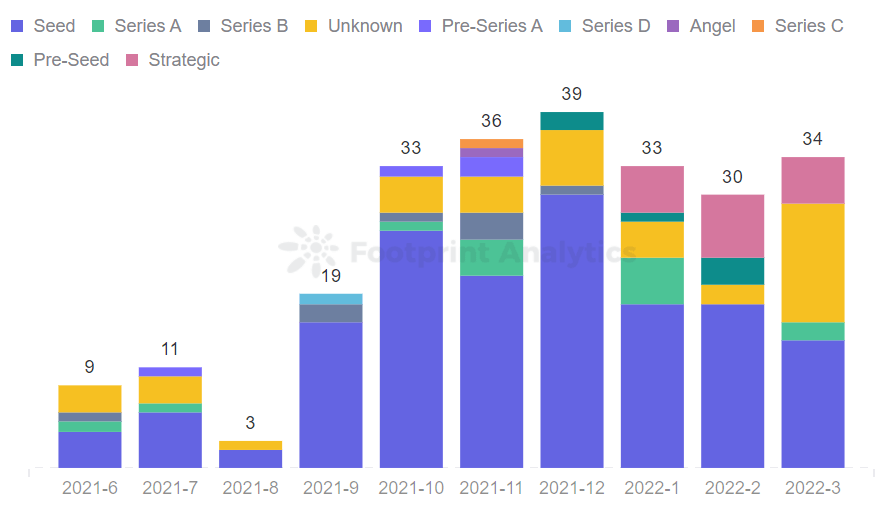
Footprint Analytics – Monthly Number of GameFi Projects Funded
Game Projects That Accelerate GameFi’s out of the Circle in March
Footprint Analytics believes that GameFi is one of the most effective means of attracting new users into crypto. Opportunities with stronger gameplay and higher yields will become the main focus in GameFi in the future.
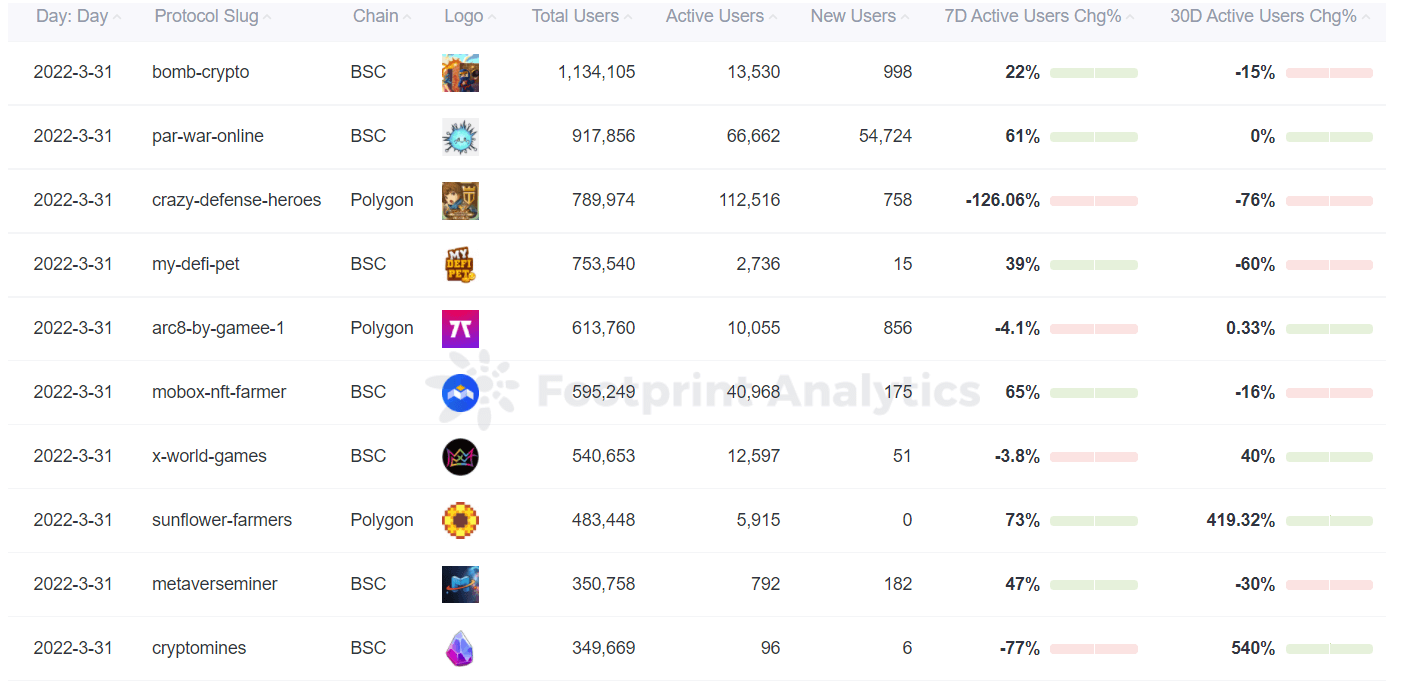
Footprint Analytics – Ranking of Daily Gamers (March 31)
Hot Game Projects
Having a multi-game ecosystem and interoperability between games is more attractive for user participation.
From the number of users and the number of transactions, it can be seen that in March, there were many GameFi projects in which users participated in transactions. But the more popular ones were DeFi Kingdoms, StarSharks and Thetan Arena. The number of users and transactions of the three game projects are on the rise.
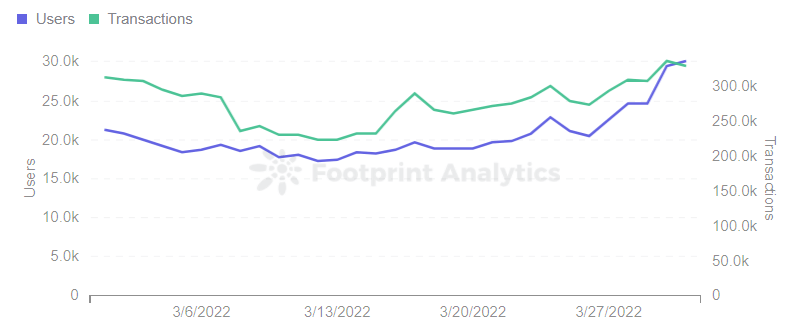
Footprint Analytics – DeFi Kingdoms Users & Transactions
Thetan Arena has rapidly gained new users with its strong gameplay, mobile support, short game time (3 to 5 minutes per round), and low entry cost.
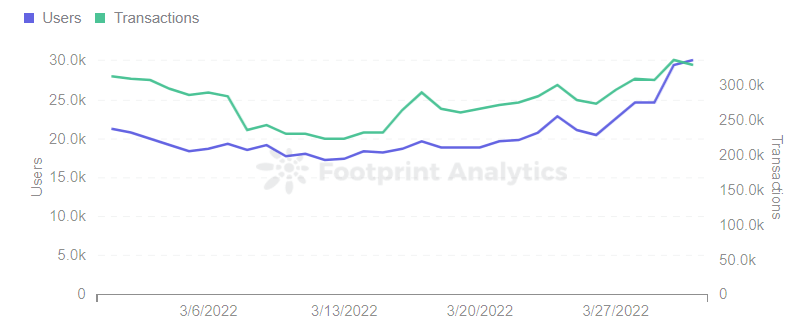
Footprint Analytics – Thetan Arena Users & Transactions
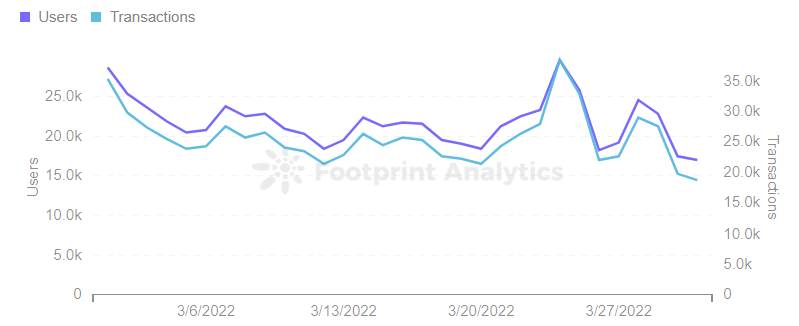
Starsharks is the BSC project with the largest user growth. It leverages the innovative Rent to Play model, where players can buy or rent NFTs through the platform’s native leasing feature to facilitate full utilization and liquidity of NFT assets.
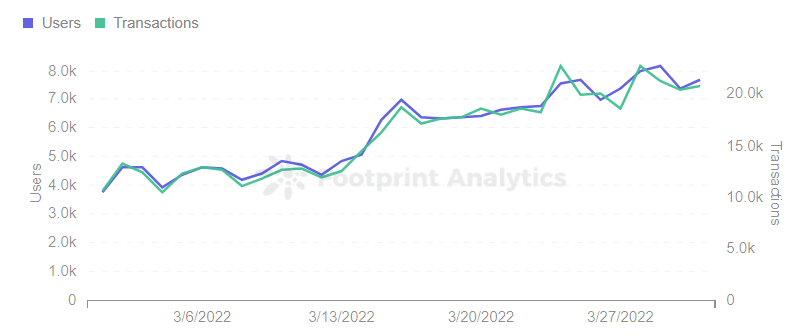
Footprint Analytics – StarSharks Users & Transactions
Starsharks’ retention rate in March was 13%, and the overall user retention rate is declining. By comparison. Cryptokitties (a popular Ethereum chain game) had a retention rate of 1.2% in March.
This shows that innovation and project liquidity are important to retain users.
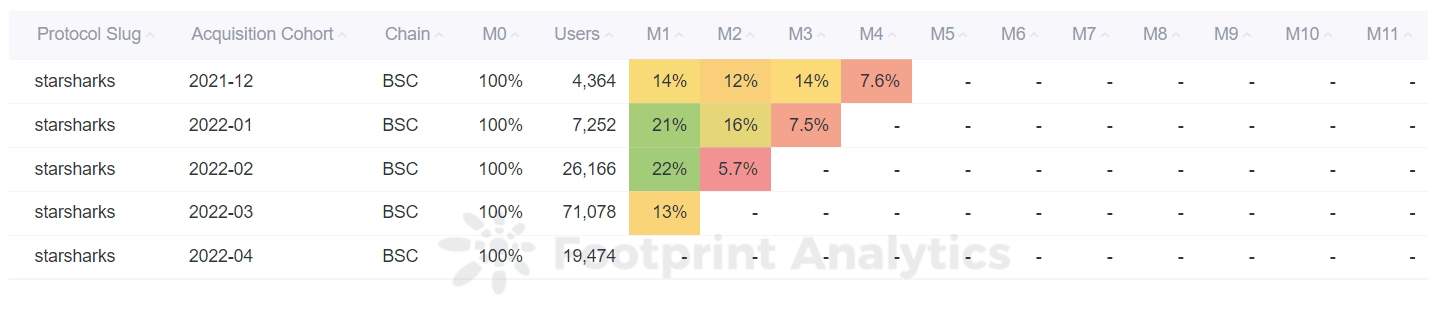
Footprint Analytics – Starsharks Monthly Retention Analysis
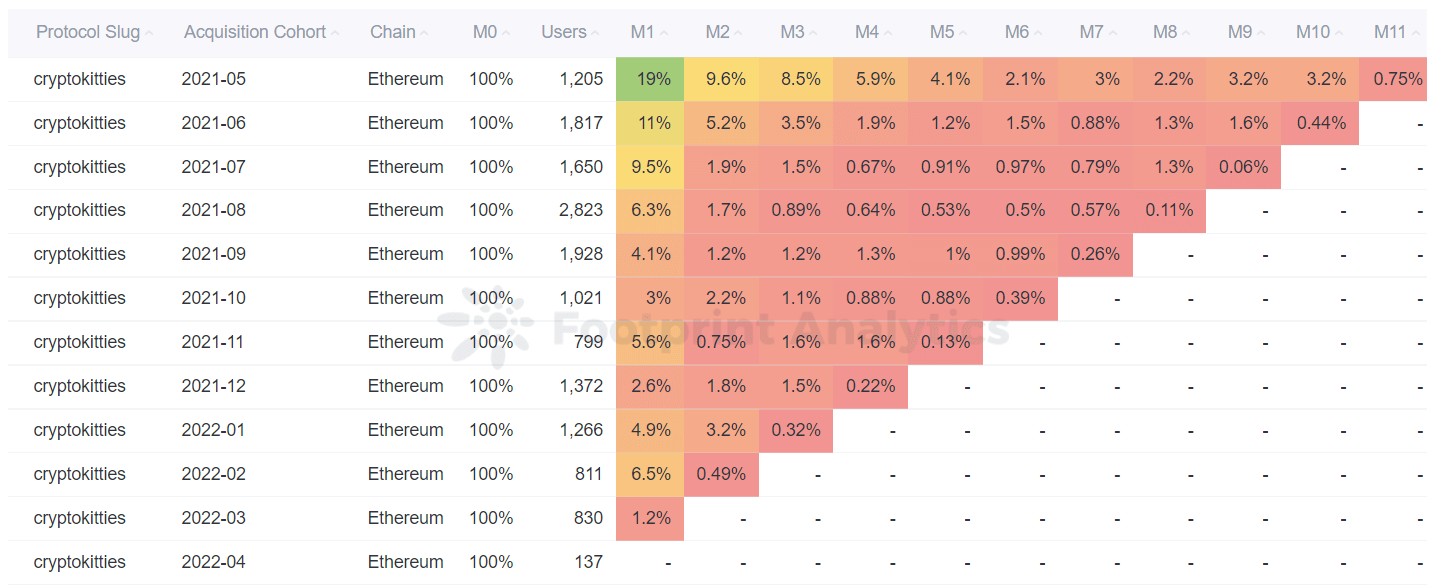
Footprint Analytics – Cryptokitties Monthly Retention Analysis
Game Items with a Crash in the Number of Users
According to Footprint Analytics data, MetaverseMiner’s user numbers and transactions are crashing. Once players earn less revenue (in terms of a stable token or fiat), highly experimental games like this often face the loss of traffic.
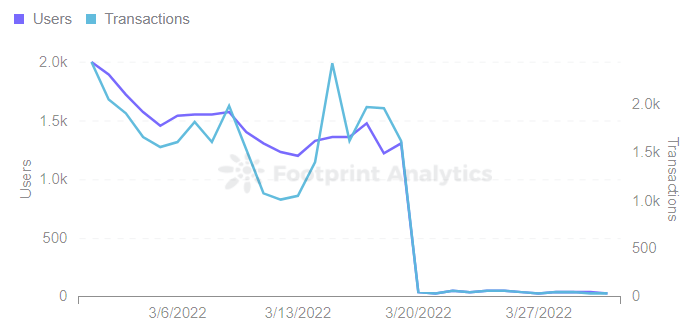
Footprint Analytics – MetaverseMiner Users & Transactions
March also saw one of the largest security breaches in GameFi history. On March 23, cybercriminals stole $622 million from Axie Infinity users in cryptocurrency. As a result, the number of users decreased.
Footprint Analytics – Axie Infinity Users & Transactions