Last week saw substantial changes in Bitcoin's price movement. On October 8th, the price broke down with volume below the lower boundary of the consolidation range near $82,500, hitting a low of $80,400. Although it subsequently climbed back above $82,500, the rebound was notably low-volume, indicating insufficient bullish momentum. As we mentioned last issue regarding the two scenarios for the end of wave e, the market is leaning towards the second one: the high on September 21st is likely the peak of this rebound.
Zooming out to the weekly chart, only one of the three principles of the 52-week moving average confirmation method is currently met. According to our quantitative standards, the rally since July 1st should still be classified as an oversold rebound, not yet sufficient to confirm the establishment of a bull market.
HYPE also broke below the lower trendline of its two-month ascending channel on October 8th, entering a critical window for short-term directional choice.
This week's review will continue using the established analytical framework to focus on answering three questions:
- Under the 52-week MA standard, what kind of market is Bitcoin currently in?
- After the end of wave e, how will the daily-level correction structure unfold?
- How should medium and short-term strategies respond to the potential correction?
We will also provide specific observation points and operational plans for HYPE during the pullback confirmation phase after breaking the channel.
Summary of this week's core trading views:
• Analysis of Bitcoin's current market trend nature (detailed in Part One)
• Analysis of Bitcoin's daily-level price structure (detailed in Part Two)
• Bitcoin's weekly price forecast and medium/short-term trading strategies (detailed in Part Three)
• Analysis of HYPE's daily-level price structure (detailed in Part Four)
• HYPE's weekly price forecast and short-term trading strategies (detailed in Part Five)
I. Analysis of Bitcoin's Current Market Trend Nature
1. In our weekly review published on August 31st, based on analyzing nearly 9 years of Bitcoin market history data, we proposed a simple, practical quantitative standard for trend judgment: the 52-week moving average confirmation method, clearly stating its quantitative principles.
1. Price Breakout Principle (Bear-to-Bull Transition): The weekly closing price breaks above the 52-week MA and remains above it for 2-3 consecutive weeks; a single-week piercing followed by a retreat is considered a false breakout.
2. Pullback Confirmation Principle: After the price runs above the 52-week MA for a period (typically 5 weeks or more), a pullback to retest the MA is desirable to further confirm the breakout's validity.
3. Bull Market Confirmation Principle: The price continues to trade above the 52-week MA, and the slope of the MA turns upward.
These constitute the three conditions for judging a bull market environment. After more than 40 trading days of market movement, what changes have occurred? What nature is the current market in? Bearing these questions, we will strictly follow the established quantitative standards to re-examine the market.
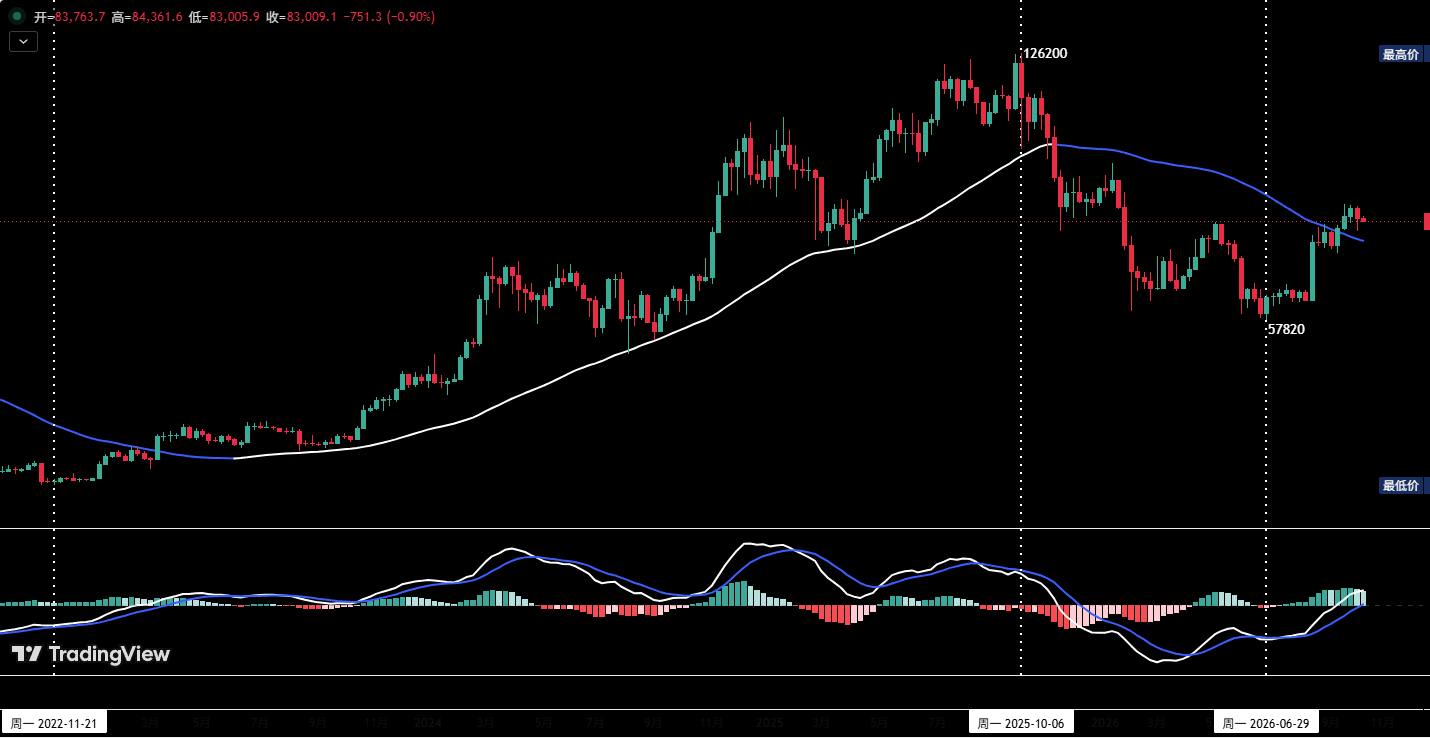
Figure 1: Bitcoin Weekly Candlestick Chart
2. As shown in Figure 1, within the weekly chart framework, the market displays the following characteristics:
1. Since the weekly close on September 14th, the price has successfully broken and held above the 52-week MA (white-blue) for four consecutive weeks, largely satisfying the price breakout principle.
2. During the 3rd week of trading above the 52-week MA, a pullback to test the MA occurred. However, it still falls short of the predetermined pullback confirmation principle.
3. The current 52-week MA is around $78,000, and its direction is still downward.
3. In summary, the current market performance only satisfies one of the three principles mentioned above, with the other two unmet. Based on this judgment, we believe:
1. The rally initiated from the July 1st low of $57,820 should still be defined as an oversold rebound, insufficient to confirm a bull market.
2. Even if this rally is later confirmed as a bull market Wave I (impulse) (meaning July 1st is the terminal point of the correction from $126,200), the direction of the 52-week MA will also need to undergo a process of "downward → flat → upward turn." It can be inferred that the price will most likely maintain a range-bound, oscillating pattern in the near future, with the probability of a Wave II (corrective) adjustment significantly increased.
II. Analysis of Bitcoin's Daily-Level Price Structure
1. Our last weekly review introduced the Elliott Wave theory framework to dissect the five-wave a→e rebound structure formed since the July 1st low, focusing on two scenarios for the end of wave e:
1. If the price continues to rally and surpasses the September 21st high, wave e is highly likely to terminate within the $87,500~$90,000 resistance zone.
2. If the price rallies but fails to surpass the September 21st high, shows a pattern of rising and then falling, and effectively breaks below the key $82,500 support, the probability of the September 21st high being the terminal point of wave e increases significantly.
Judging from last week's actual price action, the probability of the market unfolding the second scenario is increasing.
This week, we continue using the previous analytical framework to focus on: if wave e has indeed ended on September 21st, how will the subsequent market structure evolve.
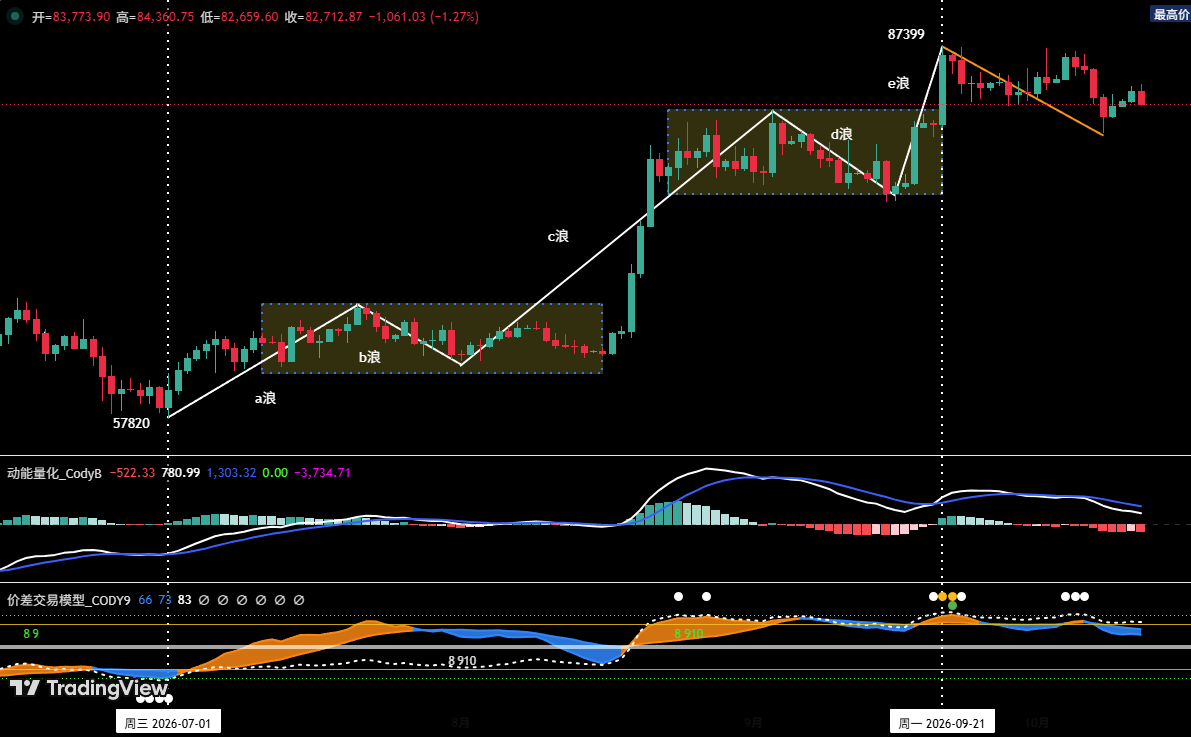
Figure 2: Bitcoin Daily Candlestick Chart
2. Review of last week's price action and rationale for judging wave e likely ended on September 21st:
1. Since the correction from the October 2nd high (~$87,154), the overall volume-price pattern has been one of high volume on declines and low volume on rebounds. On October 8th, it broke below the previous consolidation range's lower boundary (~$82,500), creating a short-term low of $80,400.
2. In the latter half of last week, although the price rebounded from the $80,400 low and regained the $82,500 support, it did so with noticeably low volume, indicating insufficient bullish intent. The current movement can be viewed as a pullback confirmation after breaking the key support. As long as a high-volume rally does not appear, the correction could resume at any time.
3. Technical indicator level:
• Our proprietary "Momentum Quantification Model" currently shows a momentum top divergence state.
• Our proprietary "Spread Trading Model" indicator remains in a high range. If the price rises again, top warning signals could be triggered at any moment.
4. On the weekly chart, after consecutive rallies, the recent three weekly candlesticks have formed a "top fracturing" pattern. If this week's low falls further below $80,400, a weekly-level top pattern will likely be established.
5. In summary, the probability of wave e ending on September 21st is extremely high.
3. Potential evolution of the market structure after wave e ends:
1. If wave e has ended, the market is expected to enter a daily-level correction, which will likely unfold in a three-wave corrective pattern.
2. The current movement can be defined as the first leg of correction (wave i), starting from the September 21st high of $87,399. It has run for 21 trading days so far, with an initial downside target around $78,000.
3. After the daily-level wave i correction ends, a wave ii rebound is expected, followed potentially by a wave iii correction, which will be analyzed in detail later.
III. Bitcoin's Weekly Price Forecast and Trading Strategies
1. BTC Weekly Price Movement Forecast
This week's core view: Focus on the target for the correction starting from the September 21st high.
2. Key Resistance Levels
• First Resistance Zone: Around $85,500 (previous important level)
• Second Resistance Zone: $87,500~$90,000 area (previous important level)
3. Key Support Levels
• First Support Zone: $80,500~$82,500 area (previous key support)
• Second Support Zone: $75,000~$78,000 area (previous important support)
• Third Support Zone: $69,100~$70,500 area (previous important support)
4. This Week's Trading Strategies (Excluding Sudden News Impact)
1. Medium-term Strategy:
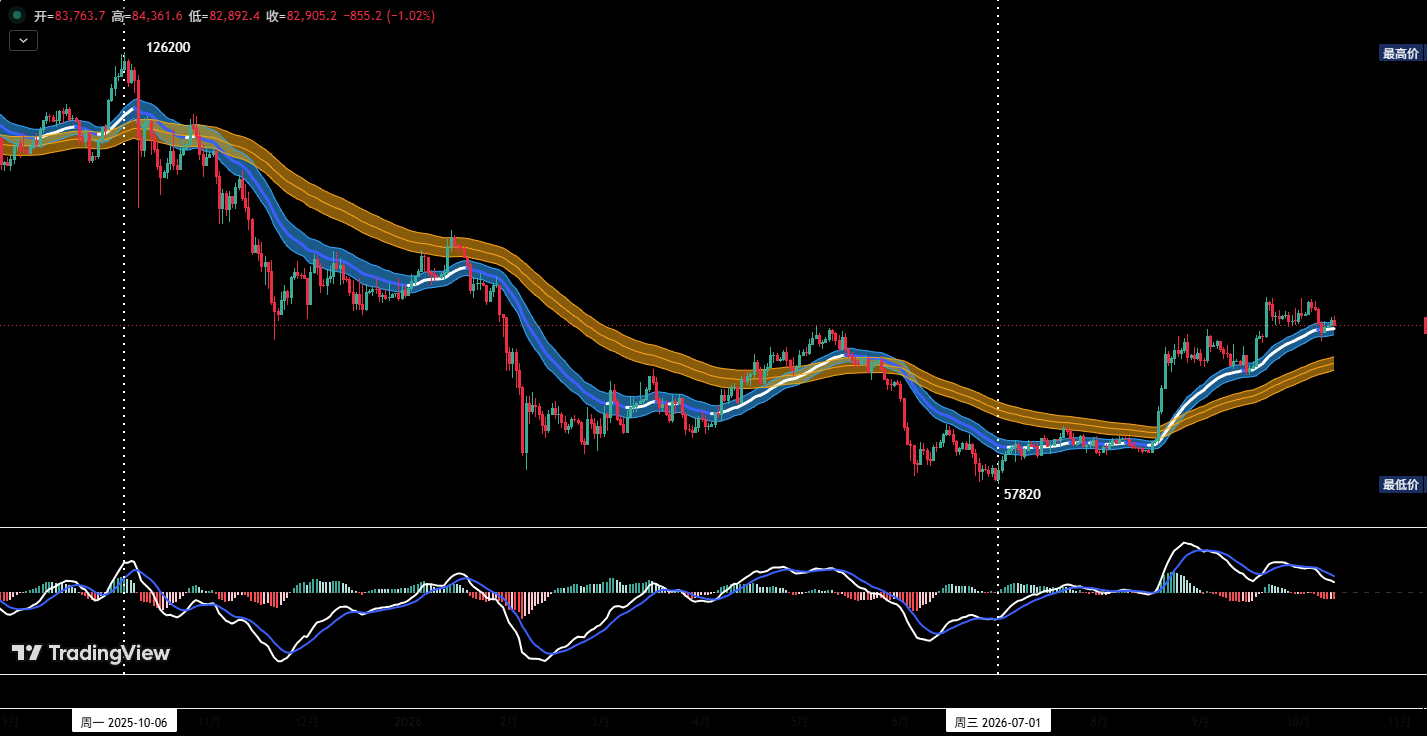
Figure 3: Bitcoin _ Daily Candlestick Chart: (Position Monitoring Model)
Position Monitoring Model: As shown in Figure 3, the price has broken the "Bull-Bear Channel" but has not yet entered the pullback confirmation stage. Therefore, the current medium-term strategy is primarily to stay in cash and observe.
2. Short-term Strategy: Utilize 30% of capital, set stop-losses, and look for "spread" trading opportunities based on support and resistance levels. (Use 30-minute/60-minute as the operation cycle).
3. For short-term operations, to dynamically adapt to the market's complex evolution, we have prepared Plan A/B in advance.
• Plan A: Lightly test short in strong resistance zones.
• Entry: If early this week the price rises to the $85,500~$87,500 zone, shows clear signs of rejection and decline, and the quantitative model simultaneously issues a top signal, consider establishing a short position of approximately 30%.
• Risk Control: Set an initial stop-loss.
• Exit: When the price adjusts near important support levels combined with model signals, consider exiting in batches to take profits.
• Plan B: Go with the trend upon effective breakdown.
• Entry: If the price falls and effectively loses the $80,500~$82,500 support zone, those in cash can consider establishing a short position of approximately 30%.
• Risk Control: Set an initial stop-loss.
• Exit: When the price further adjusts near important support levels combined with model signals, consider exiting in batches to take profits.
IV. Analysis of HYPE's Daily-Level Price Structure
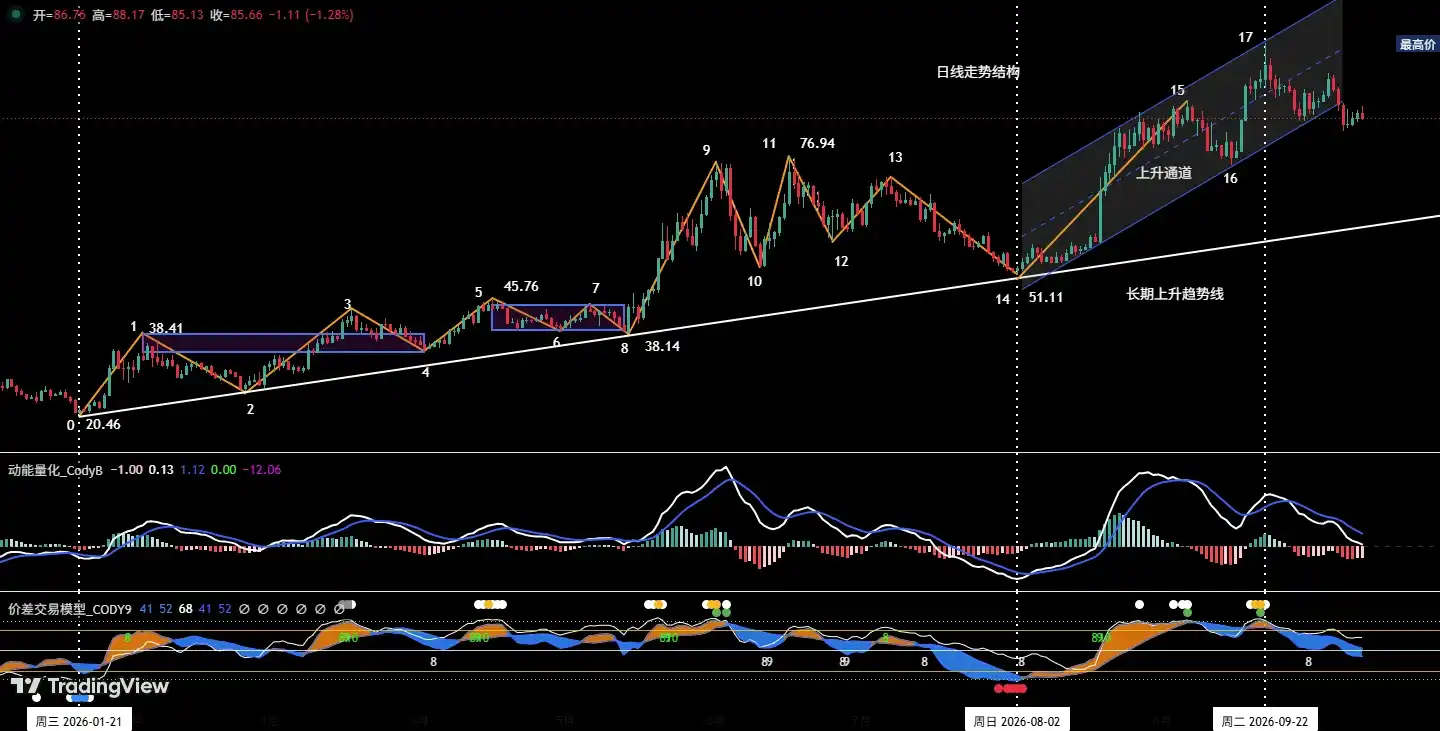
Figure 4: HYPE Daily Candlestick Chart
1. Review of HYPE's Last Week Performance
1. As shown in Figure 4, we clearly stated in last week's review: Since the August 2nd low of $51.11 initiated this rally, HYPE's price has been moving within an ascending channel (the lower channel line is defined by connecting the lows of August 12th and September 15th; the upper line is defined by connecting the highs of August 22nd and September 22nd).
2. On October 8th, HYPE recorded a medium bearish candle, dropping 4.82%, decisively breaking below the ascending channel's lower trendline. If it cannot reclaim the channel line soon, it indicates signs of weakness.
2. Analysis of Current Price Structure (Figure 4)
1. From a daily perspective, the long-term uptrend line (white) remains intact, indicating the larger cycle is still in an uptrend.
2. The daily chart shows the price has broken below the original ascending channel's lower trendline and is currently in the pullback confirmation phase after the breakdown, at a critical juncture for short-term direction. If the price can reclaim and hold above the channel line and continue upward, the short-term sideways-upward pattern remains. If it effectively loses this level, the price will likely maintain a corrective pattern this week, with the next adjustment target looking at the $75~$77 area.
V. HYPE's Weekly Price Forecast and Short-Term Trading Strategies
1. HYPE Weekly Price Movement Forecast
1. Key Resistance Levels:
• First Resistance: $88~$90 area
• Second Resistance: Around $94
• Third Resistance: Around $102
2. Key Support Levels:
• First Support: $80~$82 area;
• Second Support: $75~$77 area;
3. This Week's Core View:
Focus on observing the outcome of the price's pullback to the channel's lower trendline.
2. HYPE Short-Term Trading Strategies This Week
1. Lightly test long upon holding above channel line.
If the price continues to rise this week and firmly reclaims the channel's lower trendline, those in cash can consider lightly testing a long position. Keep position size under 30%, set a stop-loss, and strictly execute.
2. Lightly test long upon strong support holding.
If the price continues to fall to the $75~$77 area and shows signs of stabilization and bottoming, those in cash can consider lightly testing a long position. Keep position size under 30%, set a strict stop-loss, and maintain discipline.
VI. Special Notes
1. When entering a position: Immediately set an initial stop-loss.
2. When profit reaches 1%: Move the stop-loss to the entry price (breakeven point) to ensure capital safety.
3. When profit reaches 2%: Move the stop-loss to the 1% profit level.
4. Continuous tracking: Thereafter, for every additional 1% profit, move the stop-loss up by 1% to dynamically protect and lock in profits.
Financial markets are ever-changing. All market analysis and trading strategies require dynamic adjustment. All views, analytical models, and operational strategies mentioned in this article are derived from personal technical analysis, intended solely for personal trading log purposes. They do not constitute any investment advice or operational basis. The market carries risks, investment requires caution. Do not make decisions based on this article.