According to charts shared by cryptocurrency analyst Cantonese Cat, Dogecoin (DOGE) is currently positioned above the long-term support band defined by its monthly Ichimoku Cloud. The analyst noted that DOGE is "testing the lower edge of its monthly Ichimoku Cloud."
Dogecoin Tests Key Monthly Cloud Support
The DOGE monthly chart shows the Dogecoin price at approximately $0.14050, down about 3.8% for the month. The monthly candlestick opened at $0.14599, reached a high of $0.15340, and probed a low of $0.13177, showing a pattern of volatility with a generally weaker bias.
Monthly Ichimoku Kinko Hyo Structure Analysis
The chart uses standard parameter settings (9-26-52-26). The current Conversion Line (Tenkan-sen) is near $0.20092, and the Base Line (Kijun-sen) is near $0.27491. The forward span of the Cloud (Kumo) is near $0.23792 and $0.26674, respectively, extending into 2026 and forming a red cloud band.
The current Dogecoin price of around $0.14 is significantly below both the Conversion and Base Lines and is currently within the region of the Cloud's lower edge. The bottom of this cloud, after descending into the $0.12–$0.13 range, is gradually flattening, becoming a key level watched by analysts.
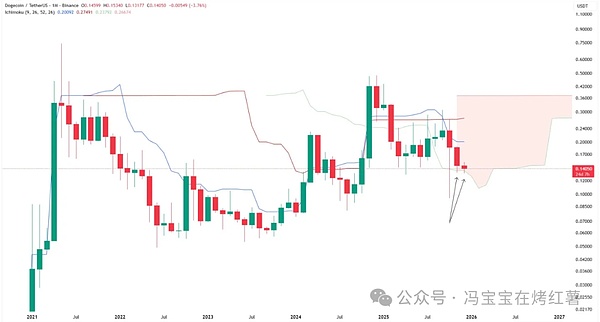
The October monthly candlestick had a long lower shadow, briefly dipping into the mid-$0.06 range but ultimately closing above the Cloud's lower edge. The currently forming monthly candlestick is testing this support again, with the price, at the time of the screenshot, slightly above this area, reported around $0.14.
In Ichimoku analysis, the Cloud's lower edge is often seen as the final support for maintaining structural integrity on higher timeframes. For the current chart, the implication is relatively clear: as long as the monthly close remains above the $0.12–$0.14 support zone, the price action of the past several years can still be interpreted as a long-term basing area, rather than a complete trend breakdown.
Weekly Chart Shows Price in Key Support Zone
On the DOGE/USDT weekly chart, the price is currently within a red support zone near $0.135–$0.145. This zone coincides with a previous consolidation range and was also a former horizontal resistance level before the prior upward breakout.
The closing prices of the most recent several weekly candlesticks have clustered here, with upper and lower shadows frequently piercing this area, reflecting repeated testing and contention. The current candlestick is trading near $0.14392, placing the price in the upper half of this support zone, but it remains below the 20-week, 50-week, 100-week, and 200-week moving averages, with the 200-week MA around $0.15563.
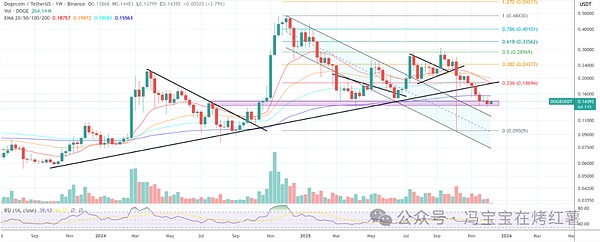
Meanwhile, Dogecoin has broken below the ascending trendline support connecting previous highs, followed by a significant pullback. Currently, this breached trendline, along with the multiple moving averages above, forms a resistance area, compressing the price between this resistance and the red horizontal support zone, resulting in a consolidation pattern.