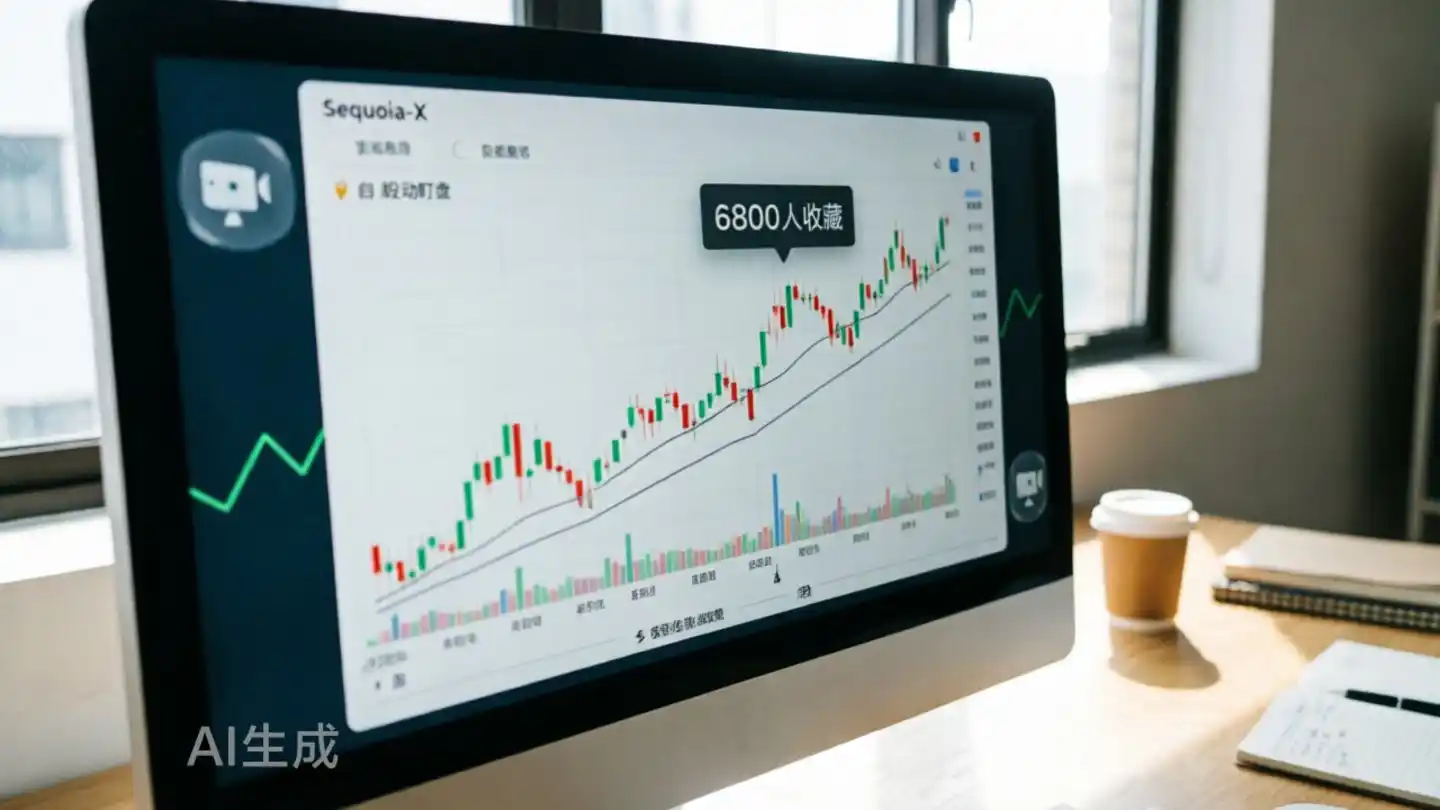
At 3:00 PM, the A-share market closes, freezing the K-line charts of over five thousand stocks. Retail investors open their trading software, flipping through K-lines, comparing patterns, and monitoring trading volumes, trying to pick out a few worthy of a second glance tomorrow from the pool of over five thousand candidates. But after checking five hundred, the remaining four and a half thousand are left to chance. The human brain is naturally ill-suited for processing vast amounts of information, and even worse at maintaining discipline when fatigued—and stock selection happens to require both.
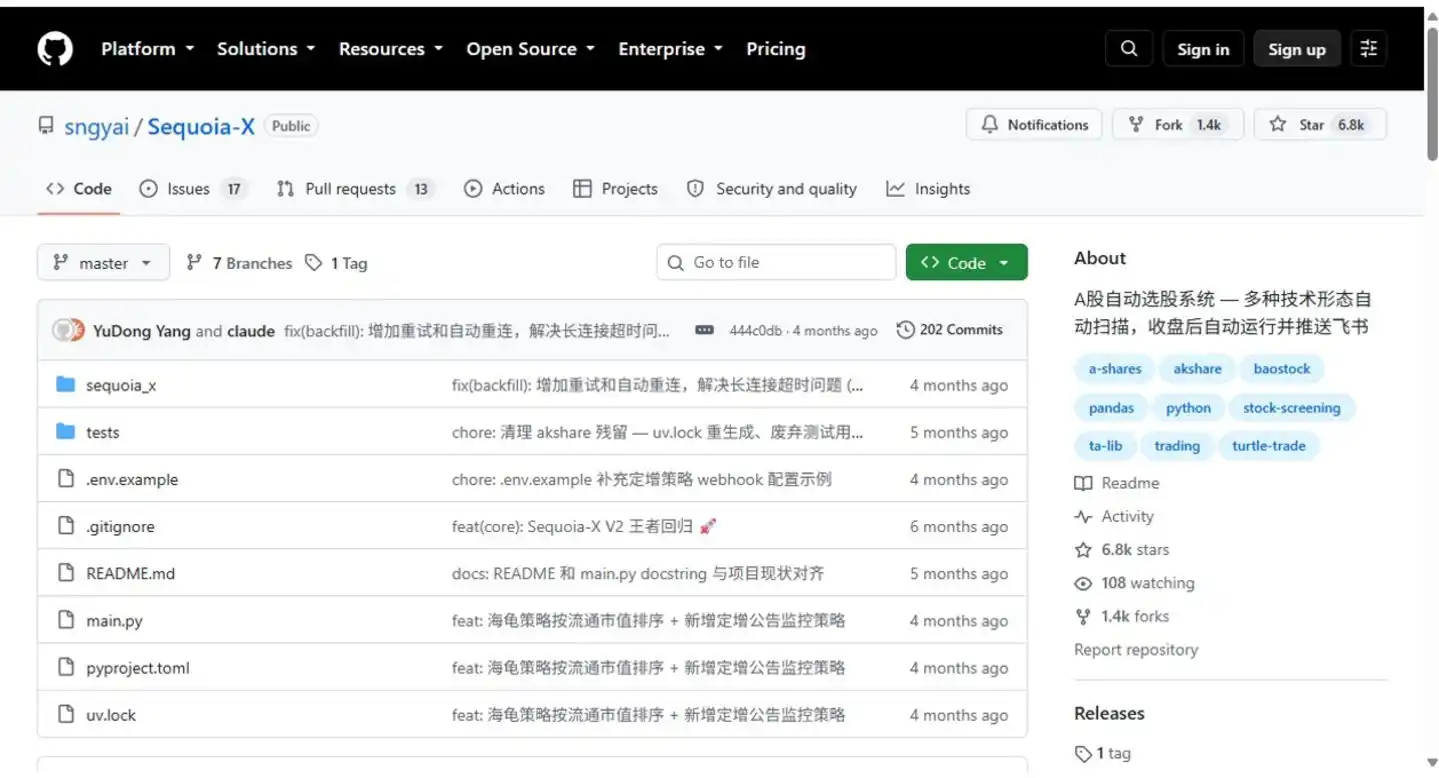
Someone decided not to battle their own eyes any longer. They wrote the entire "post-market stock screening" process into code, threw it on GitHub, and named it Sequoia-X. In half a year, the project's stars grew from 3,000 to over 6,800, even hitting GitHub Trending in early September. What makes a Python tool for "automated post-market stock screening and Lark push notifications" attract so much attention? This article breaks it down: what problem it solves, how it works, the origin of its strategies, and how to get started quickly.
(Project Address: https://github.com/sngyai/Sequoia-X)
What You Need Isn't More Software, But an Assembly Line for Stock Selection
Retail investors face three major difficulties in stock selection. The first is quantity: manually covering over five thousand A-share stocks is an impossible task. The second is data: free APIs are either incomplete or rate-limited; paid ones cost thousands or tens of thousands; trying to scrape it yourself, East Money's anti-scraping mechanisms can drive your scripts mad. The third is time: monitoring technical patterns requires continuous attention, which office workers simply don't have. By the time they open their software after work, the patterns to watch have already played out.
Sequoia-X offers an engineering solution: transforming the entire process into an unattended assembly line. It uses baostock as the data source—free, no registration required, no rate limits; historical K-line data is pulled and stored in a local SQLite database, so the data is entirely yours; it runs automatically once after the market closes each day, scanning the entire market with 7 built-in technical pattern strategies, and pushes results to group chats via Lark Webhook. The next morning before the market opens, you just need to glance at your phone.
This model takes about 12 minutes for the initial backfill, and only 2-3 minutes for daily runs on subsequent trading days.
The project author, YangYuDong, has an interesting background. His GitHub showcases MQTT middleware, instant messaging services—a row of underlying infrastructure projects, all emphasizing "massive data, stability first". His approach to A-share quantitative trading is to design stock selection like a messaging system: data in, results out, all engineering in between. Sequoia-X has also undergone a complete rewrite: V1 primarily relied on akshare, feature-rich but dependent on web interfaces, plagued by constant anti-scraping and missing fields, often breaking mid-run; V2 switched to baostock and was rewritten to modern engineering standards—the "King's Return" at the beginning of the README is exactly that.
Dismantling the Production Line: Data, Strategy, Push
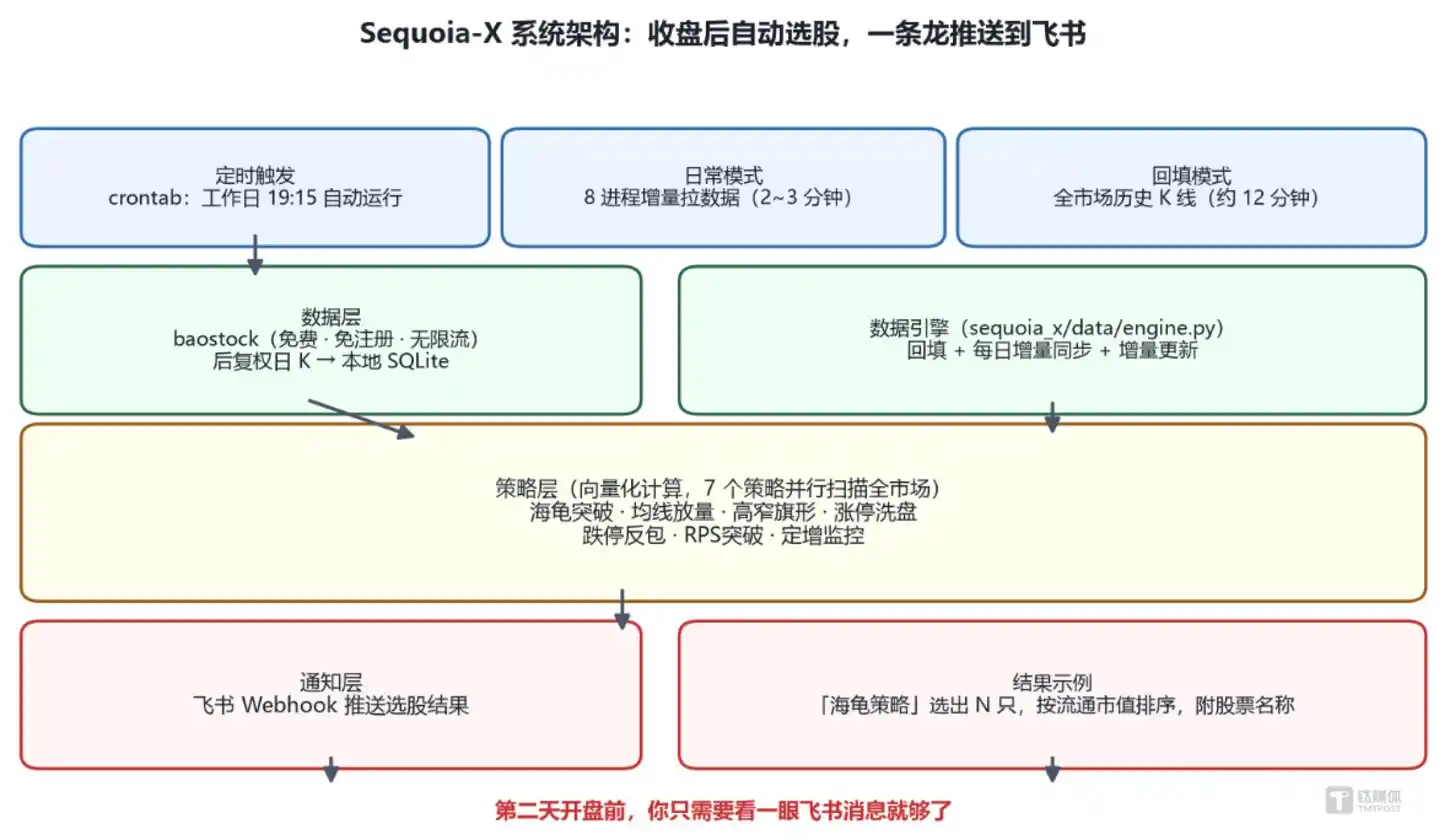
▲ System Architecture: The complete assembly line from data to push
The entire system is divided into three layers:
The data layer is the foundation. It pulls post-adjusted daily K-lines from baostock. Post-adjusted prices are benchmarked to the latest price; after rights and dividends adjustments, historical prices are proportionally adjusted. The benefit: when appending a new day's K-line, the new data maintains the same price basis as existing data in the database, avoiding isolated daily jumps. Thus, each day only requires adding the single new K-line, without re-pulling history: 8 processes run in parallel, incremental updates for the entire market take only 2-3 minutes. For comparison: a full re-pull takes over ten minutes; incrementally adding just one line per stock reduces data volume by a factor of over a hundred. "Initial full load, daily incremental" is the standard approach for local quantitative systems.
The strategy layer is the core. All 7 strategies perform vectorized calculations, using pandas' rolling windows for batch processing instead of looping through K-lines one by one. The code even explicitly prohibits "iterrows" as a performance red line. The reason for such rigor is simple: with over a million rows of data for the entire market, line-by-line Python loops would be agonizingly slow, while underlying C-language batch operations are dozens of times faster. Different coding approaches lead to vastly different performance—this is the hidden value of engineering capability in quant.
The notification layer handles the last mile. Each strategy can be bound to an independent Lark robot; Turtles push to the "Turtle" group, RPS pushes to the "RPS" group, each on its own track. The details are thoughtful: when pushing, the system queries baostock to retrieve the stock name—many similar projects only push a string of codes, leaving you to search for the company yourself. This kind of "finish the job" attention to detail is precisely the source of its reputation.
Choosing SQLite for storage is also pragmatic: a single-file database requiring no service installation, easy backup and migration—this "one person can maintain" lightweight approach fits personal projects perfectly.
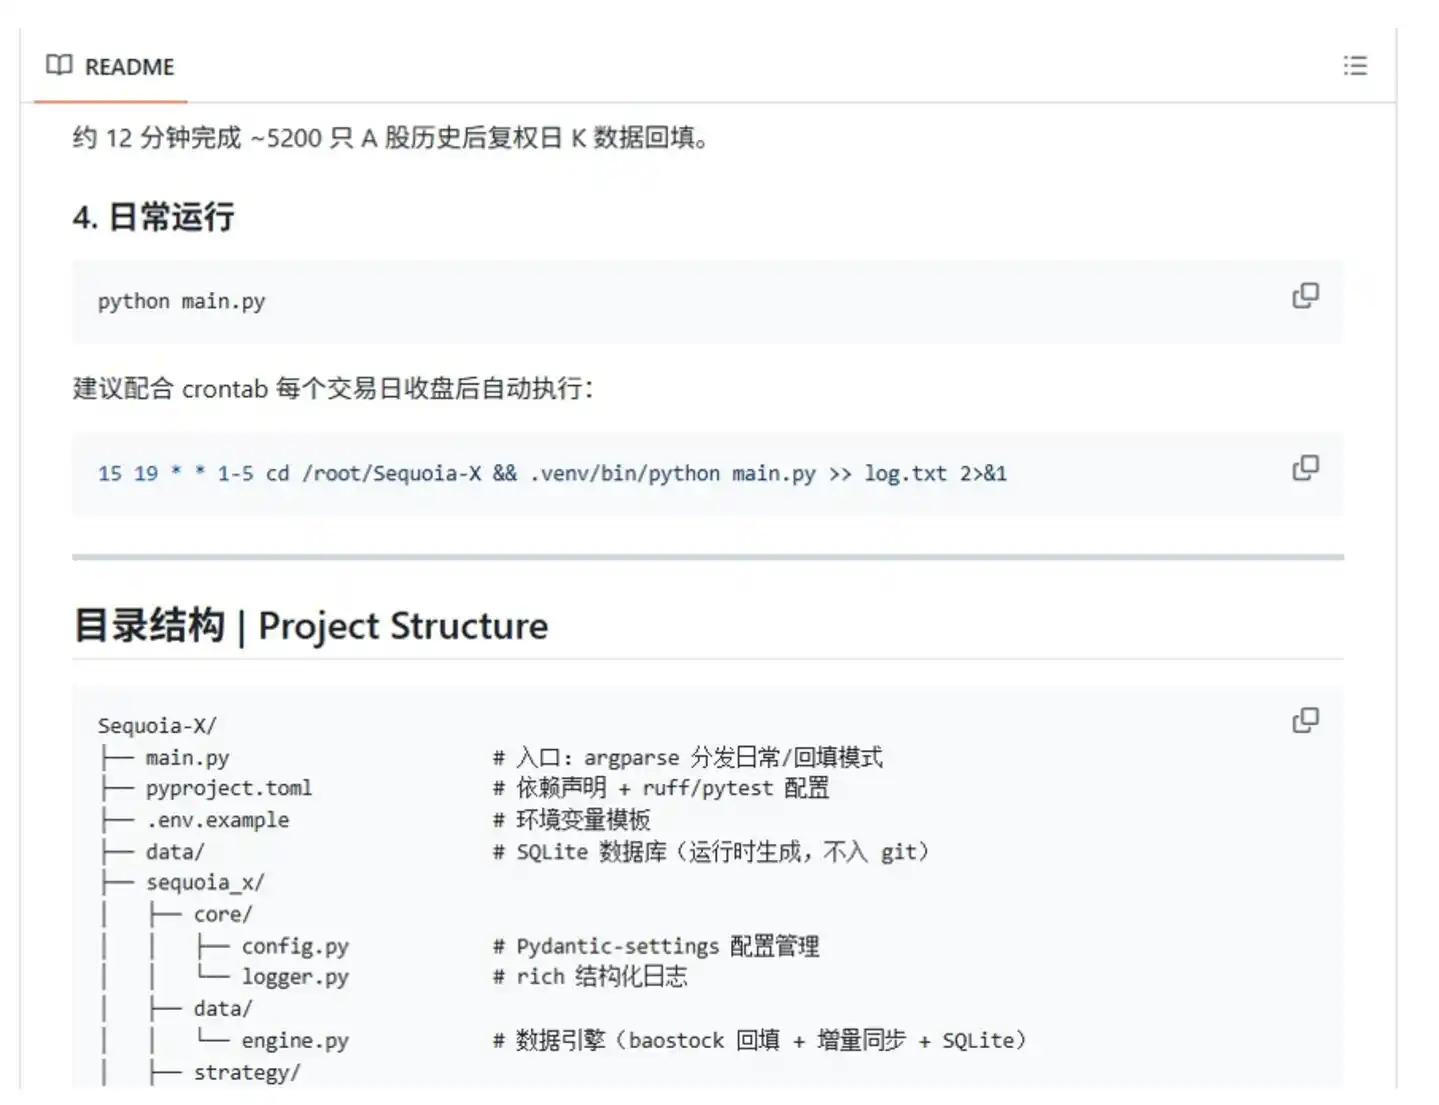
▲ README directory structure
The A-Share Adapted Version of Classic Tactics
Architecture is the skeleton; strategy is the soul.
First, the flagship strategy: Turtle Breakout. In 1983, legendary trader Richard Dennis made a bet: can trading ability be trained? Starting with $400, he built a fortune worth hundreds of millions during a commodity bull market. He recruited 13 people with diverse backgrounds—professional gamblers and complete novices—from ads in the Wall Street Journal, trained them for two weeks, and gave each a real trading account worth millions.
Four years later, the "Turtles" achieved an average annual return of around 80%, proving that great traders could be trained with rules. The secret: enter when the price breaks above the highest point of the past 20 days, exit when it falls below the lowest point of the past 10 days. No prediction, just following. In 2007, student Curtis Faith wrote "The Complete TurtleTrader," becoming an introductory text for countless quants.
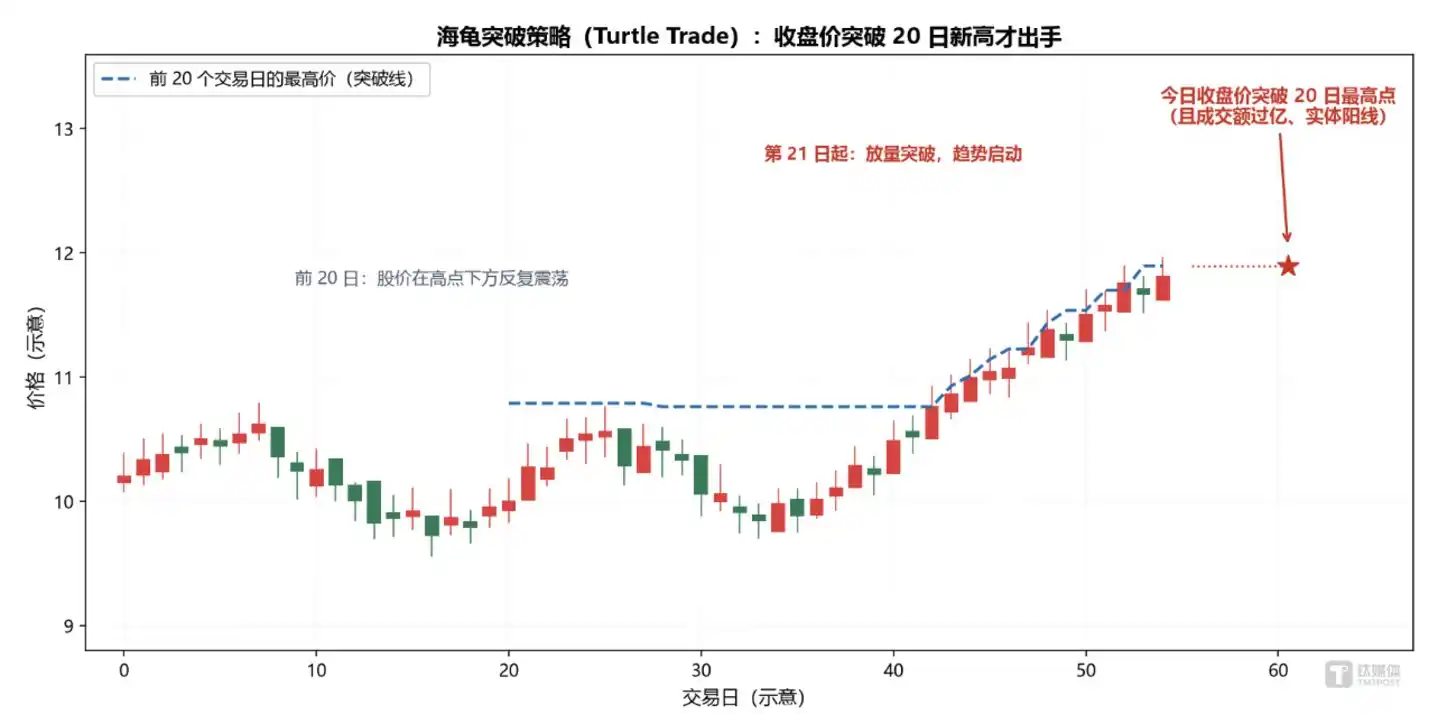
▲ Turtle Breakout: Closing price above the highest point of the past 20 days
Sequoia-X transplants these rules into the A-share market, adding three "defensive moves": Trading volume must exceed 100 million, ensuring liquidity; the daily candle must be a solid bullish candle, rejecting large bearish candles that gap up and close down; today's closing price must be higher than yesterday's, filtering out "false bullish candles" that surge intraday but fall back. Finally, sort by circulating market cap from largest to smallest, prioritizing large caps to reduce the risk of manipulation by hot money.
The code comments happen to record the origin of these defenses: "【New defensive condition】Reject Zhengzhou Coal & Electric-style large bearish candles that gap up and close down!"—clearly having been burned in practice, they wrote the lesson into the rule. Strategies aren't designed; they're forged by stepping on landmines.
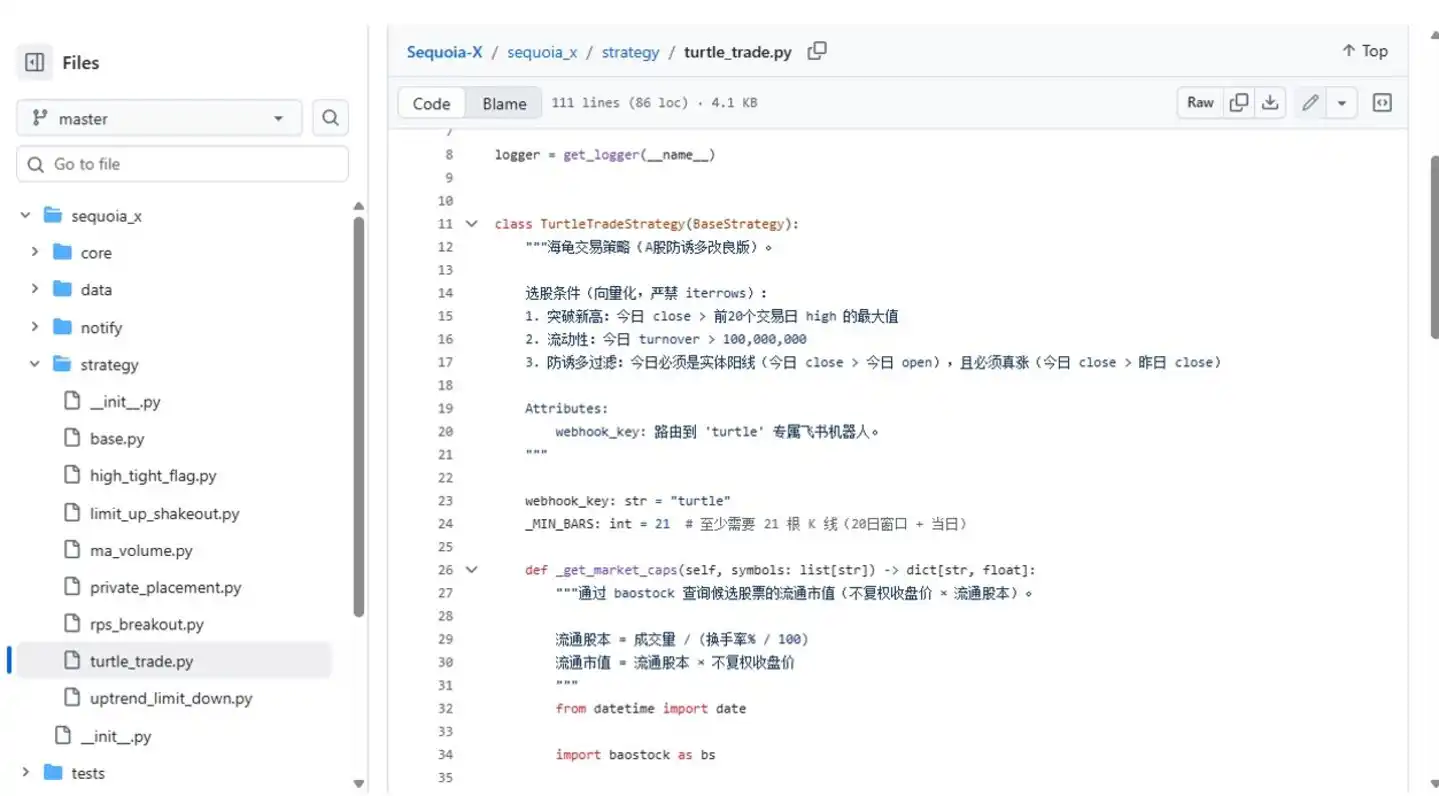
▲ Turtle strategy source code: Three core selection conditions
The remaining 6 strategies can be understood at a glance with this table:
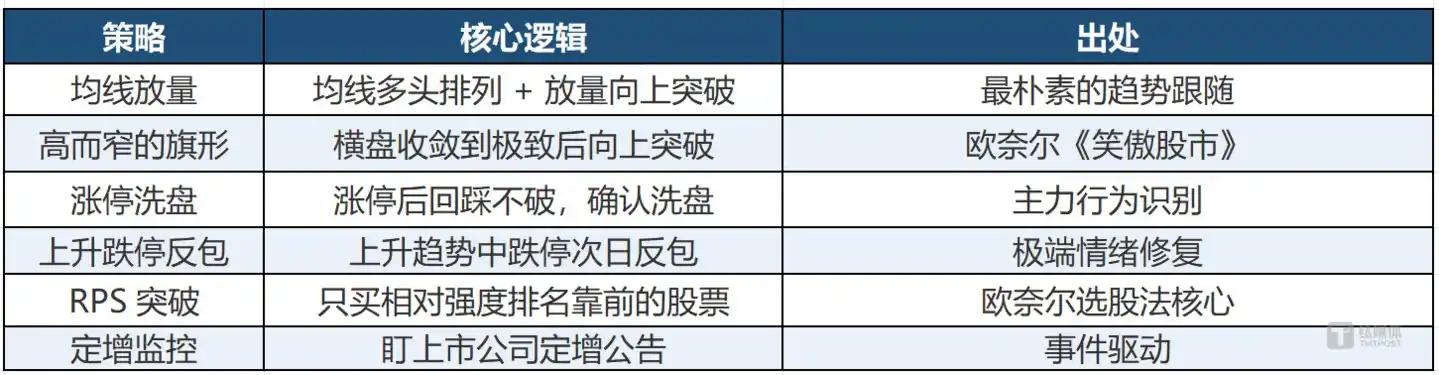
Among them, RPS Breakout is worth mentioning: originating from William O'Neil's "How to Make Money in Stocks," it only buys stocks with high relative strength rankings—those outperforming the market tend to continue doing so, embodying momentum thinking. Private Placement Monitoring, however, is not a technical pattern at all, but event-driven: watching announcements for signals. The 7 strategies cover four dimensions: trend, pattern, sentiment, and events, ensuring if one area is dim, another might shine.
You'll notice a pattern: none of these strategies predict "whether it will rise tomorrow"; they only answer one question—"who should we focus our attention on right now." Replacing "guess" with "filter" is precisely the fundamental difference between quantitative methods and trading based on gut feeling.
Three Steps to Get It Running: For Those Who Want to Get Hands-On
The entry barrier is lower than imagined; the only environment requirement is Python 3.10 or higher.
Step one, install dependencies. uv is recommended, one command does it:

Step two, configure push notifications. Copy .env.example to .env, fill in the Lark robot's Webhook address.
Step three, backfill data. Run python main.py --backfill to backfill historical data, then run python main.py daily to see results. Add a crontab scheduled task, and you won't even need to execute it manually:

Want to add your own strategy? It's not difficult either: inherit the BaseStrategy base class, implement a run() method that returns a stock list, then register it with one line in main.py, and you're done. The skeleton for data fetching, logging, and exception handling is all set up for you by the base class.
For industry insiders, it's also a "modern Python engineering exemplar": Configuration managed with Pydantic-settings, logging with rich for structured output, property-based testing with hypothesis, quality gates with ruff and pytest, dependencies locked with uv. AI's presence is even visible in the commit history—many commits are authored by claude. An experienced programmer plus an AI assistant sustains a 6,800-star project.
If you don't understand the code, that's okay too: data stored locally, strategies run automatically daily, results pushed to Lark—just think of it as a "stock screening assistant who works the night shift for you every day."
The popularity of Sequoia-X is less a victory of "stock selection" and more the convergence of three trends.
Trend one: The democratization of quant. Algorithmic trading is no longer exclusive to institutions; an ordinary computer and a free data source are enough to get started.
Trend two: The awakening of data sources. Free, unlimited APIs like baostock finally free individual developers from being repeatedly exploited over data.
Trend three: AI-assisted development becoming the norm. The collaborative division between the author and Claude exemplifies "one person being a whole team," and the over 6,800 Stars are votes of trust in this model.
Returning to the initial question: Why did it become popular? There are plenty of stock screening tools out there, each with its own rationale. But Sequoia-X offers a rare combination: free data source, transparent strategy logic, fully automated workflow, and source code you can modify yourself. It doesn't make decisions for you; it supplies the "information gap" and "discipline" needed to make decisions—and for retail investors, these two things are precisely the most expensive.
Finally, a practical word: Sequoia-X is a tool, not a money-printing machine. Technical patterns are games of probability; any strategy has periods of ineffectiveness. What it outputs is a "watchlist," not a "buy order." It's best to validate it with small positions for a while before increasing investment.
And discipline is precisely the scarcest resource in the hands of retail investors. ((This article was first published on Titanium Media APP, author | Silicon Valley Tech-news, editor | Jiao Yan))