Bitstar2
06/22 11:21
Bitcoin Price Analysis: The Daily Chart On the da
Bitcoin Price Analysis: The Daily Chart
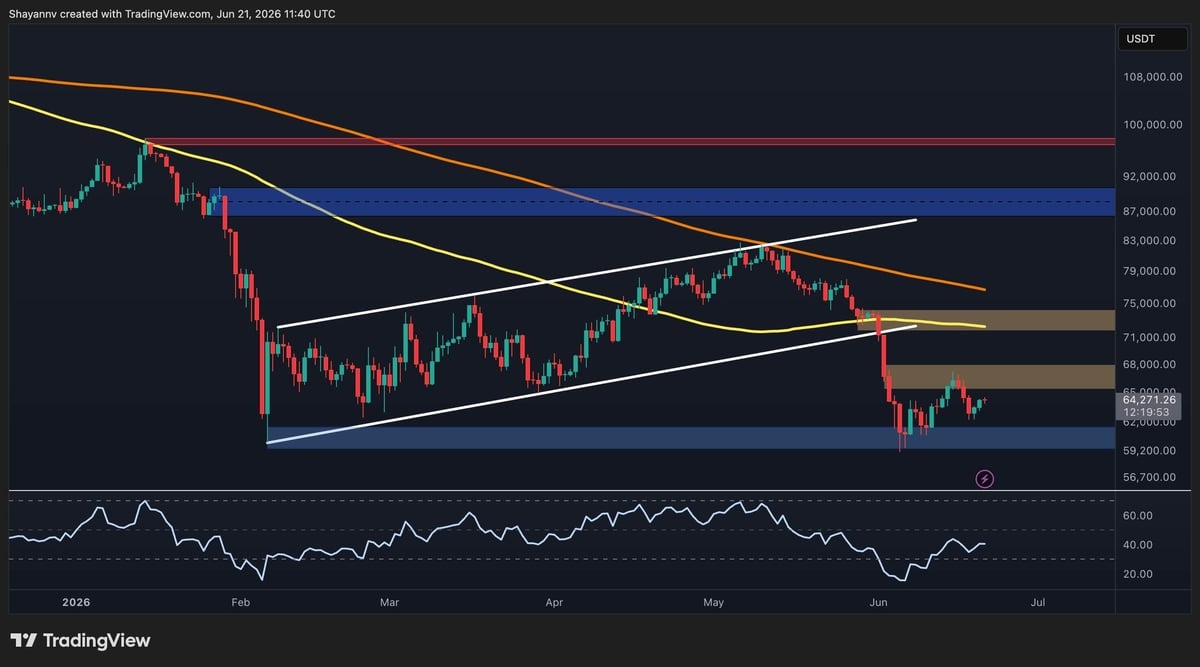
On the daily timeframe, $BTC recently confirmed a bearish breakdown below a large ascending channel, accelerating selling pressure and pushing the asset toward the major support zone around $60K, where buyers stepped in and halted the downtrend.
The selloff also drove Bitcoin well below both the 100-day and 200-day moving averages. These MAs are currently positioned around $72K and $76K, respectively. The loss of the 100-day moving average, which was supposed to act as a dynamic support level, signals a significant deterioration in the broader market structure and suggests that sellers continue to control the trend.
Following the sharp decline, $BTC found demand near $60K and staged a modest recovery toward the $64K region. However, the rebound remains relatively weak compared to the magnitude of the preceding drop.
The first major resistance now sits between $65K and $68K, where a previous support area has turned into supply. Above that, the more critical resistance zone is located around $72K to $75K, which coincides with the 100-day moving average and the lower boundary of the broken ascending channel. A successful reclaim of this area would be the first indication that the recent breakdown may have been a bear trap.
On the downside, the $60K region remains the most important support level. Losing this zone could expose Bitcoin to a deeper correction toward lower liquidity clusters and potentially trigger another wave of capitulation.
#HTX Creation Challenge — Post and Win 1,500U 💥 #World Cup Predictions: 100,000 USDT Daily #HTX Invites You to Share 600K USDT in Gift Packs
3Condividi
Tutti i commenti0RecentePopolare