Noorr
07/18 12:01
How high will XRP price go? The moving average co
How high will XRP price go?
The moving average convergence divergence indicator (MACD) produced a bullish cross as the XRP/USD trading pair validated a bull pennant on the weekly chart.
The MACD is a trend-following momentum indicator that measures the relationship between two exponential moving averages of the price. It is used to spot potential buy or sell signals, trend reversals and gauge the strength of price movements.
The MACD has produced a “bullish cross on XRP,” said Mikybull Crypto in an X post on Friday, adding:
“The real party is set to begin.”
The weekly relative strength index (RSI), suggests that the XRP has more room to run before reaching overheated levels, such as in the 2018 and December 2024 cycle tops.
“The RSI on the weekly chart is nowhere close to 2018,” said pseudonymous analyst CryptoHado in an X post on Friday, adding:
“We are in full price discovery mode.”
The bull pennant on the weekly chart projects a 305% rally in XRP price to $14.
Numerous analysts are convinced that XRP is on its way to double-digit prices, driven by institutional demand and other bullish technical setups.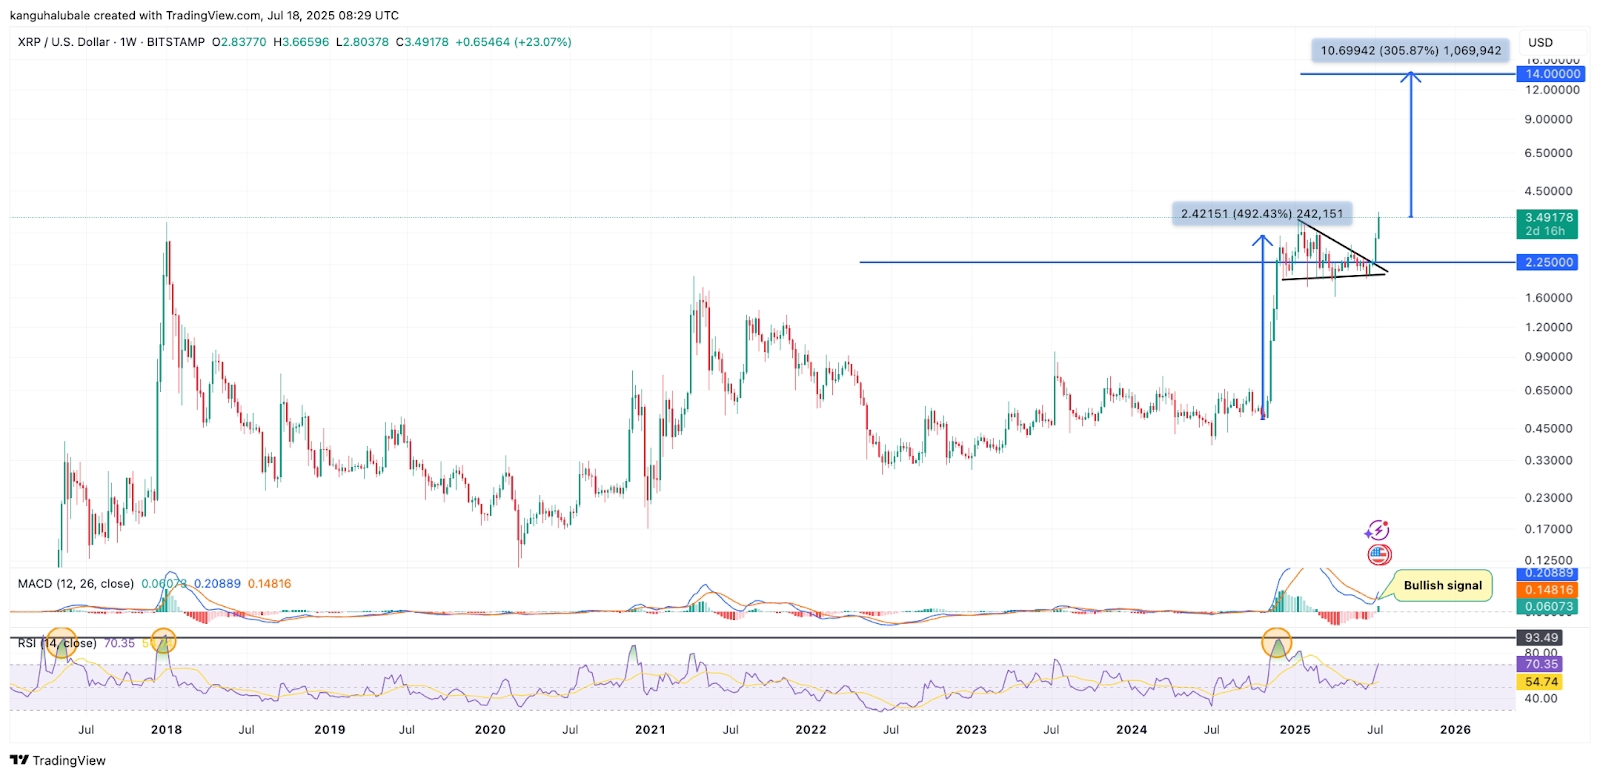
Tutti i commenti0RecentePopolare