

Crypto Express
07/10 03:56
AAVE vs. LDO charts compared
At the time of writing, the price structure comparison of 4-hour charts of the two showed that AAVE was in a constant uptrend.
This showed a bullish structure with higher highs and a clean trendline support, which indicated the strength of the price.
In the meantime, LDO was above its trendline but lost it, having a tough time rebounding. The MACD on AAVE was bullish, but for LDO was flat, showing indecision.
Of course, price isn’t just about structure; it’s also about sentiment.
AAVE gained 253% over the past 12 months, while LDO declined by 55%.
The former could increase its advantage, in case of trendline support, but in case of a breakdown, the correction could start. In the case of LDO, sentiment may move with the re-take of its trendline.
Therefore, as of press time, AAVE was in the lead, but it could soon decrease depending on the LDO replenishing structure or macro conditions changing.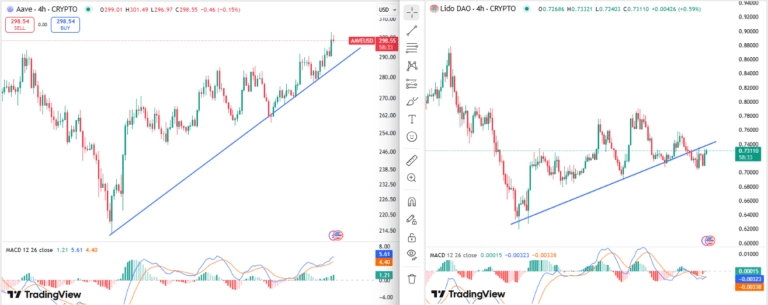
#Check In Weekly, Win Prizes Weekly — Join the Fun!#Share Your Thoughts on Popular Assets in June#Claim1,200 USDT in the Monthly Creation Challenge#Do you think DELOREAN is promising?# Israel’s attack on Iran.
84Condividi
Tutti i commenti0RecentePopolare
Nessuno storico