ria****@gmail.com
06/08 18:00
Dogecoin Reclaims 200-Day Average and Signals Stre
Dogecoin Reclaims 200-Day Average and Signals StrengthDogecoin is once again grabbing trader attention, but this time the charts are ringing familiar bells—ones we last heard back in 2021 before DOGE launched into a parabolic rally. Currently trading at $0.1849 after gaining over 5% in the last 24 hours and shedding about 2% in the past week, the meme-fueled favorite is under pressure. But beneath the surface of this selloff, technical setups are quietly aligning in a way that’s giving analysts déjà vu.
Volume has surged over 150% to nearly $2 billion, not from enthusiastic buyers, but from heavy sellers. While that might seem concerning, historical patterns suggest such washouts often precede trend reversals. RSI readings have dipped into deeply oversold territory, touching just over 6, and other volatility indicators like Bollinger Band Width and ADX confirm that DOGE is now in the eye of a high-energy storm. When volatility contracts again, sharp directional moves tend to follow.
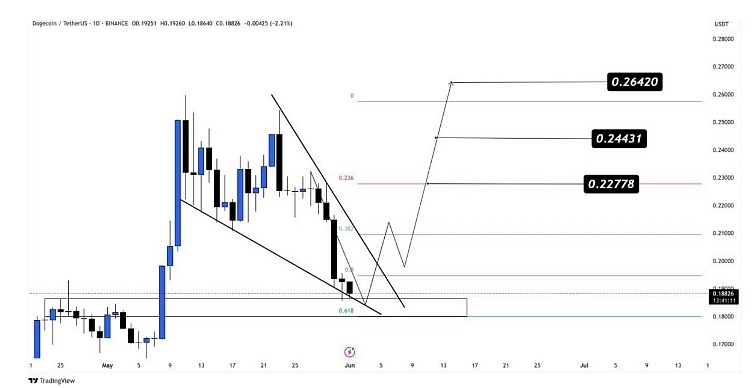
Traders are closely watching the $0.1665 support level, a key zone that lines up with the 0.618 Fibonacci retracement level—a historically strong springboard for DOGE. A bullish daily close above the 200-day moving average recently offered the first clue that sentiment may be shifting. Some indicators, like the Williams Percent Range and Hull Moving Average, suggest that a fresh wave of bullish momentum is forming underneath the surface.
Chart analysts, such as CryptoSwan777 and Ozz, are leaning into the bullish Dogecoin price prediction scenario. CryptoSwan sees a potential rally to $0.34, while Ozz charts a bullish ascending channel that could send DOGE toward $0.80 if the structure holds. Meanwhile, CryptoELITES isn’t shy about calling for $5 long term, assuming market conditions mirror those of the 2021 boom.
The current consolidation zone between $0.16 and $0.18 may be the breeding ground for the next meme coin mania. It’s the same quiet-before-the-storm pattern we saw before Elon’s tweets and Wall Street bets sent DOGE to the moon. With ETF chatter growing louder and high-timeframe structures flashing green, Dogecoin price prediction might just be gearing up for its next legendary move.
Tutti i commenti0RecentePopolare