Polygon Price Prediction for 2026–2032: Will POL Soon Recover Its All-Time High?

cryptonews.ruPublished on 2026-10-12Last updated on 2026-10-12

Abstract

This article presents a price forecast for Polygon's native token, $POL, for the years 2026 to 2032. The current price is noted as approximately $0.1, with the token facing bearish pressure. Technical analysis indicates a potential short-term correction to $0.09262 but suggests buyers are attempting to push the price toward $0.1, with key resistance at $0.11111 and support at $0.09574. For 2026, the price is projected to reach a maximum of $0.28. The forecast extends to 2032, where the maximum price is expected to be $1.19, contingent on market conditions and adoption. The analysis considers Polygon's technological advantages, such as high transaction throughput and lower costs compared to competitors, alongside strategic partnerships with companies like Starbucks, Adidas, and Mastercard as positive long-term factors. The report includes specific monthly and yearly projections, with a detailed price history from 2019 through 2026, highlighting past volatility and key market events. It concludes that while $POL faces competition, its ecosystem development makes it a potentially viable long-term investment.

Key Takeaways:

  • The price of $POL faces bearish pressure towards $0.1.
  • The Polygon price forecast for 2026 suggests the $POL price will rise to $0.28.
  • By 2032, we expect the maximum $POL price to be $1.19.

Polygon, an Ethereum sidechain and Layer-2 scaling solution, has experienced significant growth in popularity among enterprises and industries over the past year. As a result, many analysts eagerly await the future valuation of its native cryptocurrency, $POL. The question arises: Can the $POL price reach $1?

This Polygon price forecast examines factors such as ecosystem trends, adoption rates, underlying technology, and technical analysis to project the $POL price prediction for the period from 2026 to 2032.

Overview

Cryptocurrency Polygon
Ticker $POL
Rank 58
Current Price $0.1
24H Price Change +4%
Market Capitalization $982.8 million
Circulating Supply 10.56 billion $POL
24h Trading Volume $72.25 million (+26.4%)
All-Time High $1.29, March 14, 2024
All-Time Low $0.08142, April 13, 2026

$POL Price Forecast: Technical Analysis

Metric Value
Current Price $0.1051
Price Forecast $0.09262 (-10.63%)
Fear & Greed Index 69 (Greed)
Market Sentiment Neutral
Volatility 6.92% (High)
Green Days 17/30 (57%)
50-Day SMA $0.1034
200-Day SMA $0.08965
14-Day RSI 48.47 (Neutral)

Polygon Technical Analysis: $POL Price Experiences Bullish Pressure Towards $0.1

  • $POL price analysis shows a bullish trend towards $0.1
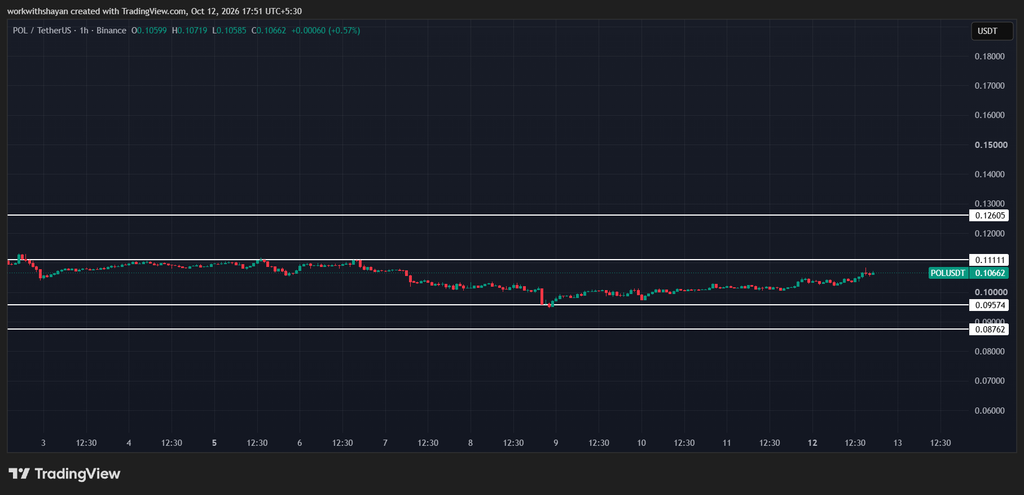
  • Resistance for $POL is observed at $0.11111
  • Support for $POL/USD is observed at $0.09574

The $POL price analysis for October 12 confirms increased volatility amid a move towards the $0.1 mark. Buyers are currently aiming for a bullish rally.

$POL Price Analysis on Daily Chart: Polygon Experiences Buyer Pressure Around $0.1

The $POL price shows an uptick thanks to buyer activity pushing the price towards $0.1. $POL is seeking consolidation near immediate resistance levels, preparing to hold above $0.1. The 24-hour trading volume has increased to $10.2 million, indicating heightened trading activity. The $POL price is $0.1, showing a gain of over 4% in the last 24 hours.
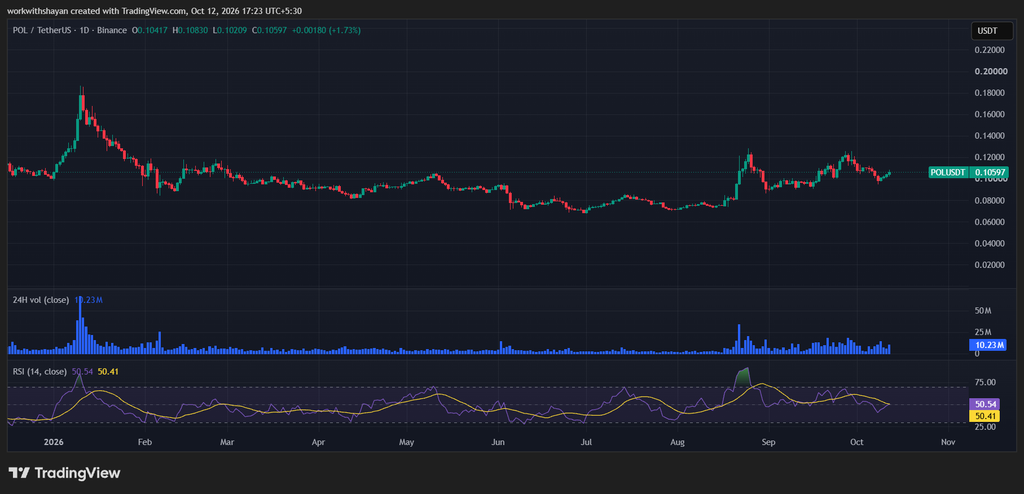
POLUSDTchart by TradingView

The RSI-14 trend line has risen from its previous level and sits above the midline around the 50 mark, indicating buyers' efforts to control price momentum. The SMA-14 level suggests volatility in the coming hours.

$POL/USD 4-Hour Price Chart: Bulls Aim to Hold Price Above EMA Trend Lines

The 4-hour $POL price chart suggests that $POL continues to experience bearish activity around the EMA lines, creating a negative sentiment on the price chart. As the price continues to face resistance near Fibonacci levels, bulls are preparing for dominance, holding the price above the EMA20 trend line.
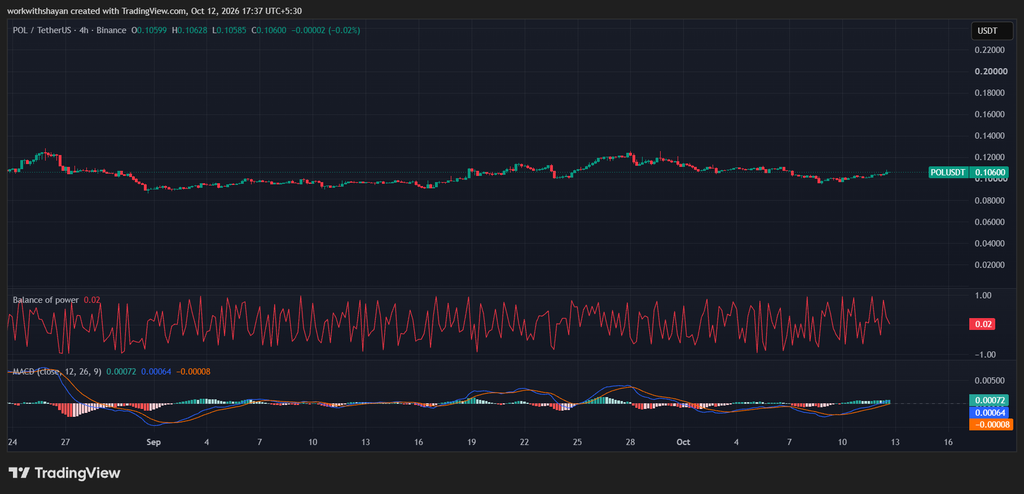
POLUSDTchart by TradingView

The BoP indicator is trading in positive territory at 0.02, hinting that buyers are attempting to create pressure near resistance levels and enhance the upward correction.

Furthermore, the MACD trend line has formed green candles above the signal line, and the indicator is aiming for a positive dynamic, reinforcing bullish positions.

$POL Technical Indicators: Levels and Actions

Daily Simple Moving Average (SMA)

Period Value Action
SMA 3 $0.1019 BUY
SMA 5 $0.1012 BUY
SMA 10 $0.1048 BUY
SMA 21 $0.1087 SELL
SMA 50 $0.1034 BUY
SMA 100 $0.09147 BUY
SMA 200 $0.08965 BUY

Daily Exponential Moving Average (EMA)

Period Value Action
EMA 3 $0.1025 BUY
EMA 5 $0.1028 BUY
EMA 10 $0.1045 BUY
EMA 21 $0.1054 SELL
EMA 50 $0.1015 BUY
EMA 100 $0.09637 BUY
EMA 200 $0.1007 BUY

What to Expect from the $POL Price Analysis Next?

The hourly chart confirms that bears are making efforts to prevent an immediate $POL price rise. However, if the $POL price successfully breaks above the $0.11111 level, it could rise further and reach resistance at $0.12605.
POLUSDTchart by TradingView

If bulls fail to initiate an uptrend, the $POL price could fall below the nearest support line at $0.09574, leading to a correction to $0.08762.

Is $POL a Good Investment?

The $POL token could be a good long-term investment option as the project develops its roadmap for the Polygon 2.0 version. Polygon is collaborating with various industries to enhance adoption levels, focusing on $NFT solutions and Ethereum scalability. Partnerships include Starbucks for an $NFT loyalty program and collaborations with Adidas, Prada, and Disney for developing $NFT offerings.

Why Is the $POL Price Rising Today?

Following overall market volatility, the $POL price faced intensified buyer pressure around the $0.1 level. Consequently, buyers are holding the price around $0.1.

What Is the $POL Price Prediction for 2026?

The Polygon price forecast for 2026 suggests that the $POL price will reach a maximum level of $0.28.

Will the $POL Price Touch $1?

Yes, the $POL price could reach the $1 mark by the end of 2032. However, this depends on future market sentiment and buyer demand.

Will the $POL Price Reach $10?

If everything goes well and $POL gains regulatory recognition, its price could exceed $10 by 2040.

Is $POL a Good Long-Term Investment?

As Polygon continues to expand its offerings, it holds a significant position in the altcoin market. Consequently, $POL could be a good long-term investment option.

Latest News / Opinions on $POL

Polygon partners with Mastercard to launch Agent Pay, aiming to simplify operations for machines by introducing structure, governance, and trust to this new payment class.

$POL Price Prediction for October 2026

Analysts expect steady growth in the crypto market in October. We forecast that the minimum $POL price will be $0.07, the maximum $0.13, and the average $0.1 in October.

$POL Price Prediction Potential Low Potential Average Potential High
$POL Price Prediction for October 2026 $0.07 $0.1 $0.13

$POL Price Prediction for 2026

Ethereum fees surge dramatically during a bull market, making them too expensive for regular crypto users. That's why Polygon gained popularity during the last bull market. But this time, in 2026, Polygon faces tougher competition from Arbitrum, Optimism, and Starknet.

However, Polygon's Proof of Stake (PoS) network can handle up to 65,000 transactions per second (TPS) and is cheaper than networks like Arbitrum and Optimism. Consequently, growing adoption could lead to its price increasing in 2026.

In 2026, the Polygon price is projected to reach a minimum level of $0.07. It is expected to reach a maximum level of $0.28, with an average price of $0.22 throughout the year.

$POL Price Prediction Potential Low Potential Average Potential High
$POL Price Prediction for 2026 $0.07 $0.22 $0.28

$POL Price Predictions for 2027-2032

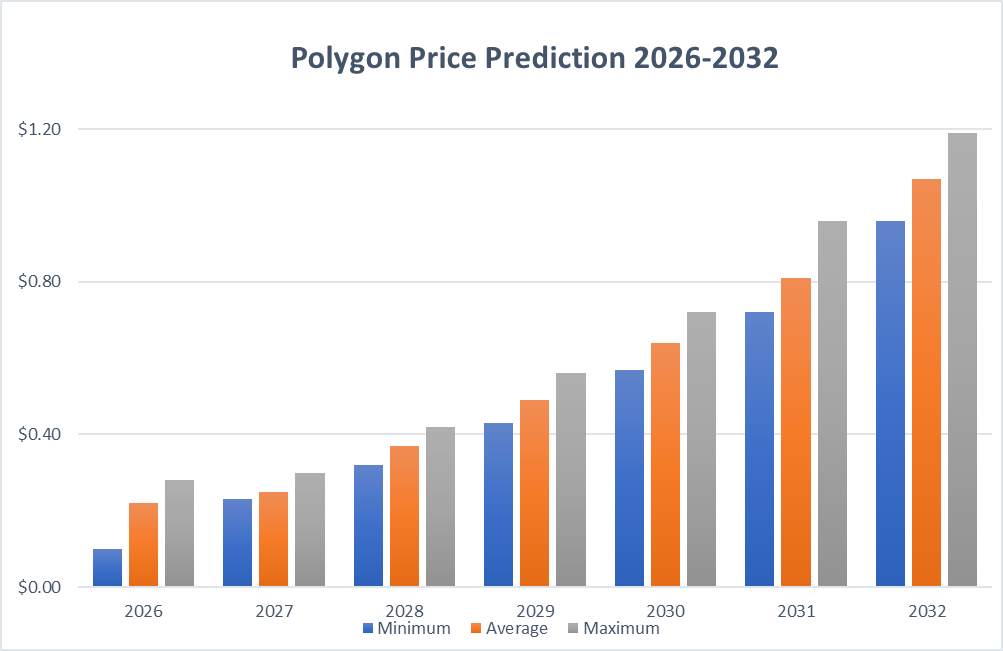
Year Minimum Price Average Price Maximum Price
2027 0.23 0.25 0.3
2028 0.32 0.37 0.42
2029 0.43 0.49 0.56
2030 0.57 0.64 0.72
2031 0.72 0.81 0.96
2032 0.96 1.07 1.19

Pol Price Prediction for 2027

Polygon has made Polygon zkEVM available to everyone, becoming one of the first ZK Rollups to do so. This is a major step forward for Polygon and gives it an advantage.

With growing business usage, innovative technology, and past success, Polygon could reach a new all-time high in 2027.

According to forecasts and technical analysis, the Polygon price is expected to reach a low of $0.23 in 2027. The maximum price projection is $0.30, with an average of $0.25.

Polygon ($POL) Price Prediction for 2028

In 2028, the minimum price of one Polygon is expected to be $0.32. The maximum $POL price projection is $0.42, and the average price for the year will be $0.37.

Polygon Price Prediction for 2029

In 2029, the Polygon price is forecast to reach a minimum of $0.43. The maximum price could rise to $0.56, and the average trading price during the year will be $0.49.

Polygon Price Prediction for 2030

In 2030, the minimum Polygon price is expected to be $0.57. The highest possible $POL price level could reach $0.72, and the average forecast price is $0.64.

Polygon ($POL) Price Prediction for 2031

In 2031, the Polygon price is expected to reach a low of $0.72. The maximum projection is $0.96, and the average trading price is $0.81.

Polygon Price Prediction for 2032

In 2032, the Polygon price is forecast to reach a minimum of $0.96. The maximum price could rise to $1.19, and the average trading price during the year will be $1.07.
$POL Price Prediction for 2026-2032

$POL Price Prediction from Experts

Company Name 2026 2027
Coincodex $0.3294 $0.2629
CoinDCX $0.42 $0.5

$POL Price Prediction from Cryptopolitan

Cryptopolitan is optimistic about the future market potential of $POL. In 2026, the Polygon price is expected to reach a minimum level of $0.07. The maximum level is expected to be $0.28, with an average price throughout the year of $0.22.

By the end of 2032, the $POL price is expected to rise to a high of $1.19, with an average trading price of $1.07.

$POL Historical Market Sentiment
$POL Price History | Coinmarketcap
  • $POL debuted in 2019, initially priced below a cent.
  • For the next two years, the price remained stable around $0.02.
  • The rebranding of $POL to Polygon in 2021 fueled growth: the price exceeded $1 in May and reached an all-time high of $2.92 on December 27.
  • In 2022, $POL struggled: the price fell below $1 in May, below $0.50 in June, briefly recovered above $1 in August, and ended the year at $0.7585, down 70%.
  • The following year, 2023, Polygon showed mixed results: the price exceeded $1 in February but fell to $0.5593 after news from Crypto.com in June. In July, it peaked at $0.8775, declined to $0.4946 in September, and recovered to $0.9789 by November.
  • In January, $POL rose from $0.8514 to $1.4 in March but fell below $0.8 by May, reaching a low around $0.4 in June and July. In August and September, the price consolidated in the $0.4–$0.6 range, briefly rising above $0.45.
  • In October, the price dropped to $0.39, but in November, following Donald Trump's victory, it surged sharply to $0.63, ending December on bearish ground at $0.477.
  • At the beginning of January 2025, $POL opened the market at $0.4511; in February, the price fluctuated in the $0.3068–$0.3455 range.
  • However, by the end of February, the $POL price had dropped to around $0.25.
  • In March, the $POL price fell sharply, dropping below the crucial $0.2 level.
  • In April, the $POL price continued to fluctuate below $0.2. However, as the trade war between the US and China eased, the $POL price broke through resistance levels and reached a high of $0.26 by the end of April.
  • In early May, the Polygon price dropped slightly, falling to $0.21. However, later in mid-May, it surged sharply to a high of $0.27.
  • In early June, the $POL price dropped sharply to the $0.2 level. By the end of June, the $POL price had fallen to $0.17.
  • In July, the $POL price rose to $0.26, but in early August, it dropped sharply to $0.19.
  • The $POL price rose to $0.26 in August. However, later in September, it consolidated around the $0.25 level.
  • In early October, the Polygon price rose to a high of $0.25. The $POL price ended the month on bearish ground around $0.17.
  • By the end of November, the $POL price had fallen to $0.12.
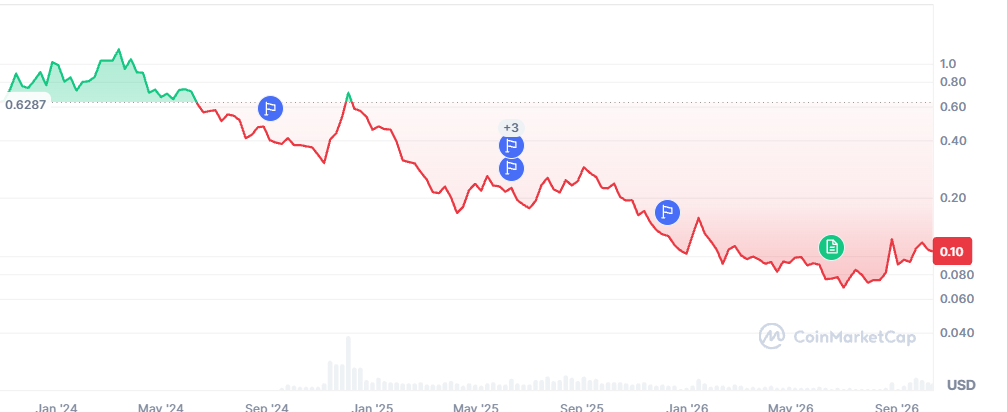
  • The $POL price ended 2025 on bearish ground, falling to the $0.1 level.
  • In January 2026, the $POL price fell further, reaching a low around $0.08 in February. In early April, the price fluctuated around $0.09. By the end of April, the $POL price had risen to $0.1.
  • In May, the $POL price fell to $0.088.
  • By the end of June, the Polygon price had fallen to $0.08. In July, the $POL price fluctuated around $0.08.
  • In August, the $POL price rose to $0.13. In September, the price fluctuated around $0.12.

Related Questions

QAccording to the article, what is the price forecast for $POL in the year 2026?

AThe price forecast for $POL in 2026 is a maximum of $0.28, with a minimum of $0.07 and an average of $0.22.

QWhat is the projected maximum price for $POL by the year 2032 based on the analysis?

ABy 2032, the projected maximum price for $POL is $1.19, with an average trading price of $1.07.

QWhat does the technical analysis suggest about the current price movement of $POL near the $0.1 level?

AThe technical analysis suggests that the $POL price is experiencing bullish pressure towards the $0.1 level, with buyers actively pushing the price up and encountering resistance near $0.11111.

QName two major partnership deals mentioned in the article that Polygon has secured.

AThe article mentions that Polygon has partnered with Mastercard to launch Agent Pay, and with Starbucks for an NFT loyalty program. It also mentions collaborations with Adidas, Prada, and Disney for NFT offerings.

QWhat was the all-time high (ATH) price for $POL and when was it achieved according to the article?

AThe all-time high price for $POL was $1.29, achieved on March 14, 2024.

Related Reads

Circle Partners With DBS to Expand Institutional USDC Access Across Asia

Circle, the issuer of the USDC stablecoin, has partnered with Singapore-based DBS Bank to expand institutional access to USDC across Asia. Announced on November 18, the agreement allows eligible institutional clients to mint and redeem the dollar-backed stablecoin directly through DBS, with near-instant settlement between US dollars and USDC available 24 hours a day. This gives institutions another way to access USDC without relying entirely on cryptocurrency exchanges and other secondary-market liquidity providers, supporting corporate treasury operations, payment settlement and liquidity management. Institutions can convert between dollars and USDC without being restricted by conventional banking hours or payment cut-off times. Access is limited to eligible institutional clients rather than retail customers. The agreement builds on DBS and Circle's participation in Project BLOOM, an industry initiative led by the Monetary Authority of Singapore focused on developing infrastructure for the safe and scalable use of tokenised money. DBS reported that 88% of large corporations surveyed were already deploying or piloting tokenised money applications, with more than three in five adopting or planning to adopt stablecoins. Evy Theunis, head of digital assets at DBS's Institutional Banking Group, said the partnership would give institutions more choice in managing and transferring value, while Circle Chief Commercial Officer Kash Razzaghi said it would help expand institutional access to USDC across Asia. Transaction limits, fees and a detailed country-by-country rollout schedule were not disclosed.

TheNewsCrypto1m ago

Circle Partners With DBS to Expand Institutional USDC Access Across Asia

TheNewsCrypto1m ago

From Crypto VC to Traditional VC: The Three Essential Capabilities of Venture Capital

In this article, Big Brain Holdings investor Derrick Cui reflects on his transition from crypto venture capital to traditional VC in AI, reindustrialization, and space, contrasting crypto's short liquidity cycles and narrative-driven token prices with traditional VC's decade-long capital lockups and illiquid equity. He explains why LPs still allocate to venture despite poor average returns and illiquidity: each year produces rare companies capable of returning an entire fund; business success defies checklists, rewarding subjective judgment; consensus is often wrong, so non-consensus bets offer asymmetric upside; and top investors can repeatedly generate excess returns across cycles. He describes the investor's job as deal sourcing, diligence, and pitching, noting AI tools have lowered sourcing barriers but顶级 deals still come from genuine relationships, and that likability is an underrated professional asset. He then details three core capabilities: (1) Data—separating verifiable facts from founder promises, using third-party validation to pierce polished narratives; (2) Context—building comparative, industry-wide knowledge to judge talent and technical bottlenecks, now accelerated by reasoning models that shift the key skill from reading papers to asking higher-quality questions; and (3) Storytelling—constructing a rigorous "Right to Win" narrative that explains why a company prevails across multiple possible futures, sometimes via systematic cluster bets (e.g., SMRs for AI energy demand) rather than single-company wagers. He also admits past mistakes: being "nerd-sniped" by technical brilliance that doesn't equal a great business, chasing non-consensus ideas for their own sake, and rejecting the "spray and pray" mentality. Finally, he warns that fundraising incentives—DPI substitutes, markups, co-investment halo, hot-round chasing—can distort investment decisions, and concludes that VC is a trainable skill built on data capture, better questions, and credible winning narratives.

marsbit16m ago

From Crypto VC to Traditional VC: The Three Essential Capabilities of Venture Capital

marsbit16m ago

Research Report Interpretation | Space Fund Scale Grew to $18 Billion in One Year, but In-Orbit Direct Investment Accounts for Only 3%

Barclays analysts Katherine Ogundiya and team published a 61-page report on November 16 introducing an "in-S.P.A.C.E." framework for the in-orbit economy, screening 37 commercial space activities down to 15 priority areas and 3 wildcard sectors. Global space-themed fund assets grew from $1.24 billion in Q2 2024 to over $18 billion by Q2 2026, yet only 3% is directly invested in in-orbit operations, while 47% sits in semiconductors, components, and software. Private markets are more direct: of 33 space unicorns worth about $92 billion, 9 in-orbit operators account for roughly $26 billion, or 28%. Global government space spending reached $141 billion in 2025, up 7.4%. The report identifies five physical bottlenecks—launch concentration, spectrum and network routing, orbital congestion, in-orbit servicing standards, and regulatory approval—noting China and the U.S. accounted for over 82% of orbital launch attempts from 2024 to July 2026, with SpaceX and CASC together near 71%, and Starlink performed over 207,000 collision-avoidance maneuvers between December 2025 and May 2026. Among the highest-scoring priority tracks, GEO satellite life extension offers clear economics: about 85% of GEO satellites retire from fuel depletion, and extending life five years costs roughly $65 million versus $150–300 million for a replacement. Orbital AI computing and data centers scored only 8, ranking as a wildcard due to unresolved thermal, power, and economic challenges. Barclays maps over 350 companies across four investment paths: integrated launch and space systems players like Rocket Lab (RKLB) and Firefly (FLY), bottleneck-breaking specialists such as Astroscale, MDA Space, Mynaric, and Thales, "picks and shovels" suppliers including Linde (LIN) and Air Liquide, and downstream applications like Planet Labs (PL) and AST SpaceMobile (ASTS). A heavy-lift rocket launch now consumes about 8,000 tonnes of liquid oxygen, five times a traditional large rocket's 1,600 tonnes, with Linde projecting about $1 billion in annual space revenue by 2030.

marsbit1h ago

Research Report Interpretation | Space Fund Scale Grew to $18 Billion in One Year, but In-Orbit Direct Investment Accounts for Only 3%

marsbit1h ago

The AI Bubble Has Already Burst, Yet Retail Investors Are Still Frantically Buying the Dip: A Hedge Fund Veteran Warns Nvidia's Risks Are Far From Over

Former hedge fund trader Tom Thornton warns that the AI bubble has already burst, yet retail investors remain trapped in "buy the dip" muscle memory while institutions steadily reduce tech exposure. He points to record single-week inflows into QQQ (~$13.4 billion) even as prices fell—a classic topping pattern where dip-buying eventually fails and confidence collapses. Thornton argues AI's boom rests on a fragile chain of circular financing deals that must unfold perfectly; several links are already cracking. On Nvidia, he stresses that DOJ and congressional investigations aren't short-term noise—any evidence of knowingly bypassing export controls could trigger criminal, not just civil, liability and hammer the business model and valuation. He expects management to spin earnings positively, but even a slight guidance cut could crush the stock and wash out retail dip-buyers, making 2027 a tougher year for markets. Thornton is watching DeMark indicators on the Nasdaq 100 and Mag 7 for true capitulation, noting defensive sectors like staples and utilities are now flashing sell signals. He remains long gold, has started buying silver and gold miners (GDX), is baffled by Anthropic IPO valuations, exited Alibaba on Nvidia-related news, would short a SpaceX-Tesla merger on antitrust grounds, and says the ultimate contrarian buy signal is a front-page photo of a floor trader with his head in his hands.

marsbit1h ago

The AI Bubble Has Already Burst, Yet Retail Investors Are Still Frantically Buying the Dip: A Hedge Fund Veteran Warns Nvidia's Risks Are Far From Over

marsbit1h ago

World Bank Joins Forces with Citi and Circle: Global Aid Funds Poised for On-Chain Settlement via USDC

On November 18, the World Bank Group announced a strategic collaboration with Citi and Circle to explore using the regulated USD stablecoin USDC and blockchain networks to supplement existing cross-border official development assistance (ODA) disbursement systems. The pilot aims to reduce correspondent banking fees, shorten cross-border settlement times, and enhance transparency, starting with borrower countries where digital asset use is legally permitted. Under the division of roles, Circle provides compliant stablecoin infrastructure, minting and clearing USDC on designated blockchains with each token backed 100% by USD cash and short-term Treasuries. Citi leverages its global treasury and trade finance network to bridge traditional fiat payment rails and blockchain networks, validating settlement models interoperable with central banks and local banking systems while ensuring sovereign funds remain fully regulated. Traditional ODA flows rely heavily on SWIFT and多层 correspondent banks, with infrastructure projects in developing countries often routed through three to four intermediary banks, taking three to five business days per transfer, incurring high fees, FX spread losses, and delays from time-zone mismatches and manual reviews. Regulated stablecoin settlement enables near-real-time peer-to-peer on-chain delivery after compliance approval, cutting intermediary layers and sending funds directly to licensed institutions in borrower countries. The initiative builds on the World Bank's FundsChain consortium blockchain, which as of November 18 has connected over 350 sovereign and multilateral development projects across 96 countries, averaging about 3.6 on-chain projects per recipient country. Every transaction—from initial disbursement to treasury receipt to supplier settlement—is recorded on-chain in real time, allowing donors and auditors to verify usage and prevent fund diversion. This marks the first time a core multilateral development institution has formally introduced a regulated stablecoin in sovereign development aid disbursement alongside a major international bank, setting a benchmark for institutional RWA settlement and cross-border payment infrastructure. Next steps include joint testing on central bank FX and digital asset regulatory exemptions, technical standards for commercial bank clearing node access, and automated reconciliation between on-chain stablecoin flows and the FundsChain ledger.

marsbit1h ago

World Bank Joins Forces with Citi and Circle: Global Aid Funds Poised for On-Chain Settlement via USDC

marsbit1h ago

Trading

Spot
活动图片