Author: FLAME LABS
Abstract
This research report aims to provide a comprehensive analysis of the core proposition of the Bitcoin market in the first quarter of 2026: After experiencing a sharp retracement from the historical high of approximately $126,000 in October 2025 to the current range of about $60,000 - $70,000, where exactly is the absolute bottom of this cycle? The current market is at a paradoxical crossroads: On one hand, the traditional "four-year halving cycle" theory suggests the market is still in a bearish interim, potentially requiring a cooling-off period lasting up to a year; on the other hand, the approval of spot ETFs, the shift in the Federal Reserve's monetary policy (and the subsequent uncertainty brought by personnel changes), and the iteration of mining hardware are reconstructing the underlying logic of the market.
This report abandons simple linear extrapolation and instead constructs a five-dimensional valuation model encompassing macro liquidity, miner survival costs (shutdown price), on-chain token distribution (STH and LTH game theory), technical structure (VPVR and 200WMA), and market sentiment (fear and greed). The analysis shows that although, from a historical time span perspective, the market may not yet fully meet the duration requirement for a "despair phase," from a price structure and cost basis perspective, the $52,000 to $58,000 range converges the miner shutdown price, the 200-week moving average, and the super high-volume node from 2024-2025, forming a structural bottom for this cycle with extremely high confidence.
The report not only validates the user's hypothesis about the "$72,000-$52,000 super turnover zone" but further refines the characteristics of capital behavior within this range and proposes a pyramid accumulation strategy based on probability theory for the current complex macro environment (the "Warsh Shock" brought by Kevin Warsh's nomination as Fed Chair).
1. Macro Narrative Restructuring: The Failure and Doubt of the Four-Year Cycle
1.1 The Dilemma of "Carving Marks on a Moving Boat": Linear Extrapolation of Historical Cycles and Reality Deviation
In the analytical framework of cryptocurrency assets, the "four-year cycle" theory based on Bitcoin's halving mechanism has long held a dominant position. This theory, based on marginal changes in supply and demand, posits that Bitcoin's price action exhibits a highly periodic rhythm: a狂暴 bull market arrives one year after the halving, followed by a year-long bear market correction, and finally two years of consolidation, bottoming, and recovery. If strictly following this historical script—i.e., a "carving marks on a moving boat" style analysis—the current market phase is indeed deeply concerning.
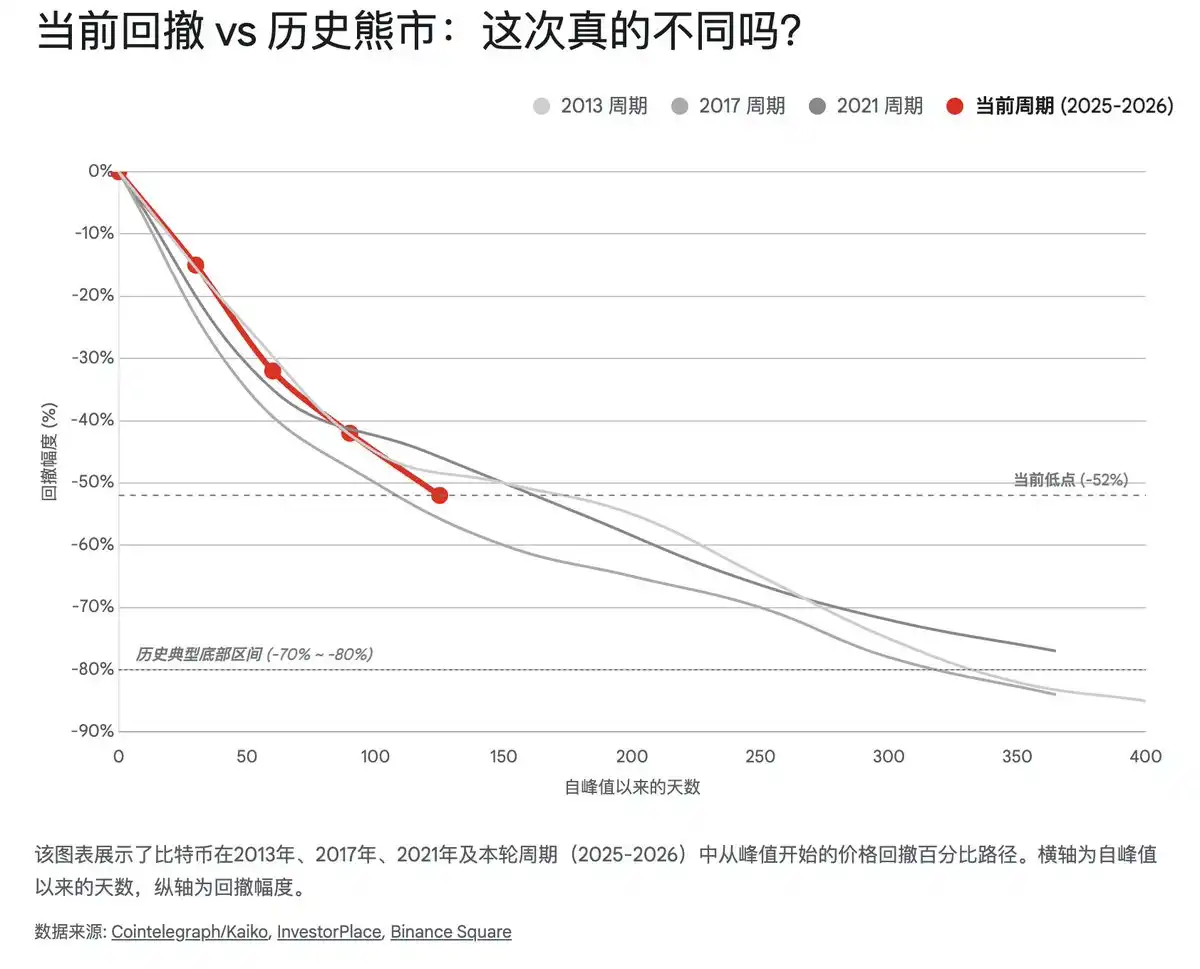
Looking back at historical data, the market peaks in 2013, 2017, and 2021 were often followed by unilateral declines lasting about 12 months, with maximum drawdowns typically exceeding 80%.
-
2014-2015 Bear Market: Price fell from $1,100 to below $200, a drop of about 85%, taking about 400 days.
-
2018 Bear Market: Price fell from $19,000 to $3,100, a drop of about 84%, taking about 365 days.
-
2022 Bear Market: Price fell from $69,000 to $15,500, a drop of about 77%, taking about 376 days.
As of February 2026, the Bitcoin price has retreated from its peak in October 2025 (approx. $126,000) to around $60,000, a decline of about 52%. Kaiko Research acutely pointed out that this 52% retracement is "abnormally shallow" compared to historical cycles. If strictly compared to the intensity of historical bear markets, typical bottoms are often accompanied by retracements of 60% to 68% or even deeper, which mathematically suggests that the price could potentially fall further to $40,000 or even lower. Furthermore, from a time dimension, only 4 months have passed since the peak in October 2025. According to the empirical rule of "bear markets lasting one year," the market might need to "grind" in the bottom area for another 4 to 8 months until the second half of 2026.
However, this simple linear extrapolation is facing unprecedented challenges. This cycle (2024-2026) exhibits significant structural heterogeneity, mainly reflected in two dimensions:
-
Institutional Anchor Points Introduced by ETFs: The approval of US spot Bitcoin ETFs not only brought incremental capital but, more importantly, changed the holder structure. Institutional capital (such as holdings in BlackRock's IBIT and Fidelity's FBTC) has stronger risk tolerance and longer investment duration compared to retail investors. Data shows that even when the price fell below the average cost basis of ETFs (around the $60,000-$64,000 range), ETFs did not see devastating net outflows; instead, they showed a "buy the dip" allocation characteristic. This institutional "bottom support" effect may significantly raise the market's pain threshold, making it difficult for the price to replicate crashes of over 80%.
-
Dominance Swap of Macro Factors: As Bitcoin's market capitalization surpassed the trillion-dollar mark, its asset attributes have evolved from a pure "alternative speculative asset" to a "macro-sensitive sentiment asset." Bitcoin's correlation with the Nasdaq index, gold, and the 10-year US Treasury yield reached historical highs in 2025-2026. This means that Bitcoin's price fluctuations are no longer solely driven by endogenous halving supply shocks but are more constrained by the global dollar liquidity spigot.
Therefore, judging "where is the bottom" cannot rely solely on the calendar (time cycle) or a ruler (retracement depth), but must deeply deconstruct the macro variables currently dominating price action.
1.2 "The Warsh Shock": Fed Policy Shift and the Shadow of Liquidity Tightening
The sharp correction in Bitcoin and the entire crypto market in early 2026 did not stem from an endogenous decline in blockchain technology but from a sudden change in the macro-financial environment—what the market calls "The Warsh Shock."
On January 30, 2026, former Federal Reserve Governor Kevin Warsh was nominated as the new Fed Chair, succeeding the outgoing Jerome Powell. This personnel change caused剧烈震荡 in financial markets. Warsh has long been known as an "inflation hawk" and "critic of quantitative easing (QE)." The policy倾向—dubbed the "Warsh Doctrine"—revealed in his nomination hearings and past statements advocates for an aggressive "Monetary Barbell Strategy":
-
Short-Term Interest Rate End: May maintain neutral or slightly accommodative rates to support real economic growth.
-
Balance Sheet End: Advocates for aggressive quantitative tightening (QT), accelerating the reduction of the Fed's massive $6.6 trillion balance sheet to restore the central bank's policy space and financial discipline.
This policy mix expectation directly led to a surge in long-term Treasury yields. The 10-year US Treasury yield quickly broke through the key psychological level of 4.5% in early February, triggering a valuation reassessment across asset classes. For a liquidity-sensitive asset like Bitcoin, soaring risk-free yields and central bank balance sheet reduction mean the drying up of marginal buying and the withdrawal of存量 funds.
Furthermore, the Fed decided at its January 2026 FOMC meeting to maintain the federal funds rate target range at 3.50%-3.75%, pausing the previous rate cut pace. Although the market still expects some degree of rate cuts in 2026, the gloom of "Higher for Longer" once again looms over the market. Analysis from institutions like JPMorgan and BlackRock points out that, against the backdrop of inflation not yet fully returning to the 2% target and a still-strong labor market, overly accommodative expectations have been revised.
This macro background provides important clues for judging Bitcoin's bottom: The "market bottom" of this cycle is highly likely to coincide with the "liquidity bottom." Before the Fed stops QT or clearly signals liquidity easing, Bitcoin will find it difficult to start a new unilateral bull market and will more likely show wide fluctuations within the bottom area.
2. Miner Economics: The Hardcore Logic of the Physical Bottom and the Shutdown Price Defense Line
In Bitcoin's valuation system, miners are not only network maintainers but also the "last line of defense" for the price. Miners' production costs (especially electricity costs and hardware depreciation) constitute Bitcoin's "physical bottom." When the coin price falls below the shutdown price of mainstream miners, high-cost miners are forced to shut down, leading to a drop in the network's hash rate, which in turn triggers a difficulty adjustment, ultimately reducing the unit cost for the surviving miners and forming a self-regulating mechanism for the price. This process is called "Miner Capitulation," and historically, it has often been one of the most accurate signals of a cycle bottom.
2.1 The Great Hashrate Washout: The Largest Retreat Since 2021 and Difficulty Adjustment
In February 2026, the Bitcoin network underwent a stress test of historical significance. Data shows that Bitcoin's mining difficulty plummeted by approximately 11.16% in one adjustment cycle. This was the largest single negative adjustment the network has experienced since China's comprehensive ban on Bitcoin mining in 2021.
Behind this剧烈 difficulty adjustment was a significant retreat in the network's total hashrate. The hashrate dropped by about 20% from its peak in October 2025 (over 1.1 ZettaHashes/s) to around 863 ExaHashes/s. The reasons for this "great retreat" are twofold:
-
Economic Pressure from the Price Plunge: The coin price halved in a short time (from $126k to $60k), directly breaching the breakeven point for a large number of mid-to-low-end miners and high-electricity-cost mining farms.
-
Physical Impact from Force Majeure: The winter storm代号 "Fern" swept across North America, causing tight power supply in mining hubs like Texas. To响应 grid power curtailment programs or due to soaring own electricity costs, a large number of mining farms were forced to physically power down.
Although this hashrate washout seems bearish, it actually lays the foundation for the formation of a market bottom. Historically, deep retracements in hashrate and difficulty adjustments often mark the exhaustion of selling pressure. After the most vulnerable miners leave, the remaining participants are long-term players with excellent cost control and strong financial strength, forming the most solid holder group at the bottom.
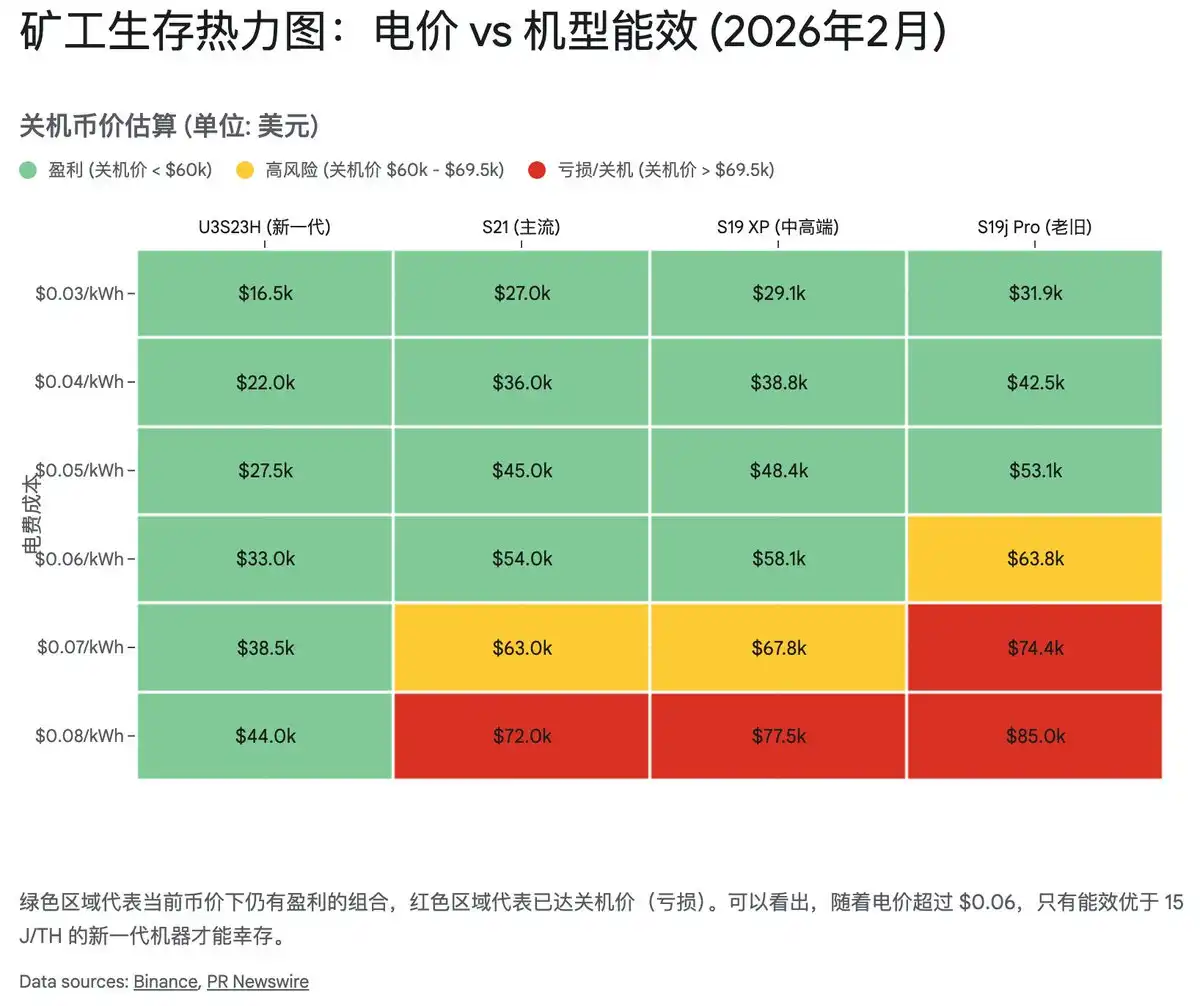
2.2 Shutdown Price Map: The Life-and-Death Line at $52,000-$58,000
To precisely calculate the specific point of the bottom, we need to deeply analyze the shutdown coin price of current mainstream miners. Based on the current network difficulty (approx. 125.86 T) and typical industrial electricity costs ($0.06/kWh to $0.08/kWh), we can draw a "life-and-death map" for miner survival.
2.2.1 The Twilight of the S19 Series: $75,000-$85,000
The Antminer S19 series (including S19j Pro, S19 XP, etc.) was the absolute main force in the last cycle, but its energy efficiency ratio has gradually fallen behind after the 2024 halving.
-
At an electricity cost of $0.08/kWh, the shutdown price for the S19 standard version and some Pro models is as high as $85,000 or above.
Even the more efficient S19 XP has a shutdown price around $75,000.
-
Conclusion: At the current market price of around $67,000, the vast majority of miners relying on the S19 series without electricity cost advantages are already in a serious "underwater" state (operating at a loss). This is the main source of the recent hashrate decline and means that the selling pressure from this marginal hashrate has been largely exhausted.
2.2.2 The Defense of the S21 Series: $69,000-$74,000
The Antminer S21 series is the backbone of the current network's hashrate, representing the current mainstream level of energy efficiency.
-
Data indicates that the shutdown price range for the S21 series at a cost of $0.08/kWh is approximately $69,000 to $74,000.
-
This data point is crucial. The current coin price (approx. $67,000) has already pierced this range. This means that even miners with relatively new equipment but slightly higher electricity costs are beginning to face the decision to shut down. When mainstream miners start shutting down, the market is usually extremely close to a bottom.
2.2.3 The Ultimate Physical Bottom: $44,000 (S23/U3S23H)
Bitmain's latest S23 series and U3S23H represent the极限能效 of current human engineering.
-
The shutdown price for such models is as low as around $44,000.
-
This constitutes the "ultimate physical hard bottom" of this bear market. Unless there is a global financial system collapse or a disaster at the Bitcoin protocol level, it is extremely difficult for the price to fall below this level, as it would mean that almost all network hashrate would be operating at a loss, and network security would face reconstruction.
Comprehensive Analysis: The $52,000 to $58,000 range is not only a support level in technical analysis but also the "Maginot Line" of miner economics. If the price falls to this range, it will force large-scale shutdowns of the S21 series (even for low-electricity-cost miners), triggering a deeper hashrate capitulation and difficulty adjustment. And in historical patterns, this depth of miner capitulation has often been the absolute bottom of the cycle.
3. On-Chain Token Distribution: Who is Panicking, Who is Greedy?
If miners define the physical lower limit of the bottom, then the distribution and flow of on-chain tokens reveal the psychological game at the bottom. On-chain data provides us with a "God's perspective" to observe the behavior of market participants (short-term speculators vs. long-term believers). The current on-chain state shows typical "capitulation and transfer" characteristics, which is a necessary stage in the bottom formation process, but it is not yet fully complete.
3.1 The Complete Rout and Capitulation of Short-Term Holders (STH)
The price crash in early February 2026 was essentially a "massacre" of Short-Term Holders (STH). STH refers to addresses holding coins for less than 155 days, often regarded as the least determined and most price-sensitive group in the market—the so-called "retail investors" or "trend chasers."
On-chain data shows that as Bitcoin fell below $70,000 and slid towards $60,000, it triggered panic selling among STH. On February 6th alone, over 100,000 Bitcoins transferred to exchanges belonged to STH. This large-scale inflow to exchanges is a typical capitulation signal, indicating that a large number of筹码 bought at high prices in late 2025 are being sold at a loss.
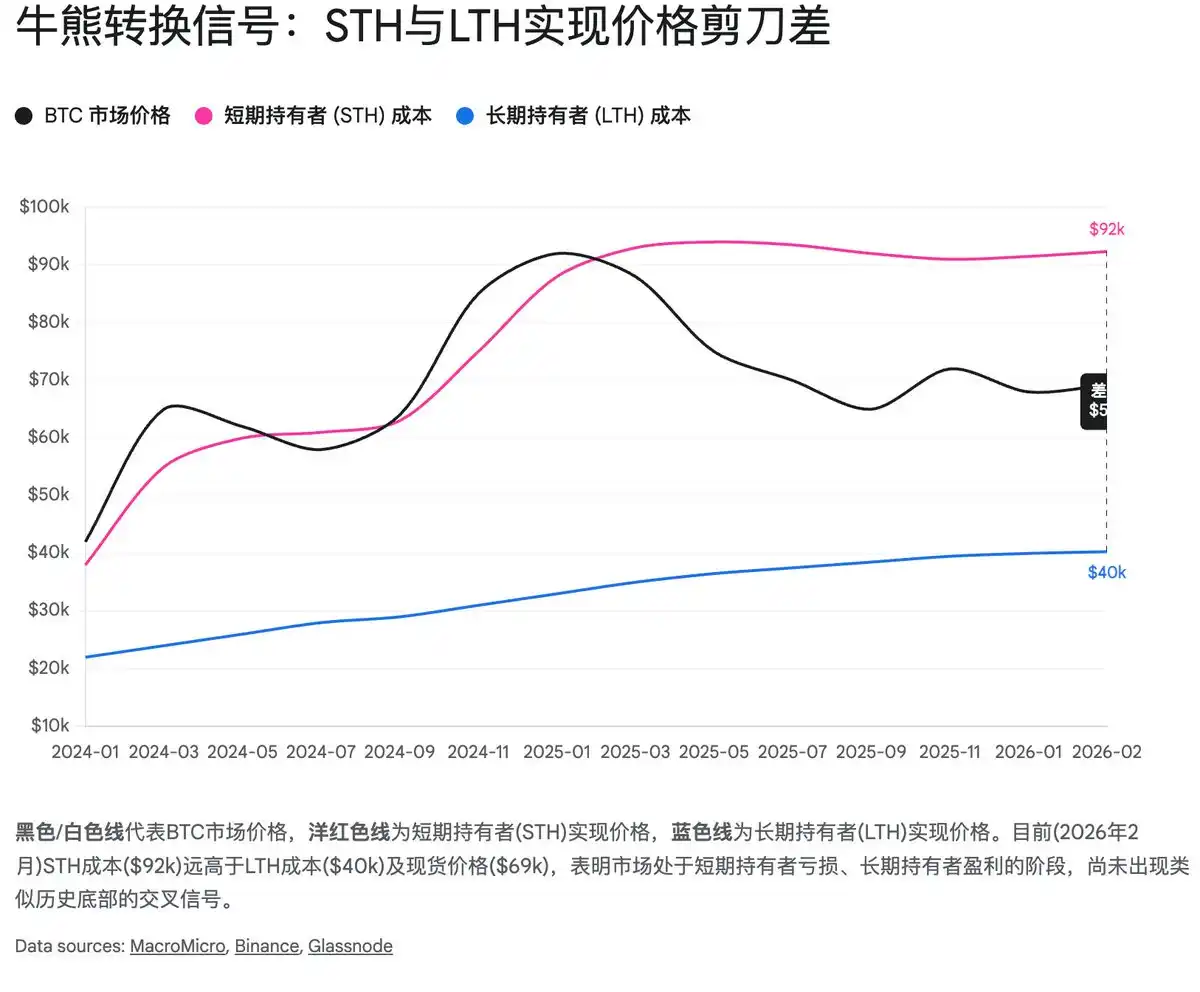
A more critical indicator is the STH Realized Price, which is the average holding cost of short-term holders.
-
STH Realized Price: Approximately $92,337 1.
-
Current Market Price: Approximately $67,000.
This is a staggering data point. It means that short-term holders, as a whole, are facing an average unrealized loss of nearly 30%. Historical patterns indicate that the true bottom of a bear market usually occurs when STH are彻底绝望 (completely desperate) and loss-making筹码 are completely washed out. At that time, the STH realized price declines rapidly, even forming a "death cross" with the Long-Term Holder (LTH) realized price (meaning the cost basis of new entrants is lower than that of old hands, indicating extreme market undervaluation).
Currently, although STH are suffering losses, there is still a distance before their cost basis significantly decreases and crosses below the LTH cost basis. This suggests that the market may still need to go through a "grinding bottom" period, using prolonged sideways movement at low levels to "wear out" high-cost筹码 and lower the average cost of STH.
3.2 The Bottom Game and Accumulation of Long-Term Holders (LTH)
In stark contrast to the恐慌散户 (panicking retail), Long-Term Holders (LTH, holding coins for more than 155 days) are beginning to show signs of re-accumulation. Bitfinex's Alpha report pointed out that after持续分销 (continuous distribution/selling for profit) during the bull market peak in the second half of 2025, LTH holdings bottomed in December 2025 and have begun to回升 (rebound), currently holding about 14.3 million BTC.
-
LTH Realized Price: Approximately $40,311 1.
-
Network-Wide Realized Price (Overall Realized Price): Approximately $55,207 1.
The network-wide realized price (around $55,200) is another extremely critical defense line. It represents the average price at which all coins on the Bitcoin network last moved, i.e., the average cost basis of the entire market. In deep bear markets, the spot price often briefly falls below the network-wide realized price, creating extreme despair (meaning the entire market is losing money on average), before completing a V-shaped reversal. The current price (approx. $67,000) is only about 18% away from this defense line, further validating the high risk-reward属性 (attribute) of the $50,000-$58,000 range.
3.3 Whale Behavior and the Divergence & Convergence of ETF Flows
It is worth noting that the behavior pattern of institutional capital is undergoing subtle changes. Although ETFs saw net outflows in early 2026, exacerbating market selling pressure, a reversal in fund flows occurred when the price touched the $60,000 mark.
Data on February 10 showed that US spot Bitcoin ETFs recorded a net inflow of $166 million, with BlackRock's IBIT accumulating against the market decline. This "buy the dip" institutional behavior stands in sharp contrast to the panic selling of retail investors. This indicates that for institutional capital aimed at asset allocation, $60,000 has entered its value allocation range.
4. Technical Analysis: From the "Super Turnover Zone" to "Psychological Barriers"
Setting aside fundamentals and on-chain data, looking purely at price action and technical indicators, the current bottom signals are equally clear and strong.
4.1 The "Super Turnover Zone" from a VPVR Perspective: The 72k-52k筹码 Labyrinth
The Volume Profile Visible Range (VPVR) is an X-ray machine for identifying support and resistance. It clearly outlines the筹码 structure during the 2024-2025 bull market. The VPVR shows that the large range of $72,000 to $52,000 is the "super turnover zone" of the past two years,汇聚了 (converging) a massive amount of historical trading volume.
-
$70,000 - $72,000 (Upper Resistance): The previous strong support level, after being broken, has now turned into heavy overhead resistance. A large number of筹码 bought in this range (including some ETF buying) are now trapped, and any rebound to this level will face selling pressure from those looking to break even. This is also why recent rebounds have repeatedly been blocked around $71,000.
-
$52,000 - $58,000 (Lower Iron Bottom): This is the lower edge of this turnover zone and also the area where the VPVR shows the most密集的 (dense) "High Volume Nodes" (HVN). In this range, there is not only a堆积 (accumulation) of a large amount of historical trading volume but also an overlay of the筹码 structure from the previous bull market (2021). This is the last bastion of the bulls. Once broken, the price will enter a "vacuum zone" with sparse volume below and could quickly slide to $40,000.
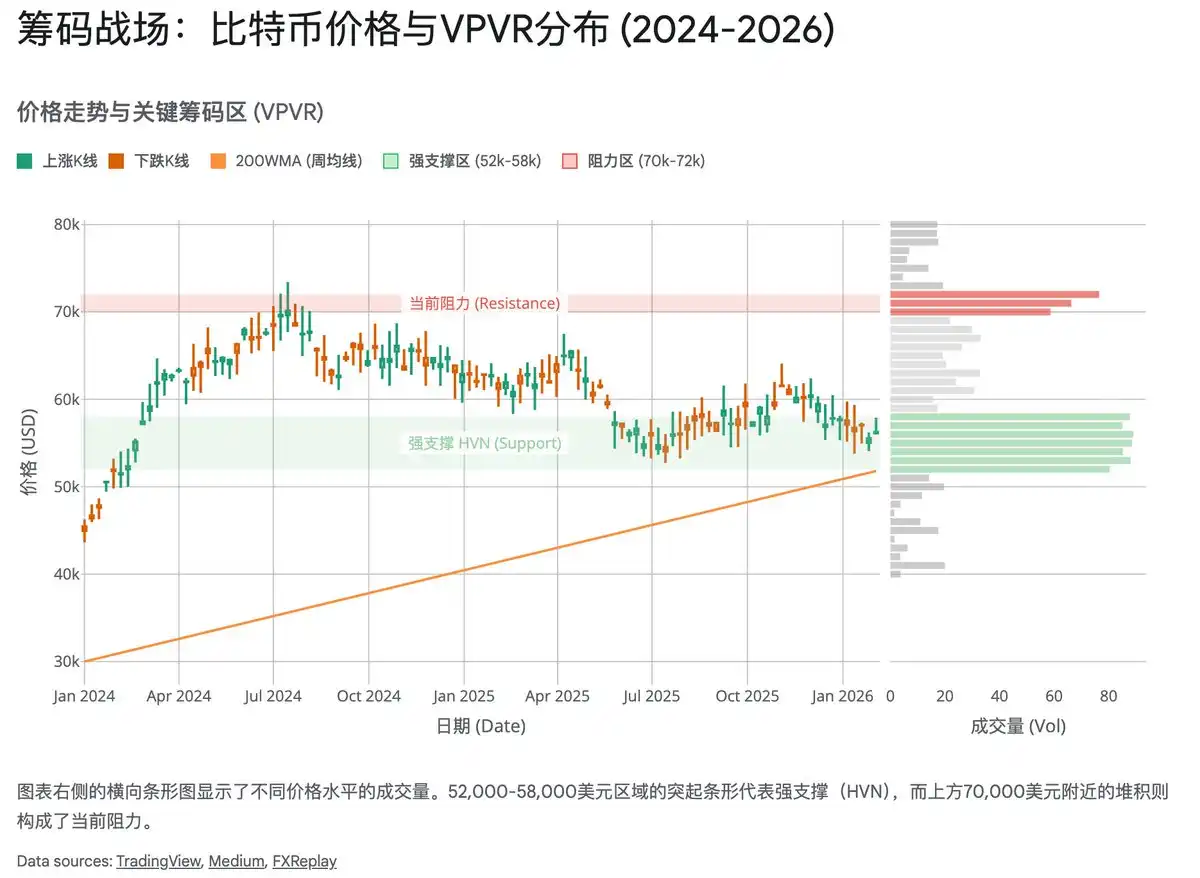
4.2 The 200-Week Moving Average: The Battle to Defend the Bull-Bear Dividing Line
The 200-Week Moving Average (200WMA) is Bitcoin's most reliable and respected long-term bottom indicator historically. It represents the average holding cost over the past four years and is often regarded as the bull-bear dividing line.
Currently, the 200-week moving average is上行至 (rising to) approximately $58,000.
-
Historical Backtest: At the bear market bottoms in 2015 and 2018, the Bitcoin price stopped falling and rebounded after touching or slightly breaking below the 200-week moving average. Although the 2022 bear market broke below this average一度 (once), the subsequent V-shaped reversal again proved its effectiveness as a "value中枢" (center).
-
Current Status: As of February 2026, the Bitcoin price is testing this key moving average downwards. If the price can effectively hold the $58,000 level, it will most likely confirm the cycle bottom. This technical indicator forms a perfect triple resonance with the miner shutdown price (S19 series) and the network-wide realized price (~$55k) in the $52k-$58k range.
4.3 Sentiment Indicators: Contrarian Opportunities in Extreme Fear
-
Fear & Greed Index: This index recently fell to the "Extreme Fear" range of 5-11. This is the lowest level since the FTX collapse in 2022. Warren Buffett's famous saying "Be fearful when others are greedy, and greedy when others are fearful" has extremely high statistical reference value at this moment. Historical data shows that when this index remains in single digits for an extended period (more than a few weeks), it is often the best buying opportunity for long-term capital.
-
Social Media Sentiment: Discussion volume and sentiment on social platforms (Twitter/X, Reddit) show "deathly silence" or extreme pessimism. The so-called "death cross" appears not only on the K-line chart but also in the court of public opinion. This state of low volatility where retail has completely left and no one cares is a necessary psychological condition for bottom formation.
5. Stablecoins and Liquidity: The Overlooked Reservoir
While analyzing the price decline, we cannot ignore the market's potential purchasing power—stablecoins. The market capitalization of stablecoins is a core indicator for measuring the "dry powder" of the crypto market.
Despite the significant retracement in Bitcoin's price, the total market capitalization of stablecoins has not experienced a crash-like outflow as in 2022. Instead, it has remained near the historical high of approximately $3.11 trillion. This indicates that funds have not truly left the crypto ecosystem but have retreated from high-volatility Bitcoin/altcoins and stayed on-chain in the form of safe-haven assets (USDT/USDC).
-
USDT vs. USDC: It is worth noting that the growth rate of USDC has exceeded that of USDT for the second consecutive year, and its share in DeFi and institutional settlements continues to increase. This shows that compliant funds and institutional funds have a stronger willingness to enter the market; they are waiting on-chain for the macro environment to become clearer.
-
Poised to Act: The high stablecoin market cap is like a huge "reservoir." Once the market trend reverses (e.g., the Fed stops QT or the price breaks through key resistance), this over $3 trillion in purchasing power will quickly transform into fuel driving the price higher. Therefore, closely monitoring changes in stablecoin market cap, especially large issuances of USDC, will be an important signal for capturing right-side trading opportunities.
6. Conclusion and Strategy: How to Layout Calmly in the Eye of the Storm
6.1 Where is the Bottom? — The Triple Verification Model
Integrating the above macro, mining, on-chain, and technical analysis, we can construct a three-dimensional bottom verification model, concretizing the vague "bottom" into three specific ranges:
-
Physical Bottom ($44,000 - $52,000):
Definition: This is the shutdown price defense line for the latest generation of high-efficiency miners like the S23, and also the theoretical target for historical extreme retracements (60%-70%).
Probability: Low (<20%). The probability of touching this area is not high unless there is a systemic financial collapse (e.g., a liquidity crisis caused by aggressive Fed QT). It belongs to the "extreme bargain hunting zone."
-
Value Bottom ($52,000 - $58,000):
Definition: This is the overlapping area of the 200-week moving average, the network-wide realized price, and the mixed shutdown price of S19/S21 miners. It is also the lower edge of the super high-volume node shown by VPVR.
Probability: Very High (>60%). This area has extremely strong support and is the defense line where main capital is highly likely to position. The market may briefly touch it through "wicking" movements but will find it difficult to stay below for long.
-
Sentiment Bottom ($60,000 - $65,000):
Definition: This is the "outpost battle" currently being tested by the market and also a psychological barrier. Although panic sentiment and ETF fund回流 (inflow back) have appeared, considering that the STH cost basis has not yet undergone deep清洗 (washing out), this position may need repeated震荡 (fluctuations) and清洗,甚至 (even) facing the risk of "false breakdown" to lure shorts.
6.2 Investment Strategy: The Pyramid Accumulation Method
Given that the bottom is a range rather than a single point, and macro uncertainty (Fed policy) still exists, it is recommended that investors abandon the gambler mentality of "all-in" betting on the bottom and instead use the pyramid accumulation method to buy in batches, smoothing costs and controlling risks:
-
First Echelon ($60k-$65k): Establish a base position (approx. 20%-30% of allocation). Although this position seems precarious, it has entered a high risk-reward area, suitable for long-term allocation to prevent missing out.
-
Second Echelon ($52k-$58k): Core accumulation zone (approx. 40%-50% of allocation). Once the price touches the 200-week moving average or the main miner shutdown price range, increase配置力度 (allocation力度) decisively. This is the most cost-effective hitting point of this cycle.
-
Third Echelon ($44k-$52k): Extreme defense zone (reserve 20%-30% liquidity). Used to deal with possible "black swan" wicking, such as liquidity drying up caused by macro deterioration. If the market does not fall to this level, this part of the funds can be used for chasing the rise after the right-side trend is confirmed.
Observing Right-Side Signals for Bottoming:
In addition to left-side limit orders, investors should also closely watch for the appearance of the following right-side signals:
-
Daily chart high-volume long lower wick: Indicates exhausted selling pressure and strong counterattacks by buyers at key levels.
-
STH realized price falling below LTH realized price: Or the two are extremely close, marking the complete handover of筹码 and the completion of the bottom structure.
-
Significant recovery in stablecoin market cap: Especially issuances of USDC, representing the recovery of institutional purchasing power.
-
Fed softening its tone: Any hint about stopping QT or slowing down rate hikes will be the starting gun for liquidity.
In this cold "crypto winter," patience is the greatest capital. The cycle may be late, but it has never been absent. For steadfast believers, the $52,000-$58,000 range might be the last gift God bestows in the next four years.
Disclaimer: This report is for reference only and does not constitute any investment advice. The cryptocurrency market is highly volatile. Investors should make independent decisions based on their own risk tolerance.