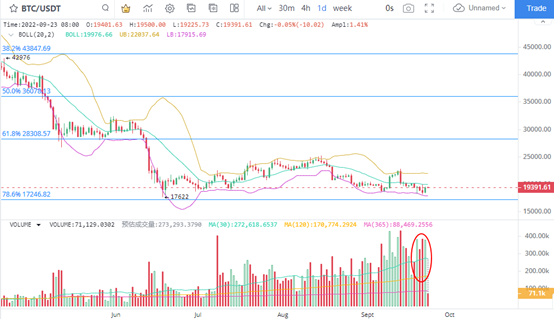
1. BTC still operates at a large scale
Although the recent performance of BTC prices has retreated, the trading volume has not shrunk. The trading volume in the past three weeks is very high, which is the largest trading volume performance in the past year. This means that investors have not lost interest in the low price BTC. From the perspective of the holding cost of investors, the holding cost of BTC investors is more concentrated in the price area below $25000. In the past three weeks, the cost price of the currency held by investors was further concentrated below $22000. Therefore, in the short term, the BTC price hovers at a low level, the adjustment rhythm continues, and it will take longer for the price to leave the bottom area. In other words, the bottom of BTC rebounds to a large arc bottom. The longer the bottom lasts, the more opportunities investors have for low absorption.
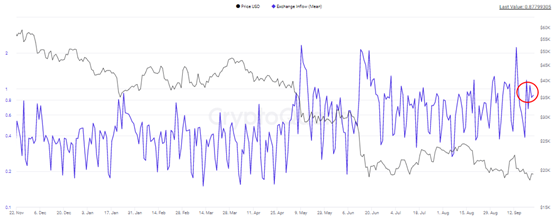
2. BTC average transaction inflow growth
The average inflow of BTC remained at a high level. On September 23, the value remained around 0.877, indicating that although the overall value has not increased recently, the average transaction inflow has remained at a high level. This shows that the trend of the main funds flowing into the exchange has not ended. Therefore, the downside risk of BTC's recent low level operation has not been removed. For currency investors, they need to pay more attention to the trend of the market. Although the focus of BTC's currency holdings has decreased significantly, there are not many investors taking the initiative to pull the market, which has little impact on the market.
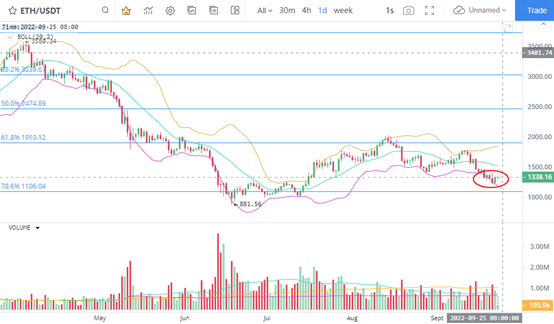
3. ETH rebounds fruitlessly
The trading volume of ETH during the short-term rebound was not high. Although the price was supported at the early $1200 position, there was little room for growth. Therefore, ETH did not completely get rid of the declining price trend in the declining trend of the daily K-line level. The price trend in the week is still falling, and the possibility of continuing to close down at the weekend is high. On the news side, during the recent completion of the Federal Reserve's interest rate hike, the retreat of ETH prices significantly linked to the trend of important assets such as the stock market and the dollar index. Therefore, when judging the market performance, negative sentiment still dominates the price direction during the week, and we should be alert to the callback performance.
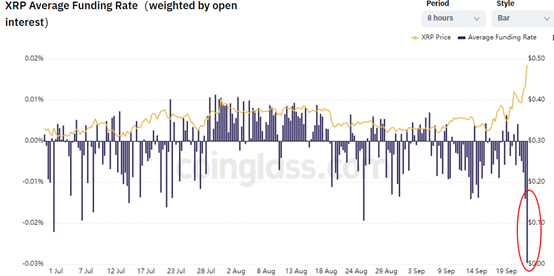
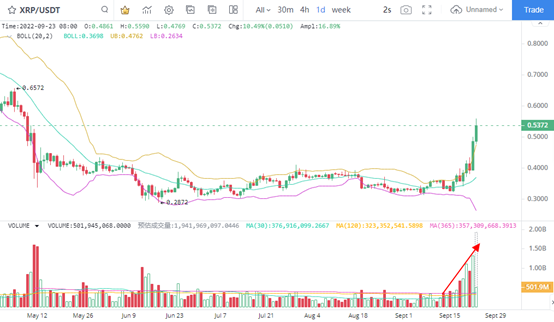
4. XRP financing interest rate fell sharply
XRP's recent price performance is relatively strong, which is related to the continuous growth of trading volume. The daily K line chart shows that XRP trading volume has increased by as much as 300% recently, driving the XRP price to rebound from a low of $0.3 to a maximum of $0.559, with a maximum increase of 86%.
It is worth noting that XRP shows obvious large-scale adjustment performance no matter in the daily K line or the 30 minute chart. Therefore, XRP's recent price strength may continue. The decline of financing interest rate indicates that the selling pressure is increasing, which deserves investors' attention.
5. Withdrawal of financing interest rate
During the rapid decline of XRP financing interest rate, the value continued to drop to the lowest value of -0.003%. Therefore, it is judged that the selling pressure of XRP has increased significantly, and the impact on the price is also increasing. Although the financing interest rate has reached a new low, the absolute value is not low. XRP prices have just completed the bottom reversal pattern since May, and the growth potential may be further confirmed.