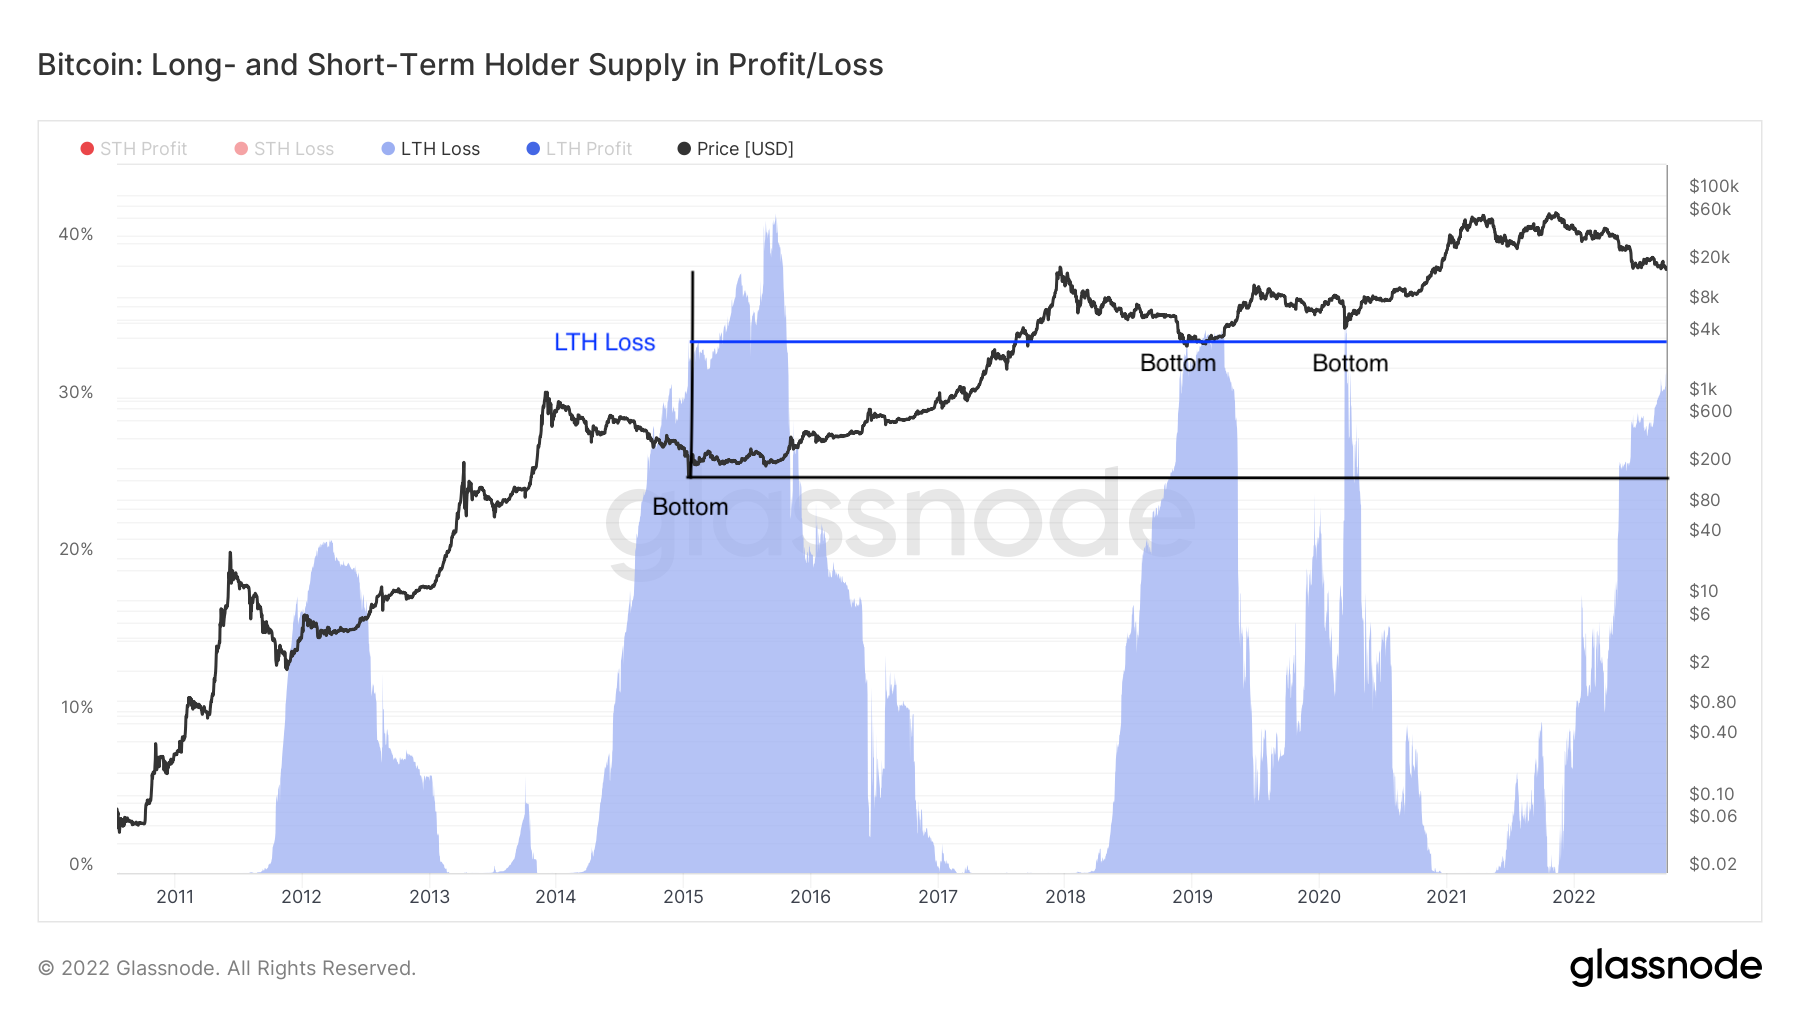
A Bitcoin (BTC) on-chain indicator, which tracks the amount of coin supply held by long-term holders (LTH) in losses, is signaling that a market bottom could be close.
Eerily accurate Bitcoin bottom pundit
As of Sep. 22, approximately 30% of Bitcoin's LTHs were facing losses due to BTC's decline from $69,000 in November 2021 to around $19,000 now. That is about 3%-5% below the level that previously coincided with Bitcoin's market bottoms.
For instance, in March 2020, Bitcoin price declined below $4,000 amid the Covid-19-led market crash, which happened when the amount of BTC supply held by LTH in loss climbed toward 35%, as shown below.
Bitcoin long-term holder supply in losses. Source: Glassnode
Similarly, Bitcoin's December 2018 bottom of around $3,200 concurred alongside the LTH loss metric rising above 32%. In both cases, BTC/USD followed up by entering a long bullish cycle.
Hence, the number of LTHs in loss during a typical bear market tends to peak in the 30%-40% range. In other words, Bitcoin's price still has room to drop — likely into the $10,000-$14,000 range —for "LTHs in loss" to reach the historic bottom zone.
Coupled with the LTH supply metric, which tracks the BTC supply held by long-term holders, it appears that these investors accumulate and hold during market downturns and distribute during BTC price uptrends, as illustrated below.
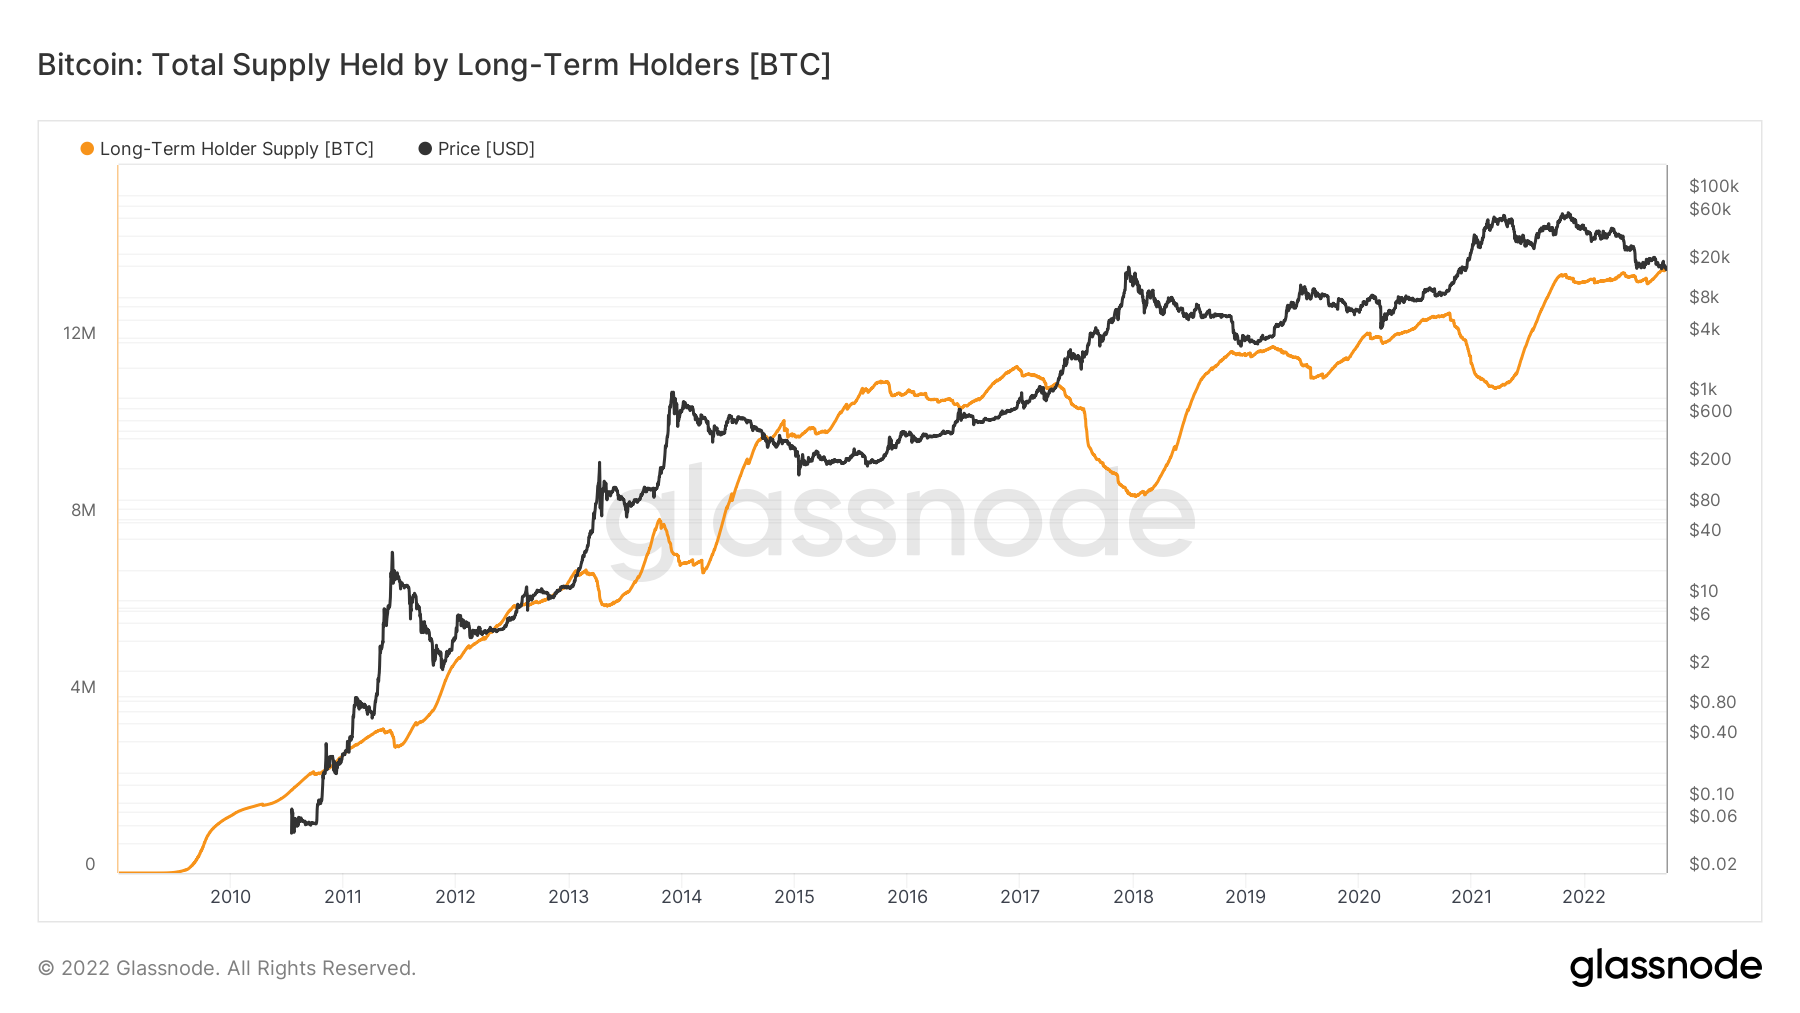
Bitcoin total supply held by LTH. Source: Glassnode
Therefore, the next bull market may begin when total supply held by LTHs begins to decline.
Bitcoin accumulation is strong
Meanwhile, the number of accumulation addresses has been increasing consistently during the current bear market, data shows. The metric tracks addresses that have "at least two incoming non-dust transfers and have never spent funds."
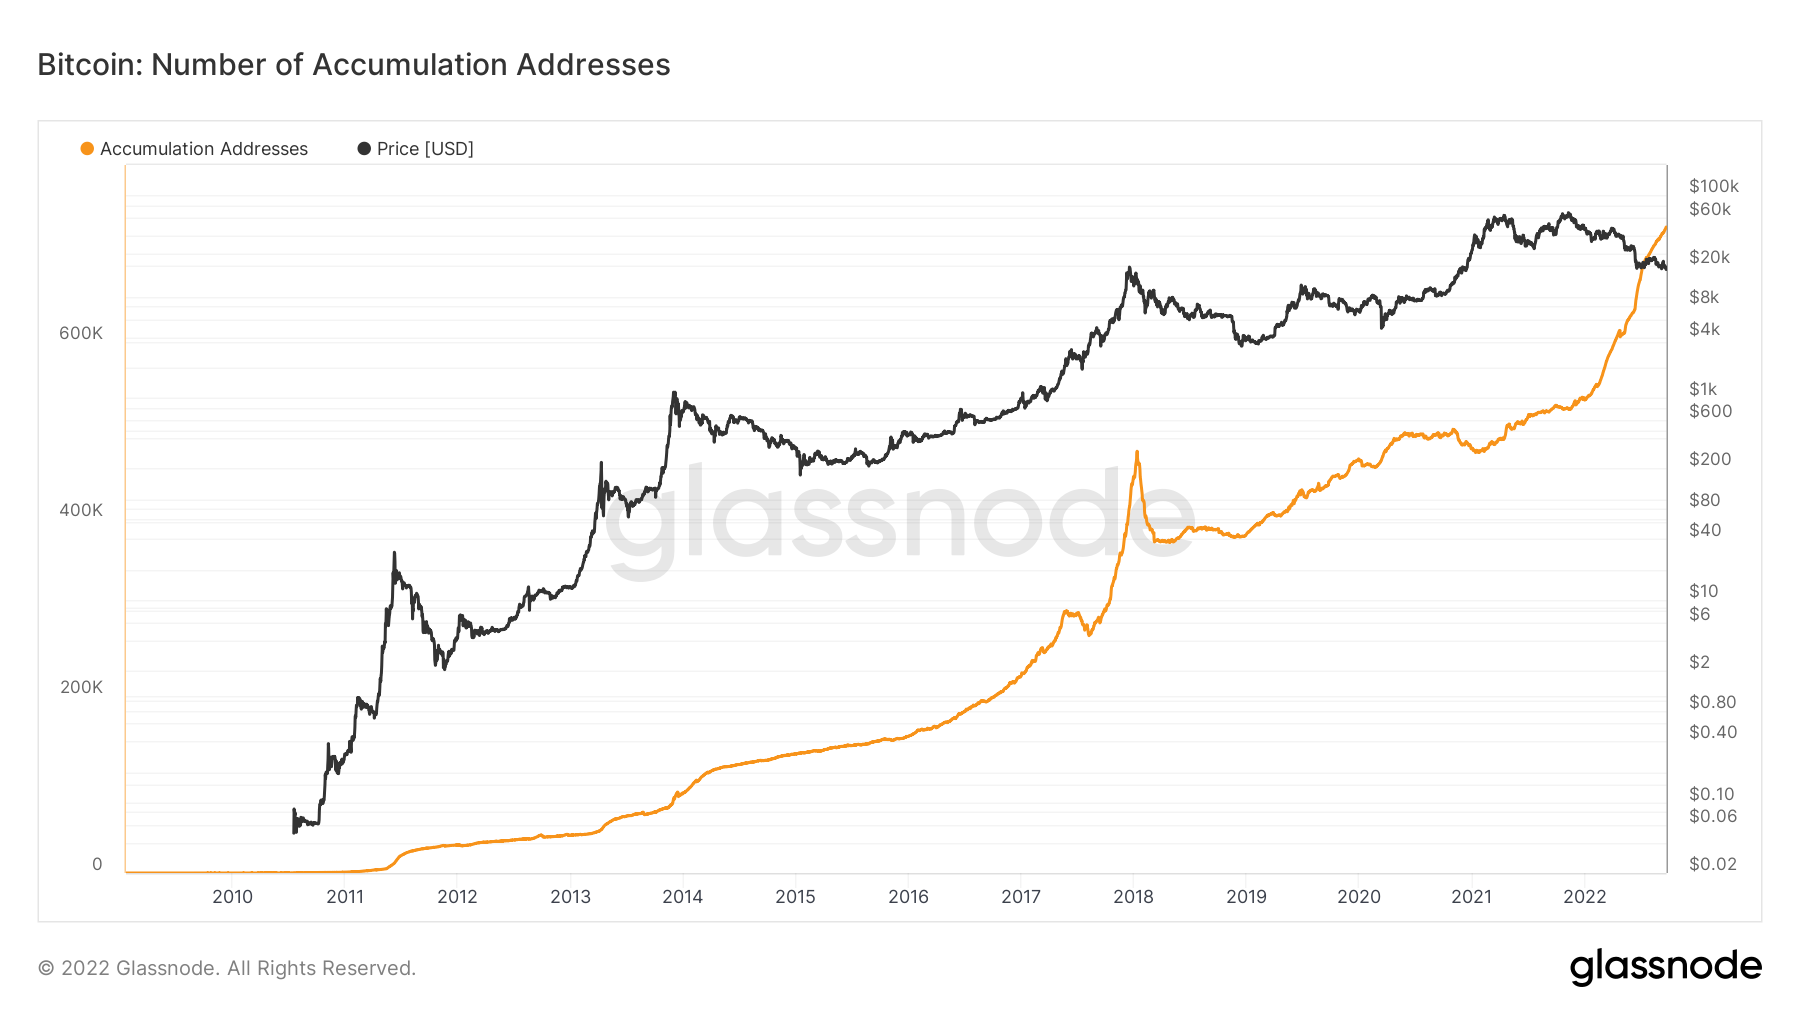
Bitcoin number of accumulation addresses. Source: Glassnode
Interestingly, this is different from the previous bear cycles that saw the number of accumulation addresses drop or remain flat, as shown in the chart above, suggesting that "hodlers" are unfazed by current price levels.
In addition, the number of addresses with a non-zero balance stands around 42.7 million versus 39.6 million at the beginning of this year, showing consistent user growth in a bear market.
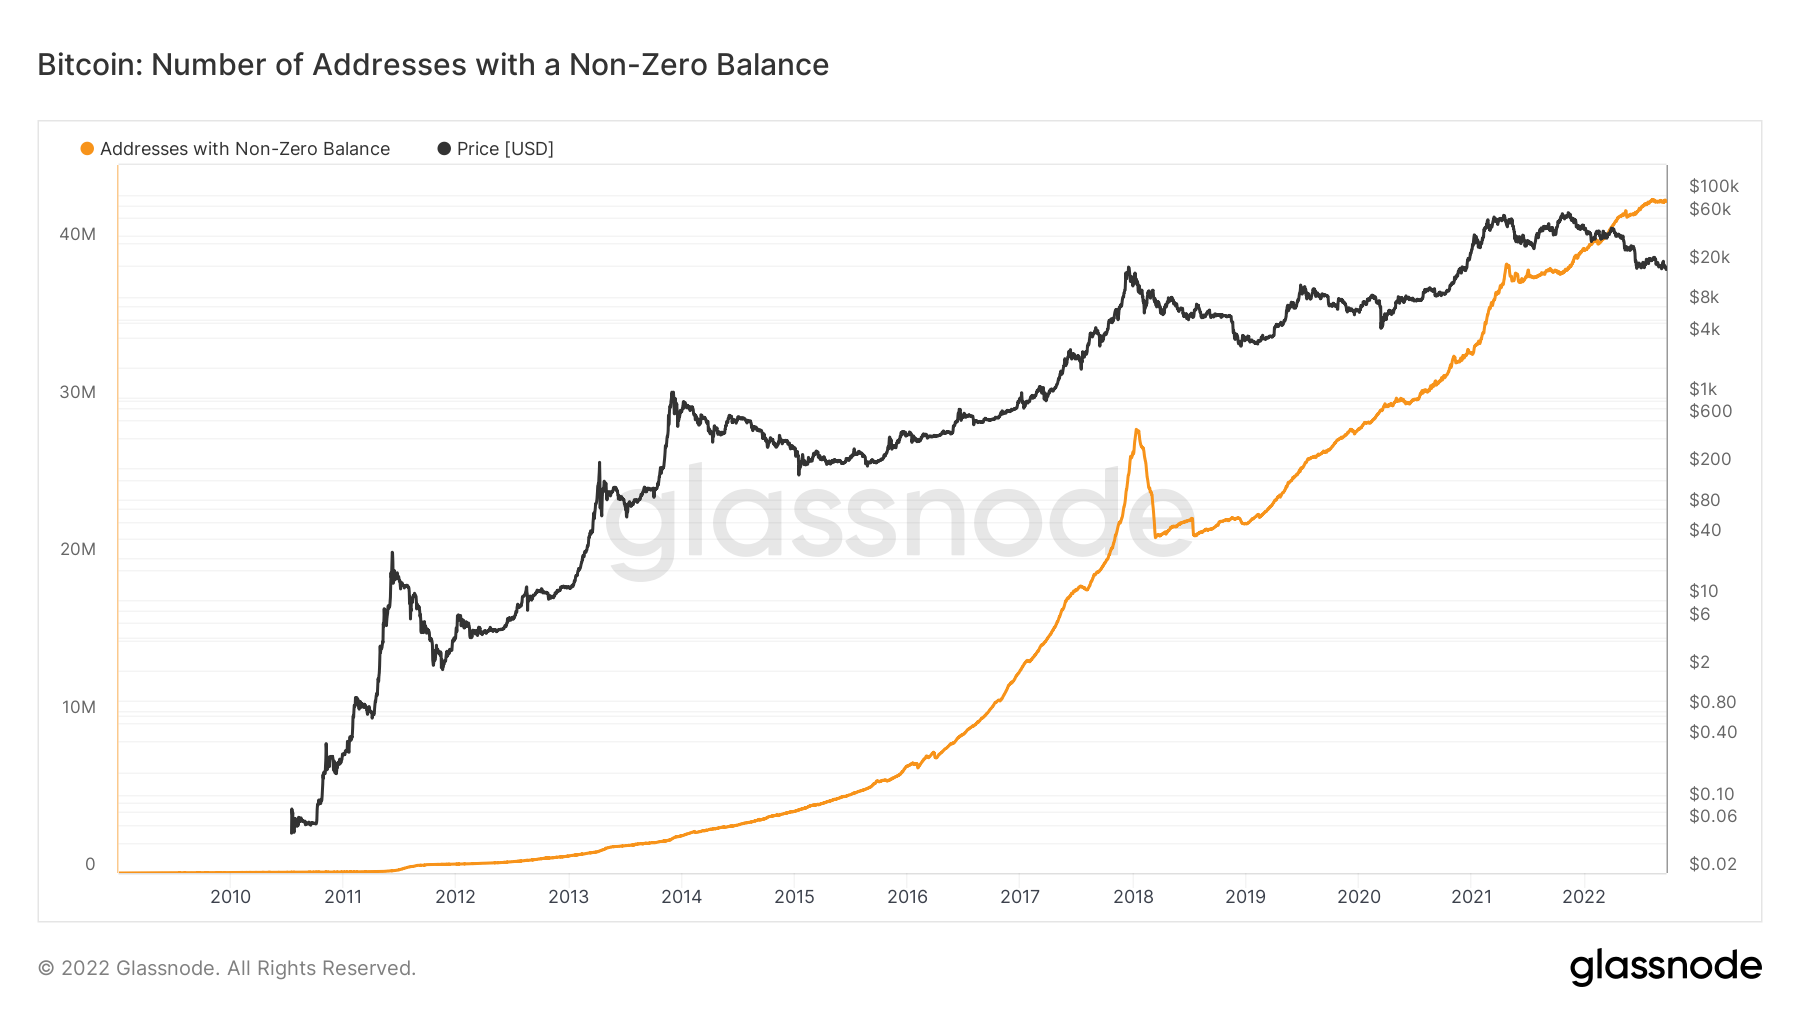
Bitcoin number of addresses with a non-zero balance. Source: TradingView
BTC price technicals hint at more downside
Bitcoin is nevertheless struggling to reclaim $20,000 as support in a higher interest rate environment. Its correlation with U.S. equities also hints at more downside in 2022.
From technical perspective, Bitcoin could drop further toward $14,000 in 2022 if its cup-and-handle breakdown pans out, as shown below.
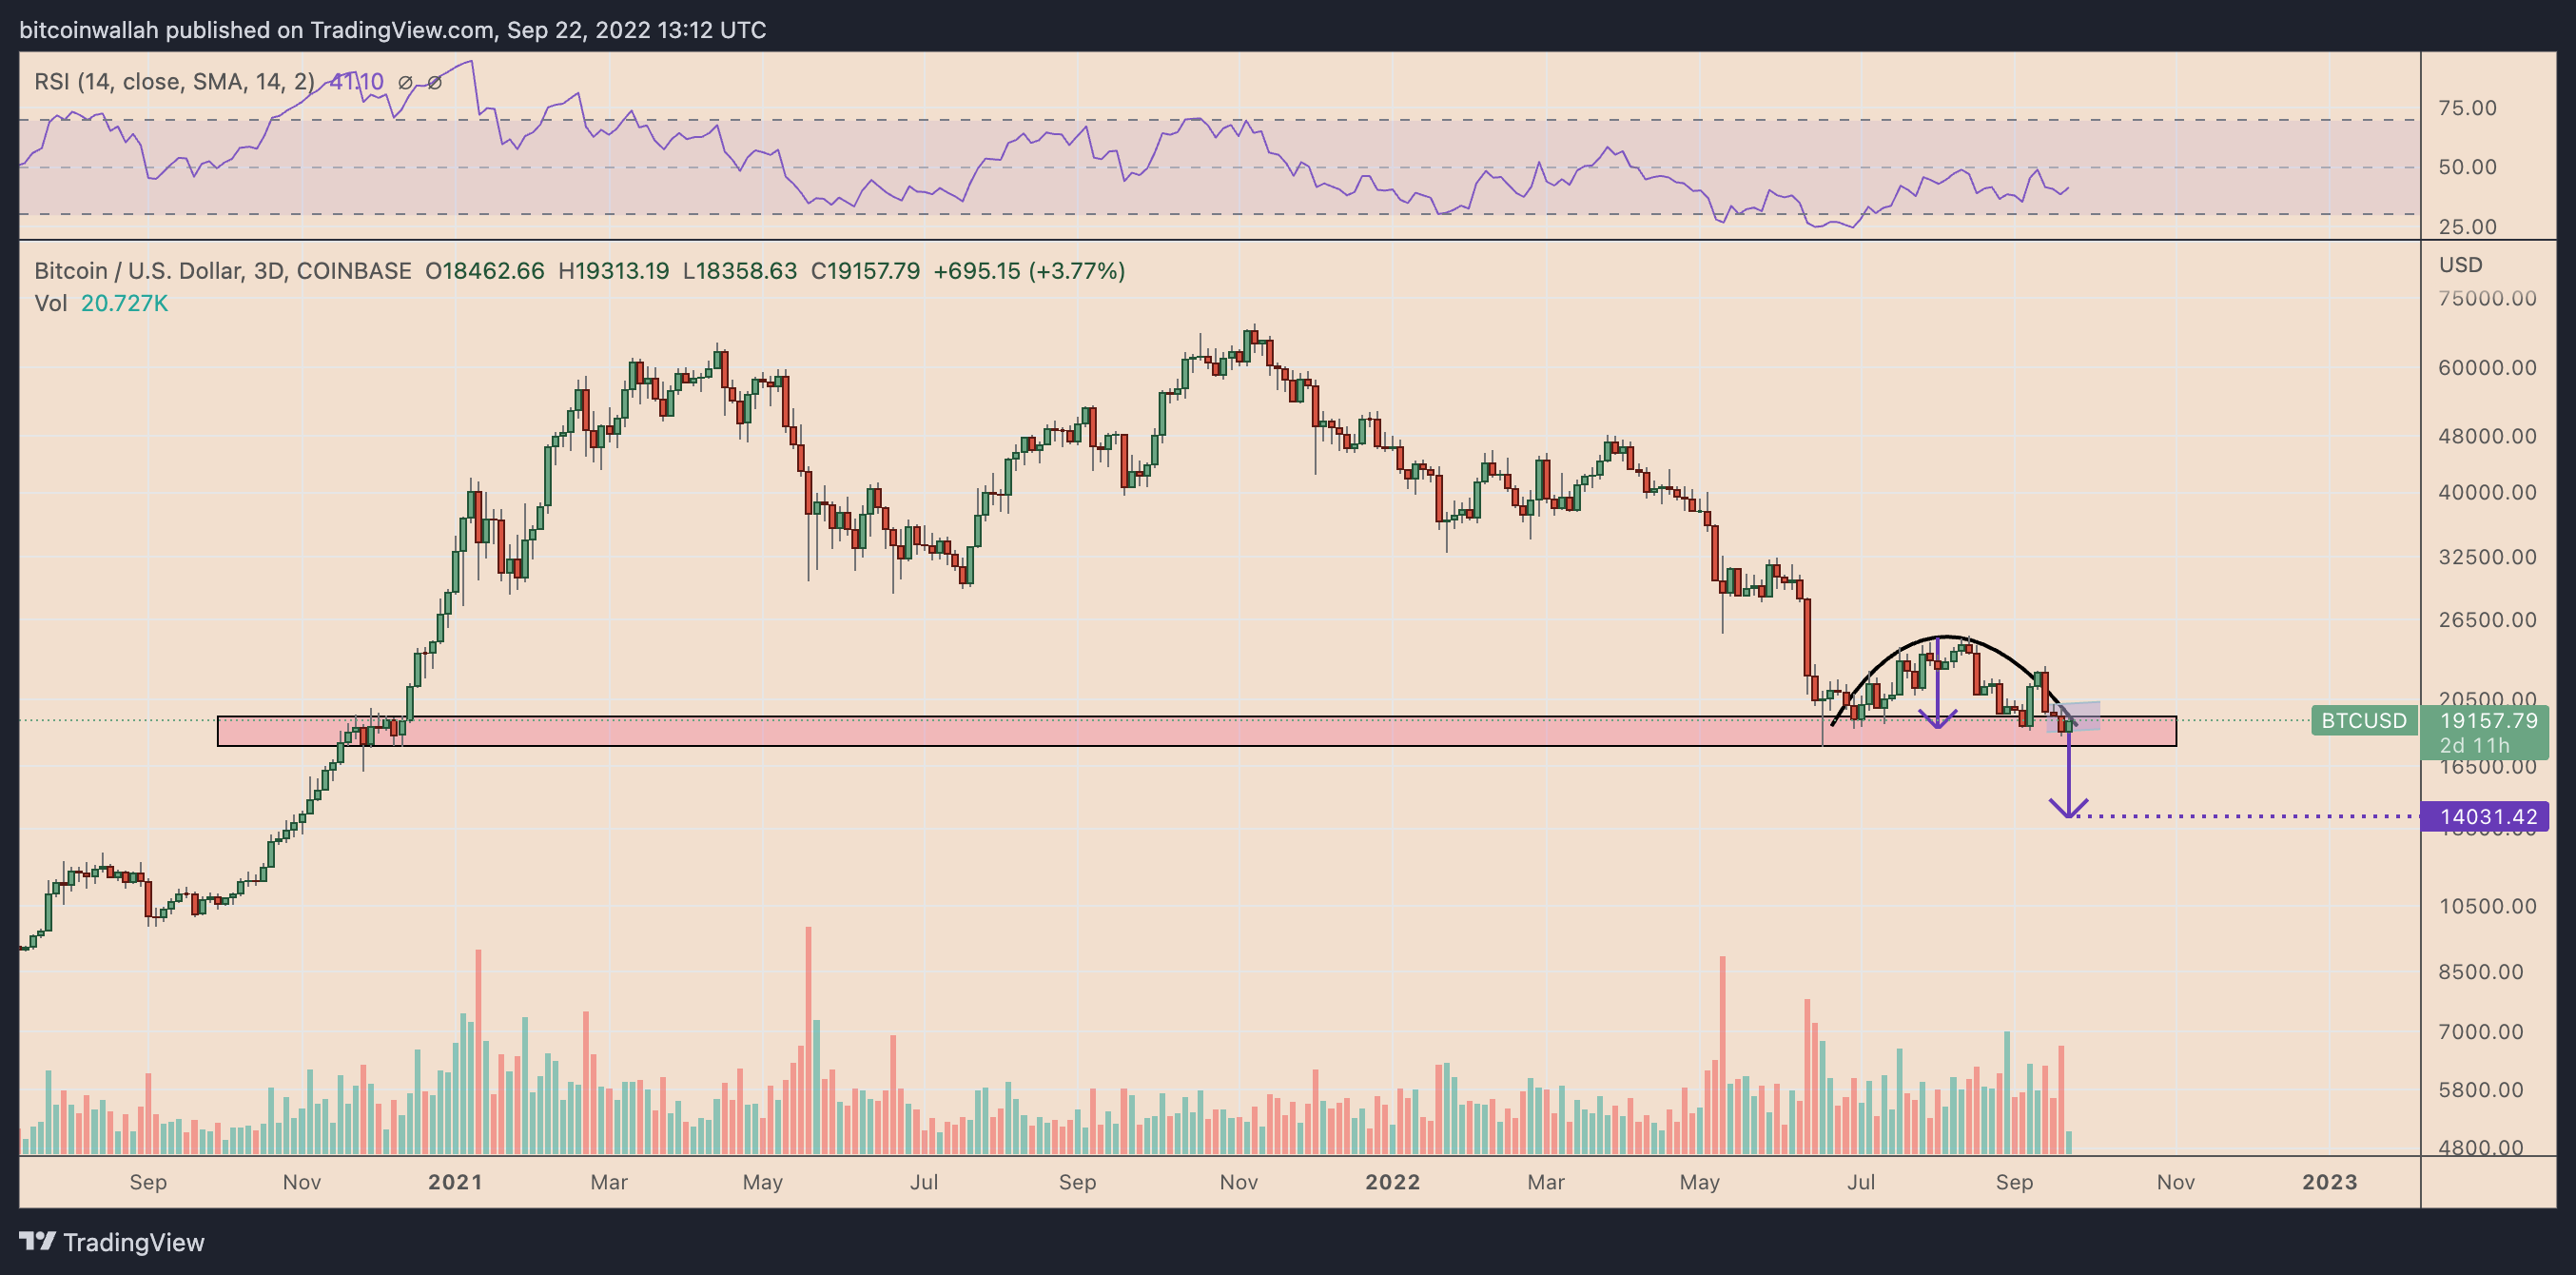
BTC/USD three-day price chart featuring cup-and-handle pattern. Source: TradingView
Such a move should push the aforementioned "LTH in loss" metric toward the 32%-35% capitulation region, which could ultimately coincide with the bottom in the current bear market.