Solana price has been volatile over the last week, with no significant change in the last 24 hours. In the last week, SOL fell by 6%. At the moment, the Solana price is neither swaying towards the bullish zone nor the bearish territory.
The technical outlook for the altcoin has flashed mixed signals. Broader market weakness could be attributed to the altcoin’s mundane price action.
Bitcoin slipped below the $20,000 mark and many other prominent altcoins also travelled south.
Buying strength on Solana’s daily chart remains in the negative with chances of it dropping on its chart further. The bulls are also trying hard to defend the $29 price mark.
A fall below the aforementioned level could push SOL into a bearish pit.
Solana prices had recently formed a rounding bottom, making buyers enthusiastic about its next price movement. However, the coin could not hold onto the bullish anticipation. The global cryptocurrency market cap today is $1 trillion, with a 0.1% negative change in the last 24 hours.
Solana Price Analysis: One Day Chart
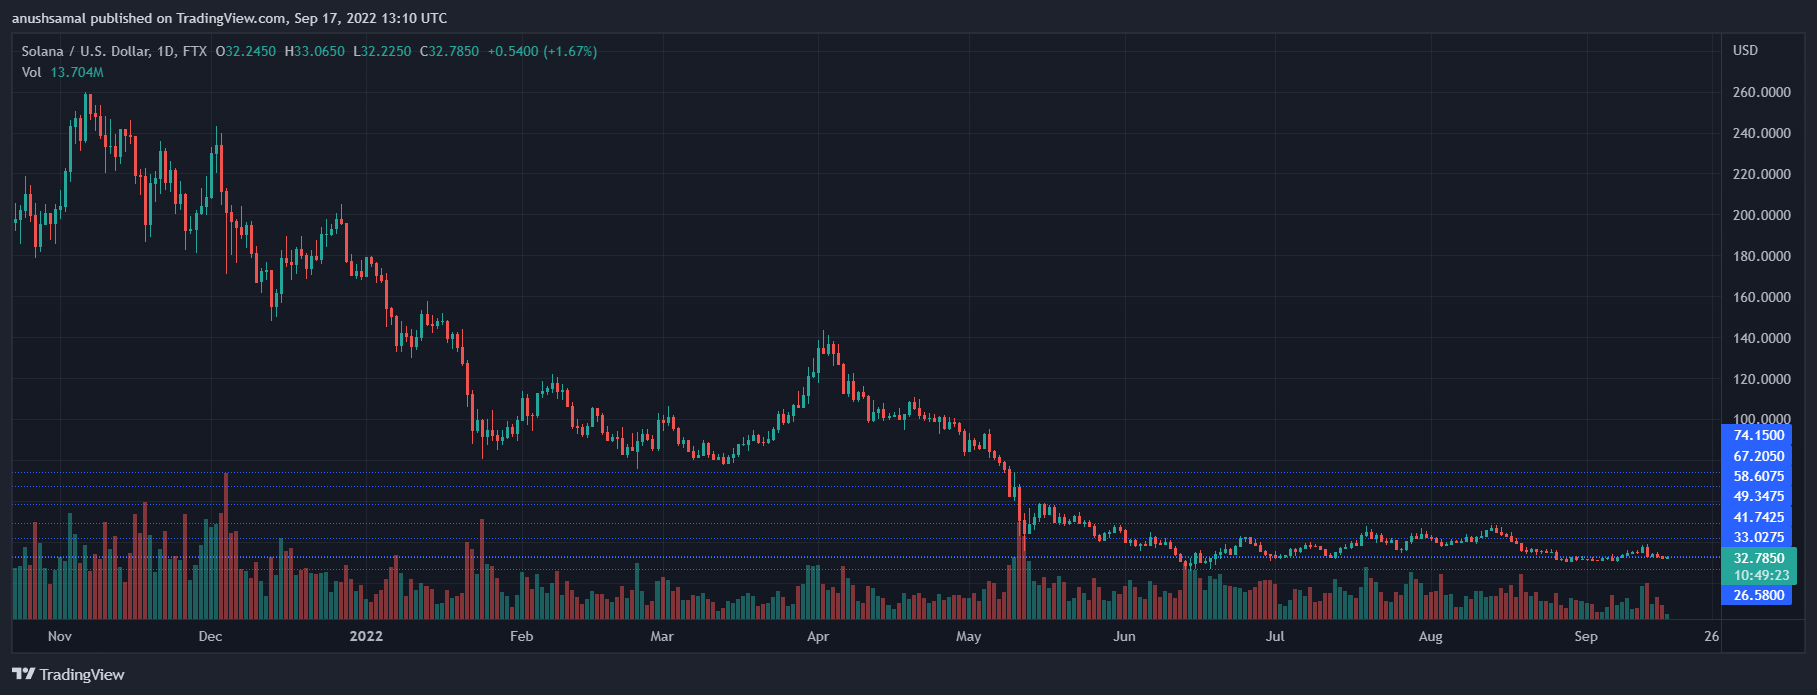
Solana was priced at $33 on the one-day chart | Source: SOLUSD on TradingView SOL was trading at $33 at the time of writing. The bulls had surrendered to the $37 price level and caused the price to fall to its next support line.
At the moment, the bulls are trying to defend the price of the altcoin at $29. The overhead resistance for the coin stood at $37.
If SOL moves past the $37 mark, the coin can attempt to trade near the $40 price mark. On the flip side, one push from the bears will make Solana land at $27.
The amount of SOL traded in the last session declined slightly, indicating that the number of buyers had slightly declined.
Technical Analysis
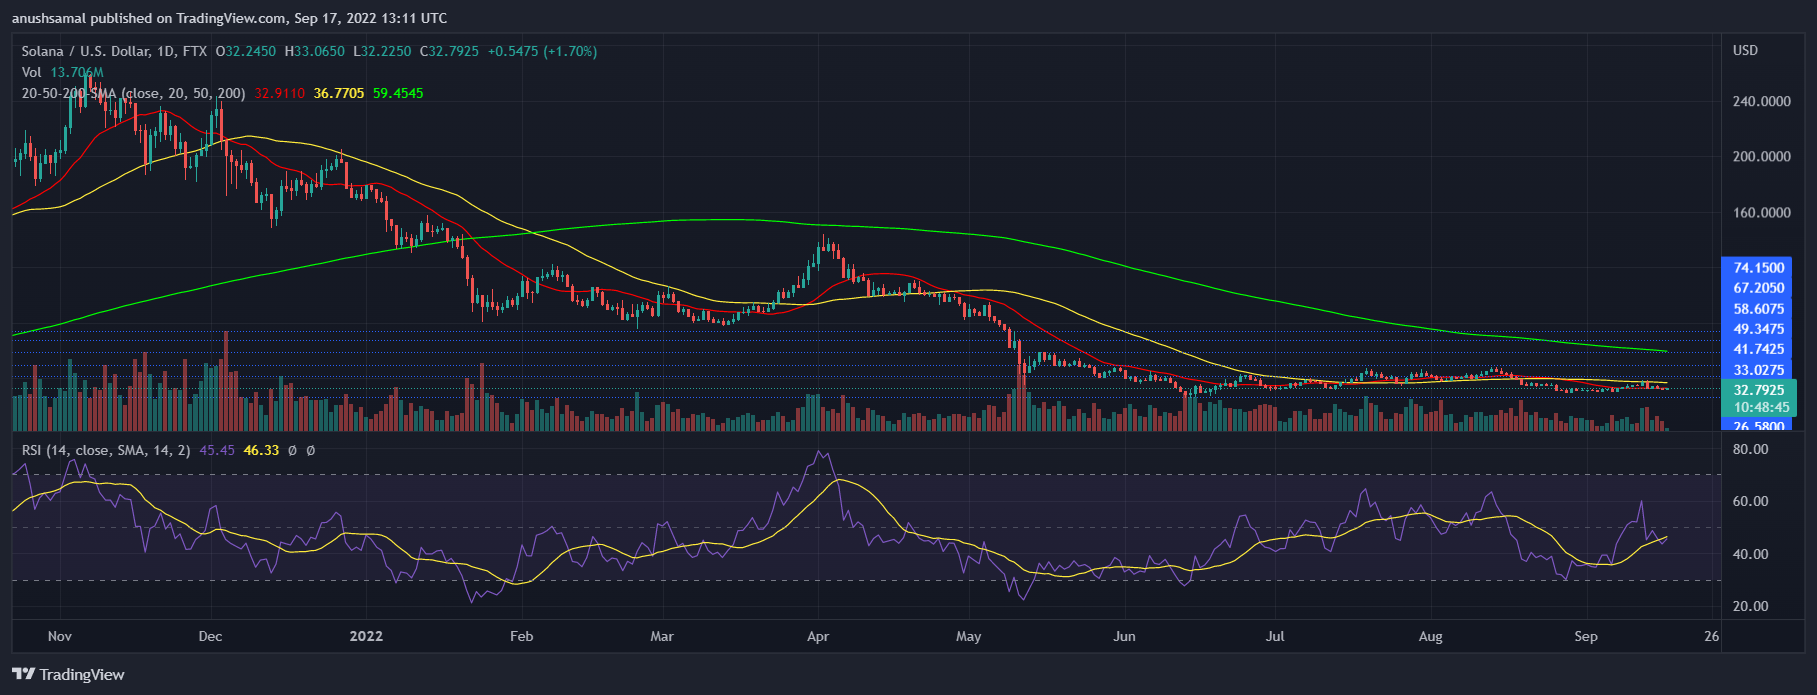
Solana registered less buying strength on the one-day chart | Source: SOLUSD on TradingView SOL flashed declining buying strength on the one-day chart. Over the last 24 hours, Solana however noted a small uptick in buying strength depicting that buying strength was returning to the market.
The Relative Strength Index was seen below the half-line which meant that sellers were more in number as compared to buyers.
Solana price was below the 20-SMA which corresponded with decreased buying strength and that sellers were driving the price momentum in the market.
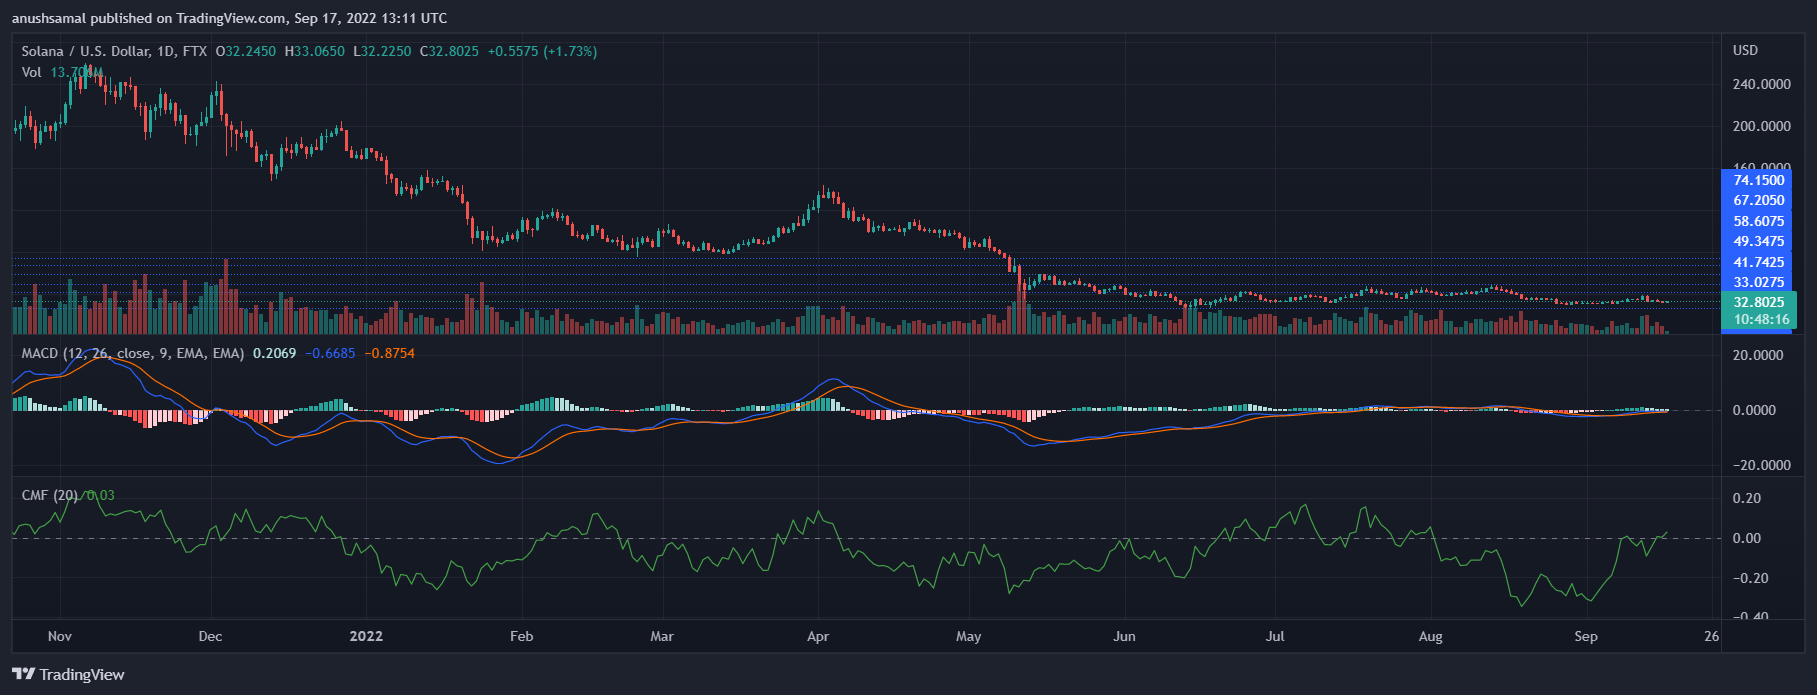
Solana flashed sell signal on the one-day chart | Source: SOLUSD on TradingView The technical indicators for the Solana price pointed towards a mixed signal. Some indicators indicated the onset of positive price action while the other ones continued to remain negative.
Moving Average Convergence Divergence signals the market’s momentum and change in price action.
The MACD underwent a bearish crossover and pointed towards a sell signal for the coin. Chaikin Money Flow is responsible for measuring capital inflows and outflows at a given point in time.
CMF was peeking above the half-line, which showed that capital inflows were more than outflows at the time of writing.