1. The Federal Reserve's forecast of interest rate increase is one-sided
On September 13, the US August CPI data showed that the overall CPI rose 0.1% month on month (QoQ), 0.1 percentage points higher than that in July; CPI rose 8.3% year on year (without quarterly adjustment), lower than the 8.5% year-on-year increase in July, but still higher than the market expectation.
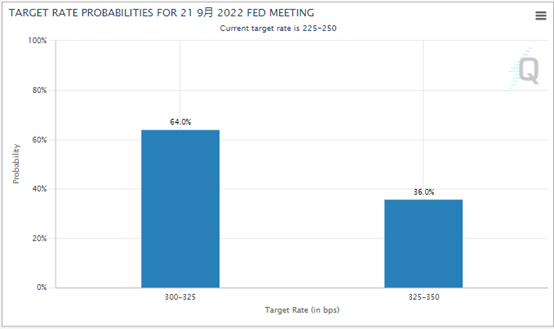
As a result, investors' anticipation of the Federal Reserve's interest rate hike has heated up. According to the "Fed Watch" tool of the Chicago Mercantile Exchange Group (CME), 64% of investors are betting that they will raise interest rates by 75 basis points in July. The proportion of investors betting that the Federal Reserve will raise interest rates by 100 basis points in July was 36%. Judging from the size of investors' bets, there is no doubt that the Federal Reserve will raise interest rates by more than 75% basis points. Compared with the 75 basis points increase on June 16 and July 27, the fact that the Federal Reserve will raise interest rates by 75 basis points for the third time will come next.
To reduce inflation to the benchmark target interest rate of 2%, the Federal Reserve has raised interest rates for four consecutive times this year, and the federal funds rate is currently 2.25% - 2.50%.
2. The US dollar soared and BTC fell to a low level
Affected by the expected rise in interest rates, the overall market shock space has significantly increased.
On September 13, the three major indexes of US stocks opened at a low price and moved at a low price, the biggest drop since June 11, 2020. By the end of the day, the Dow had dropped 3.94%; The S&P 500 index fell 4.32%; The Nasdaq fell 5.16%.
Excluding the initial stage of the epidemic, the Nasdaq and the S&P 500 index fell the most on Tuesday since 2011.
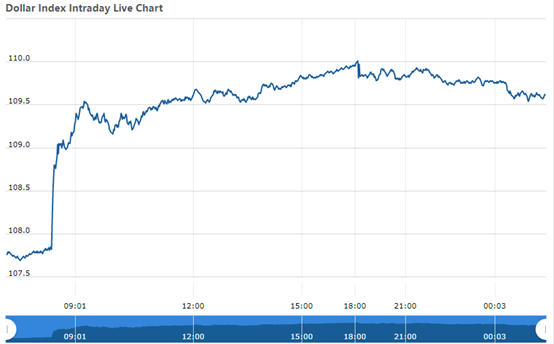
Of course, the most important fluctuation occurred in the change of the US dollar index. The US dollar index, which measures the US dollar against six major currencies, soared 1.52%, reaching a high of 109.97 at the highest level. At the same time, although BTC is not one of the six currencies measured by the dollar index, its withdrawal from the outside still makes investors see the shock effect of financial market linkage.
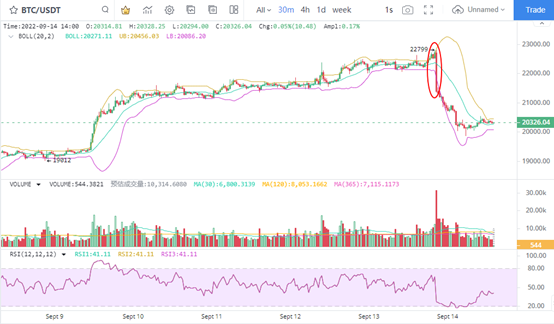
From the 30 minute K line chart of BTC, the fact that the BTC price collapsed instantaneously shows that bad news is imminent, and short-term bearish continues to release investors' worries about interest rate hikes.
BTC linked with the strong shock of the dollar index in the 30 minute K line chart, and the price fell by 5.79% in half an hour, and there was a rare large-scale performance recently. Next, it hit the lowest intraday low of $19860, with a cumulative decline of more than 11%.
3. Price performance of previous interest rate increases
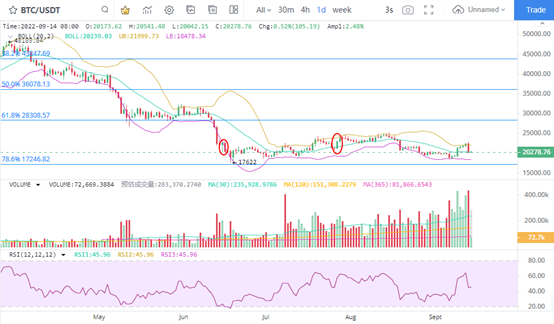
In fact, the adjustment of BTC has not ended since 2022. During the two interest rate hikes by the Federal Reserve in June and June, BTC showed different trend characteristics. The price fell 9.66% on June 16 and rose 7.99% on July 27. Before the interest rate increase on September 22, BTC prices showed a significant large-scale retreat at the daily K-line level, sweeping away the strong price performance of nearly a week. Considering that the fluctuation range of BTC is relatively limited in the past three months, the short-term price retreat may bring the inevitable fact of price decline.
4. Does the market release selling pressure in advance
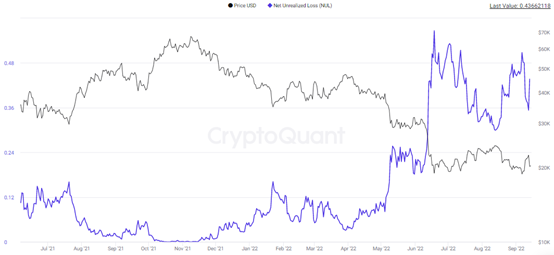
To judge whether BTC will release the selling pressure in a short period of time, we need to pay attention to the size of BTC's hold. In recent years, although BTC has continued to rebound technically, the size of the holding plate has declined rapidly, and the overall proportion is still high. The figures on September 13 showed that there were as many as 43.6% of unrealized losses. Under the negative expectation, it is very difficult for BTC to reduce the size of its hold ups in a short period of time. What's more, the current size of BTC's hold ups is the highest in the past three years.
5. Main selling of BTC spot
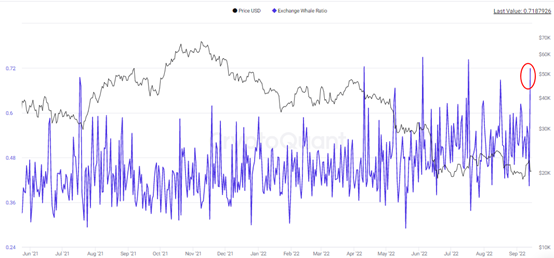
In terms of spot goods, the number of whales sold by BTC has obviously increased. On September 13, the proportion of the number of giant whales sold rose to 0.718, reaching a high level within a year. Specifically, the ratio of the top ten inflows to the total inflows rebounded to 71.8%, which was only lower than 0.723 on April 10, 0.749 on June 4 and 0.742 on July 17.
The selling volume of the giant whale increased significantly, and the selling pressure in the key rebound stage increased, and the market was on the verge of continuous price decline.
6. ETH market performance
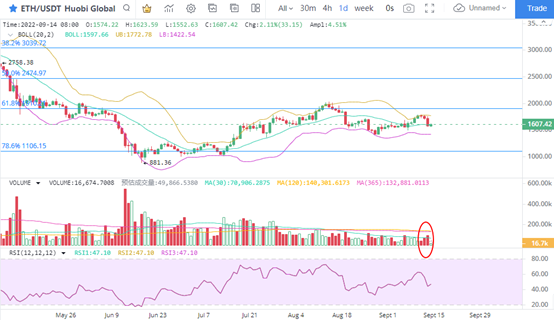
The ETH price continued to retreat in the short term, falling for three consecutive trading days, and the trading volume also rebounded. In terms of decline, the decline reached 12% in three trading days. From the perspective of rebound space, the current ETH price has not reached the previous high of more than $2000, indicating that the recent rebound is not strong enough, and there is an opportunity for the market to change in the weak market. In the shrinking trend, after ETH has dropped in volume for three consecutive trading days, it means that the possibility of price adjustment is still large.
7. A large number of ETH flows into the exchange
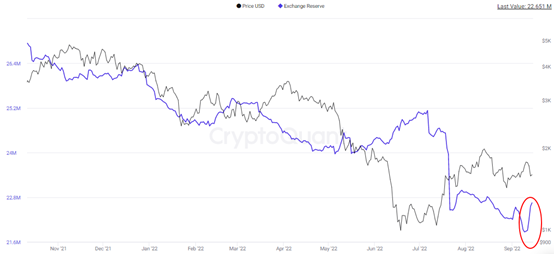
The number of ETHs flowing into the exchange increased significantly, from 21.86 million on September 9 to 22.65 million on September 14, an increase of 790000 ETHs, worth more than 1.3 billion dollars. Judging from the speed of ETH flowing into the exchange, it may be the fastest inflow performance in the year. Therefore, for the growth of selling pressure, investors in short-term trading can pay attention to the pace of price adjustment.