

Zain-ab-cryto
2023/12/21 19:23
Ethereum Price Prediction: As Former Goldman Sachs

The Ethereum price jumped more than 4% over the past 24 hours to trade at $2,260 as of 8:45 am EST as investors scoop up the leading altcoin.
This positive movement by ETH could be an early confirmation of a prediction made by Macro guru and Real Vision CEO Raoul Pal. In an X thread, the former Goldman Sachs executive stated that cryptos are set for a new bull market as traditional finance firms begin to enter the digital asset space, helping boost the entire Ethereum economy.
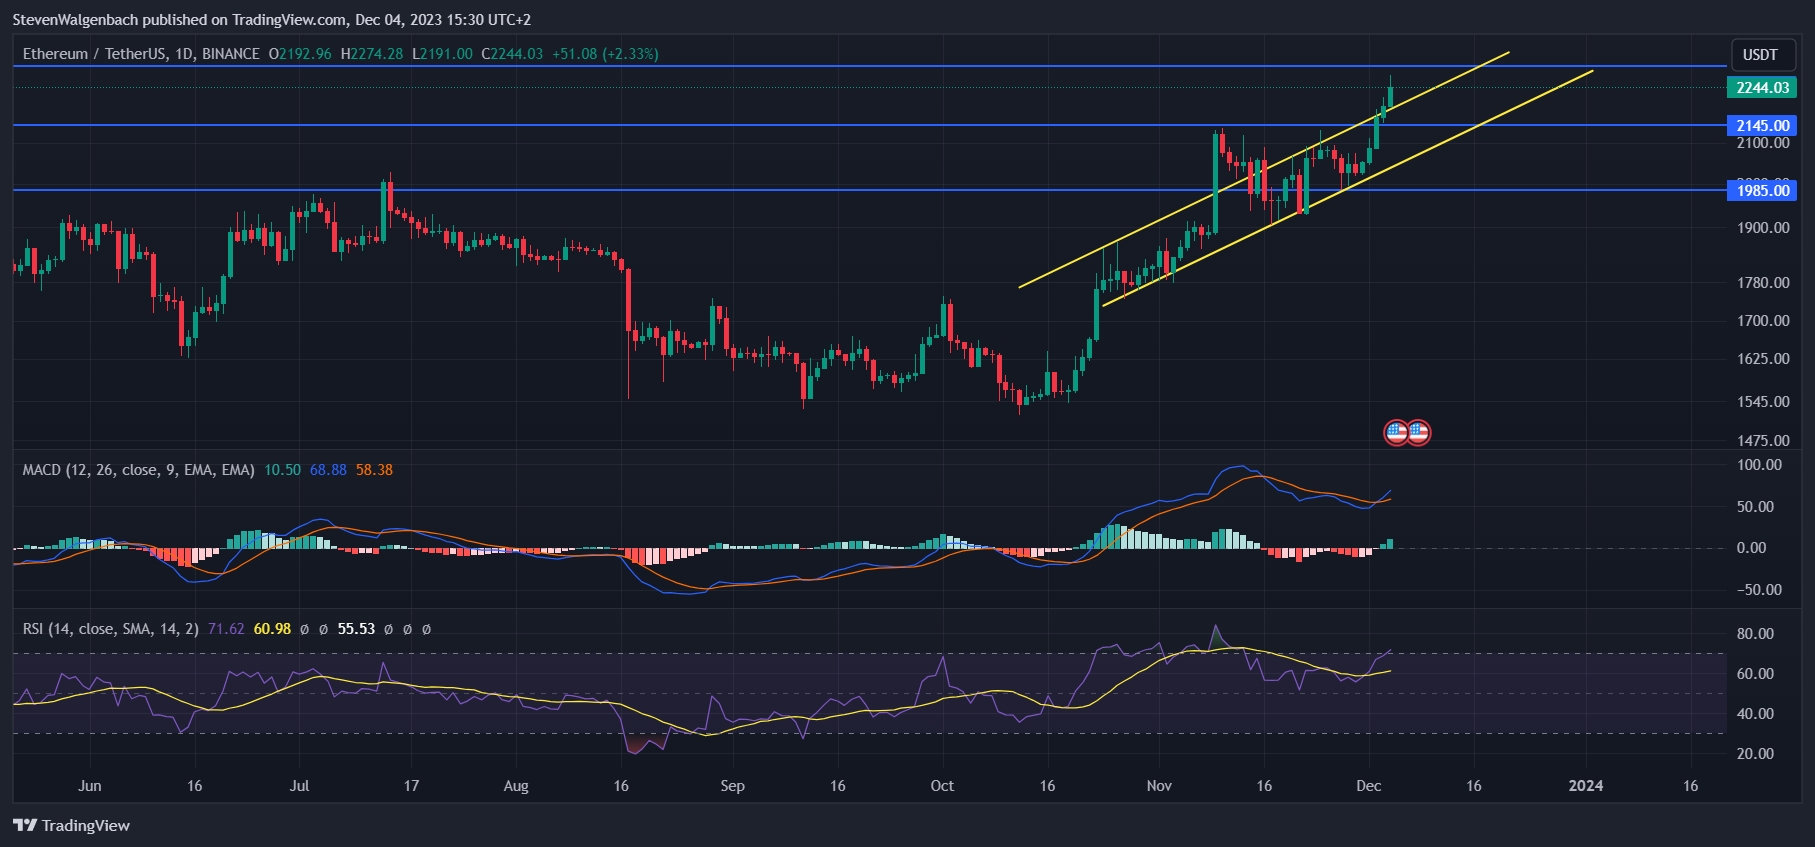
The Ethereum price broke above a medium-term positive price channel formed on its daily chart over the past few weeks. It may have the bullish support needed to rise to the next major resistance level if it closes today’s daily candle outside of this channel. In this scenario, the leading altcoin could attempt to flip the $2,300 resistance level into support before continuing its upward trajectory.
This bullish thesis may be invalidated if ETH closes today’s trading session within the positive price channel. In this slightly less bullish scenario, the Ethereum price could return to the immediate support level at $2,145 in the following days. Given the strong ascending price channel, this correction may be brief, and the Ethereum price may resume its climb.
ETH may drop below the $2.145 support if traders attempt to offload some of their ETH holdings while the Ethereum price rests on this key level. This may expose the cryptocurrency to the risk of correcting the subsequent mark of $1,985 in the short term.
Ethereum Price Supported By Favorable Technical Indicators
Technical indicators, however, suggested that the Ethereum price may remain on its upward trajectory for the coming 48 hours. The Moving Average Convergence Divergence (MACD) and Relative Strength Index (RSI) indicators supported a bullish outlook.
Buyers currently have the upper hand against sellers on ETH’s daily chart, as indicated by the RSI line positioned above the RSI Simple Moving Average (SMA) line. With this, the MACD line is above the MACD Signal line. This specific technical occurrence may be seen as an indication of a short-term continuation of ETH’s bullish trend.
#MUSIC x HTX Year-end Creation#Hit March's Interaction Leaderboard#Share Your Shark Fin Subscriptions
3Partager
Tous les commentaires0RécentPopulaire
Pas de données