B3bit
06/16 14:43Haussier
Bitcoin Price Prediction: The Market That Grew Up
#World Cup Predictions: 100,000 USDT Daily #BTC Prophet: 20-Day 380 Million HTX Challenge #HTX Creation Challenge — Post and Win 1,500U 💥
Bitcoin Price Prediction: The Market That Grew Up And Left The Old Cycle Behind
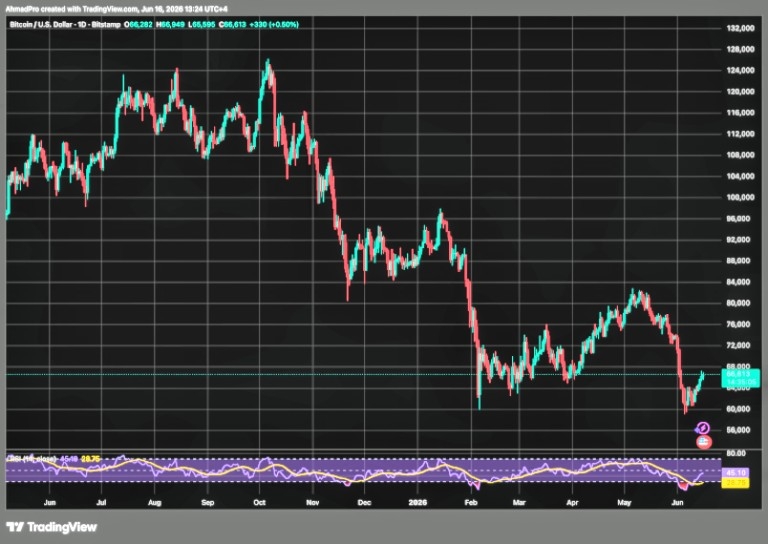
What the daily chart shows right now is that Bitcoin is at $66,518, sitting on a ledge with real historical weight. Zoom out on this particular chart and you can see the full story, the 2024 breakout, the run to $126,000, the long unwind, the failed March recovery that stalled at $82,000, and then the most recent flush to $60,000 before the current bounce.
Price has now reclaimed the same $65,000 to $68,000 zone that served as a critical breakout level back in 2024, and the question of whether it holds as support or breaks as a trap is the most important technical question on this chart right now.
The $70,000 to $72,000 level is the first real test above, where the May breakdown began and where a significant amount of trapped supply sits.
Clearing that zone on volume would change the tone of this chart considerably, opening sight lines toward $80,000 and eventually the $92,000 to $98,000 range Gemini targets. Losing $62,000 on a daily close reopens the path toward $54,000, the top end of the bear case floor.
The RSI is the detail that cuts through the noise most cleanly. It sits at 44.75 with the signal line well below at 28.73, a gap of 16 points.
That divergence tells a specific story. Momentum was crushed to deeply oversold levels during the recent flush, and has since recovered aggressively back toward neutral while price is still finding its footing. RSI leading price in recovery is the better version of this setup, the pattern that tends to precede sustained bounces rather than bull traps.
4Partager
Tous les commentaires0RécentPopulaire