

Crypto Queen Analist
11/13 15:02
Solana price faces decline amid negative technical
Solana price faces decline amid negative technical indicators despite SOL ETF flows
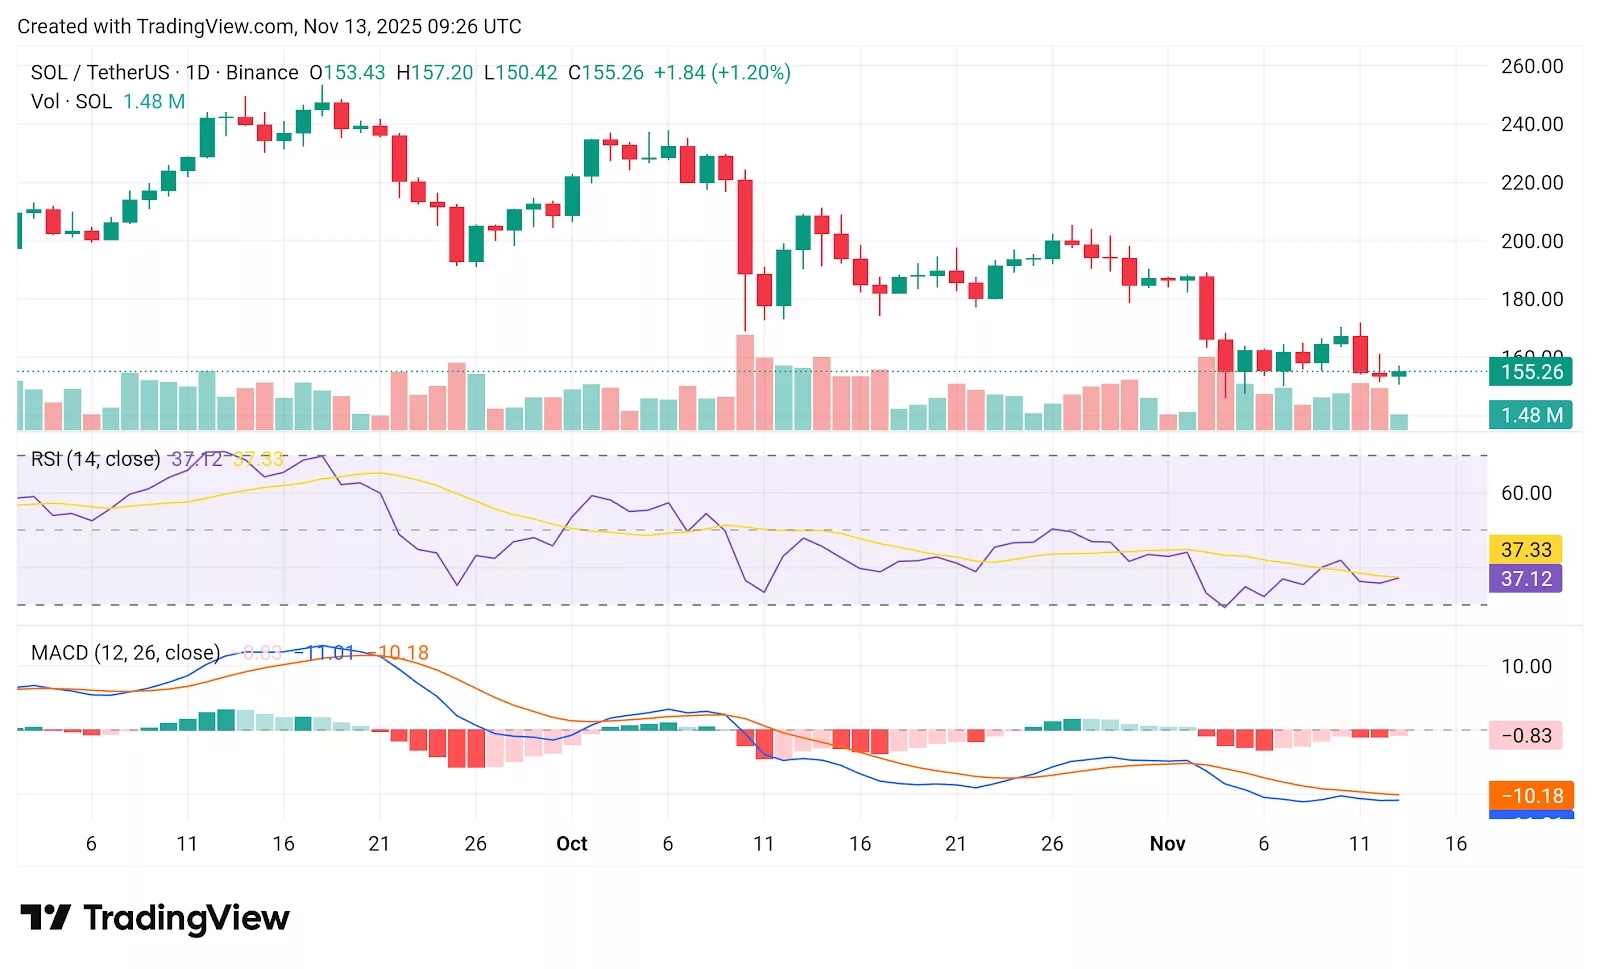
On the charts, SOL is consolidating in a tight range between $150 and $162, and a decisive move outside this zone will likely define the next trend. However, technical indicators are currently bearish.
The RSI at 37.12 shows weak momentum, still under the 50-neutral zone, with no clear bullish reversal signal yet. MACD also remains in bearish territory, with the signal line below zero and histogram bars in the red.
For an uptrend to occur, the RSI has to surpass the 50 mark. Going forward, Solana price has a short-term support at $150.42, which has held up across the last three sessions.
If that level breaks, downside pressure could test the lower support at around $142. On the upside, the immediate resistance lies at $162, and a stronger breakout would need to reclaim $173 to shift short-term sentiment bullish.
Tous les commentaires0RécentPopulaire
Pas de données