bit999
07/08 10:04
Technical Indicators Show Improving Momentum
Technical Indicators Show Improving Momentum
Recent technical indicators continue to support the bullish setup. The daily close at $0.884 remains above the midline of the Bollinger Bands, which is currently near $0.820. The widening of the bands suggests a potential volatility expansion, often a precursor to a more sustained directional move. Immediate resistance stands at the upper band around $0.946, while $0.694 remains the lower band support.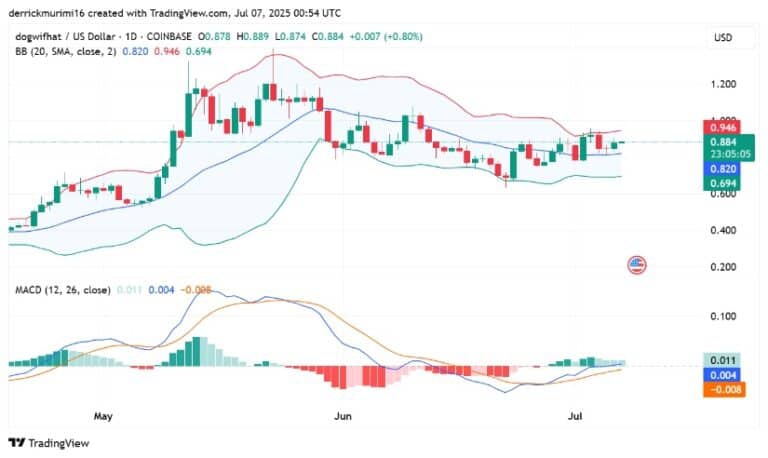
The MACD (Moving Average Convergence Divergence) indicator has printed a bullish crossover, with the MACD line rising above the signal line. Histogram bars have turned green and are gradually increasing, indicating strengthening momentum.
This crossover follows weeks of waning bearish pressure and suggests that the prior downtrend may be reversing. Traders are now watching whether daily closes can remain above $0.85, with volume and MACD trends offering insight into whether WIF is positioned to retest and potentially surpass the psychological $1.00 mark.
Tous les commentaires0RécentPopulaire