

Sharoo khan
2024/11/15 15:12
Bonk Technical Analysis. The daily chart for BONK
Bonk Technical Analysis.
The daily chart for BONK shows that the price has broken out of the triangle formation following Trump’s victory. The price is approaching the record level, and a break above this level could initiate a price surge. The breakout from the triangle pattern is accompanied by a solid bullish formation, showing a rounding bottom in September. This bullish pattern indicates upward momentum in BONK’s price. A break above $0.00004756 will initiate a strong move higher.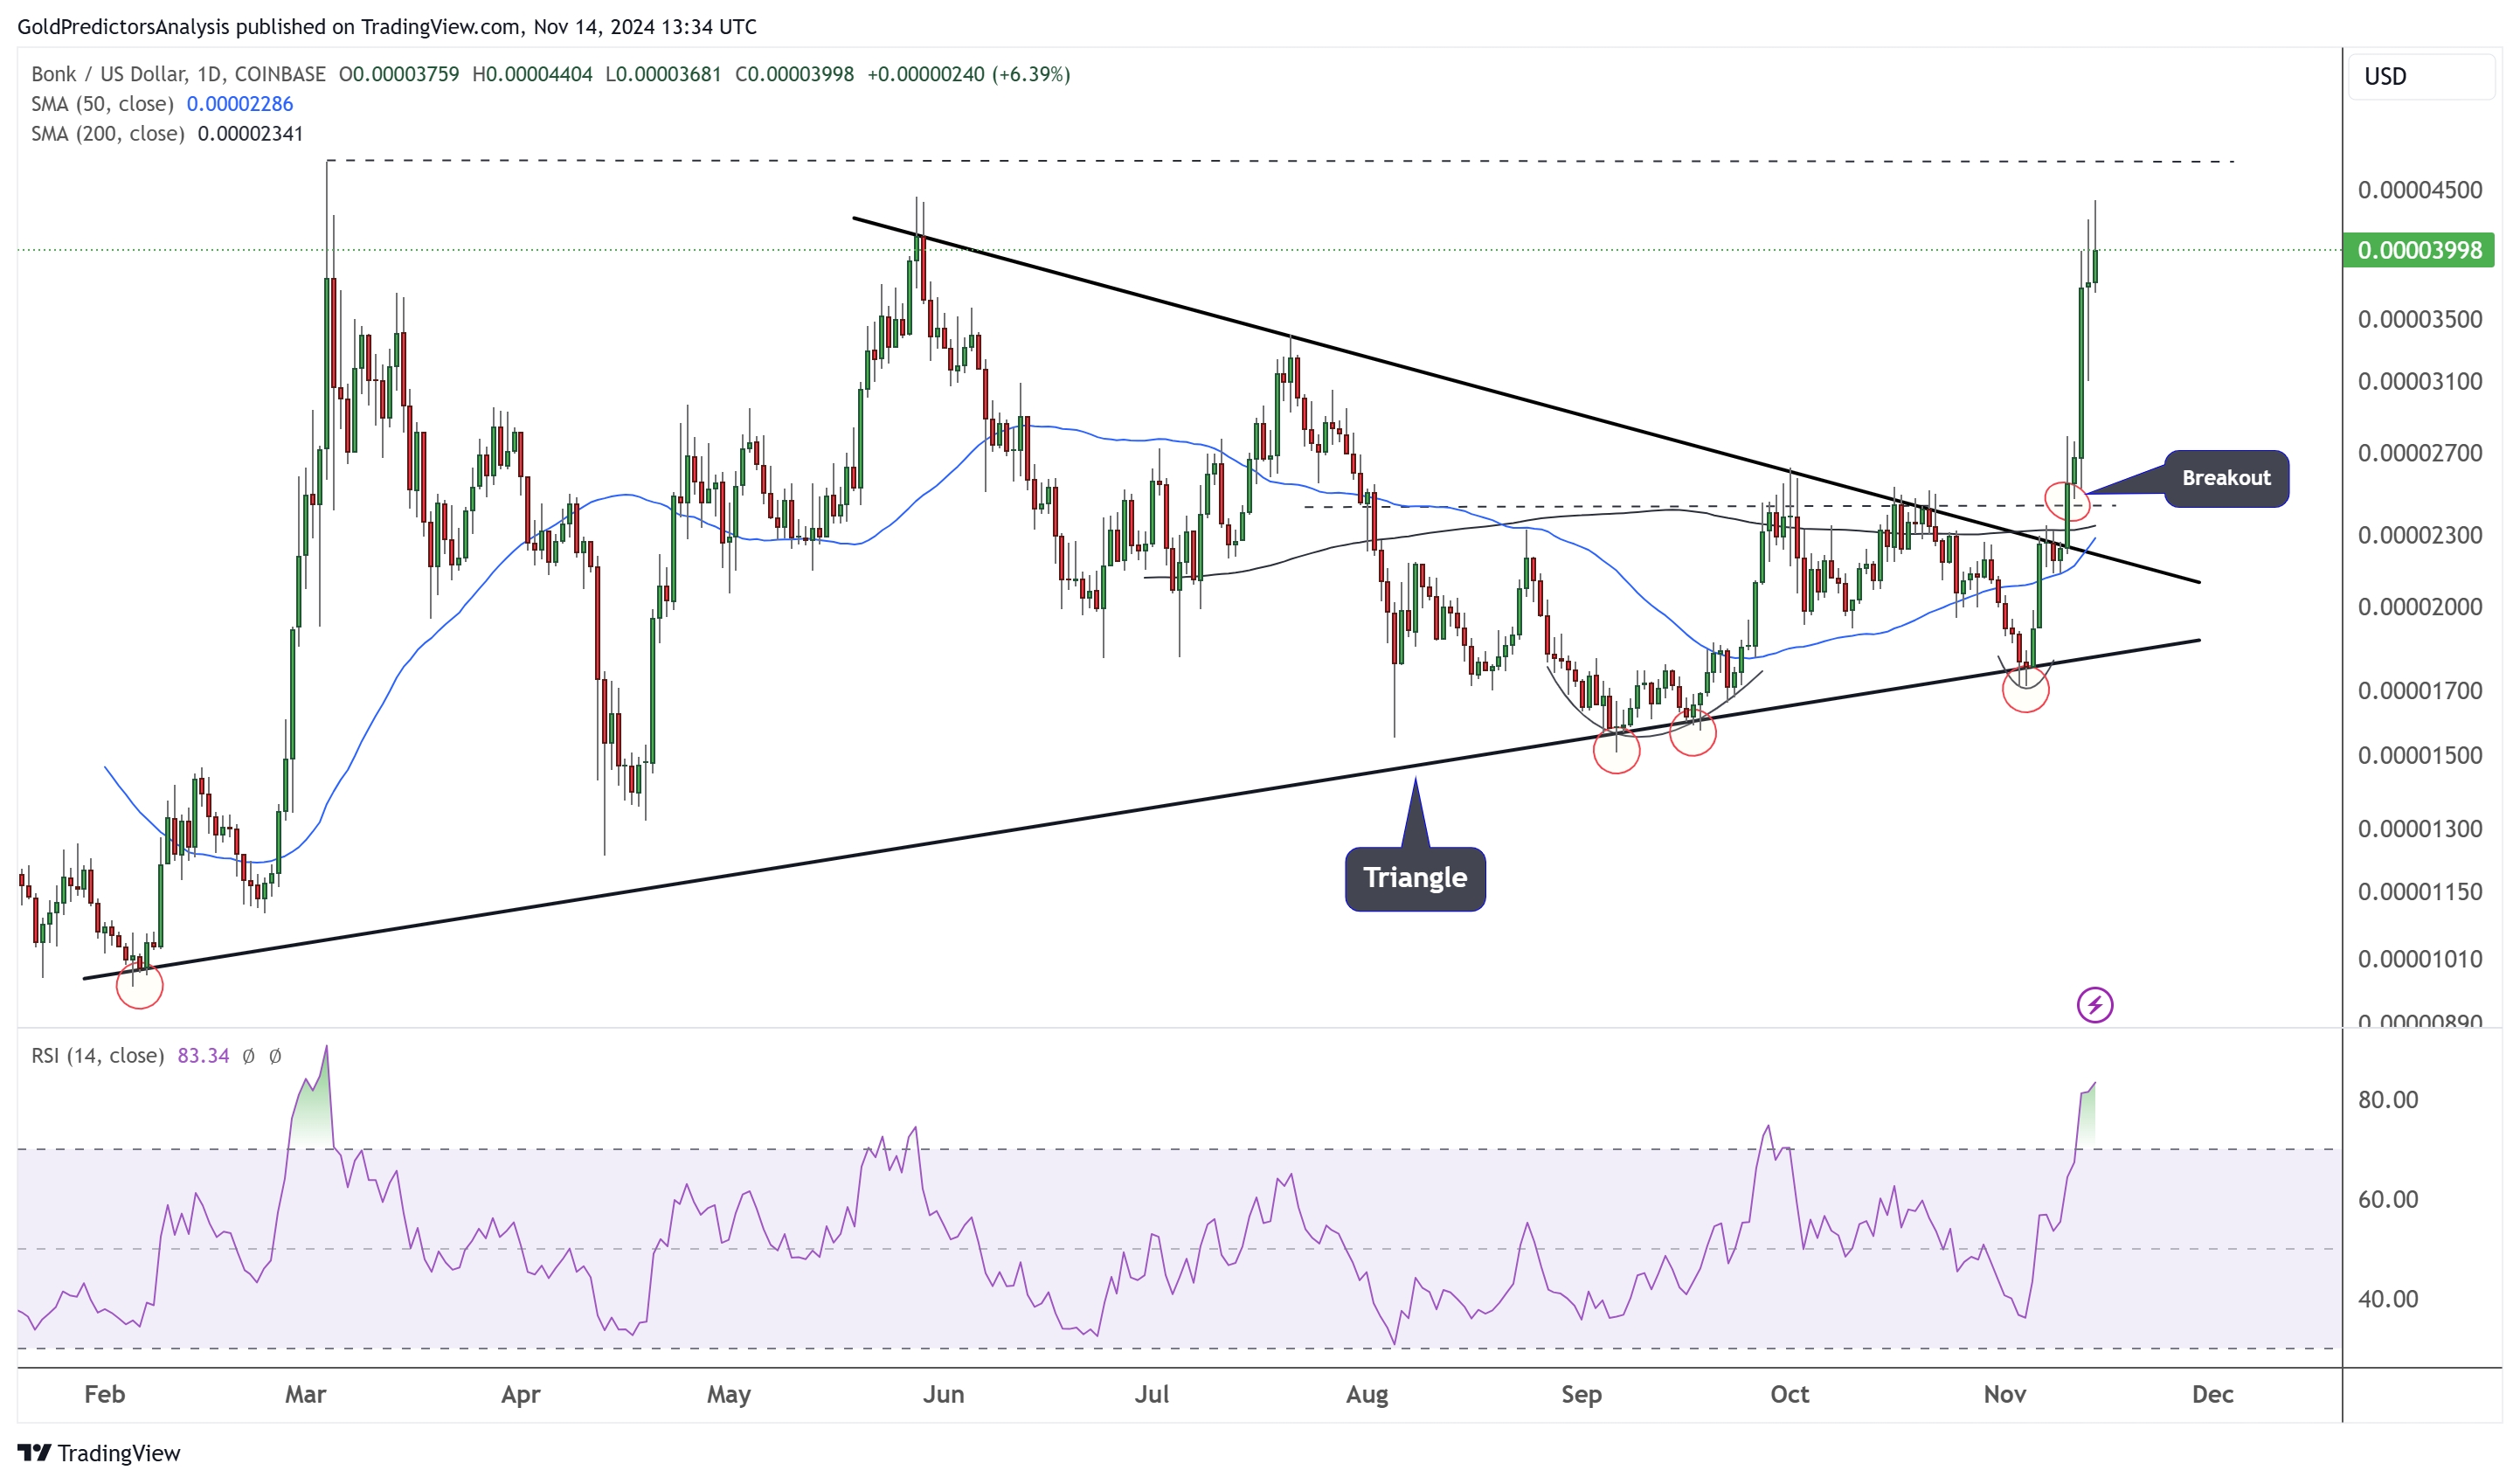
#Share Your Thoughts on Popular Assets in March#Tariffs Crash Crypto#Hit March's Interaction Leaderboard
4Paylaş
Tüm Yorumlar0En yeniPopüler
Kayıt yok