

crypto analysis
07/16 01:04
Mapping the potential XLM retracement
Mapping the potential XLM retracement.
Based on the recent rally from $0.216 to $0.516, a set of Fibonacci retracement levels (white) were plotted. On the higher timeframes, the XLM structure was firmly bullish.
Even a retracement as deep as $0.28 would maintain the bullish weekly structure. However, it did not seem likely that the dip would extend that far.
The prime suspect for the next demand zone was the highs set in February at $0.364. This area coincided with the 50% retracement level of the recent rally. Therefore, traders can wait for a dip before buying.
The technical indicators on the daily timeframe did not show a pullback was imminent. The A/D soared higher to set new highs, reflecting intense demand in recent days.
The CMF also showed remarkable capital inflow recently, with a reading well above +0.05.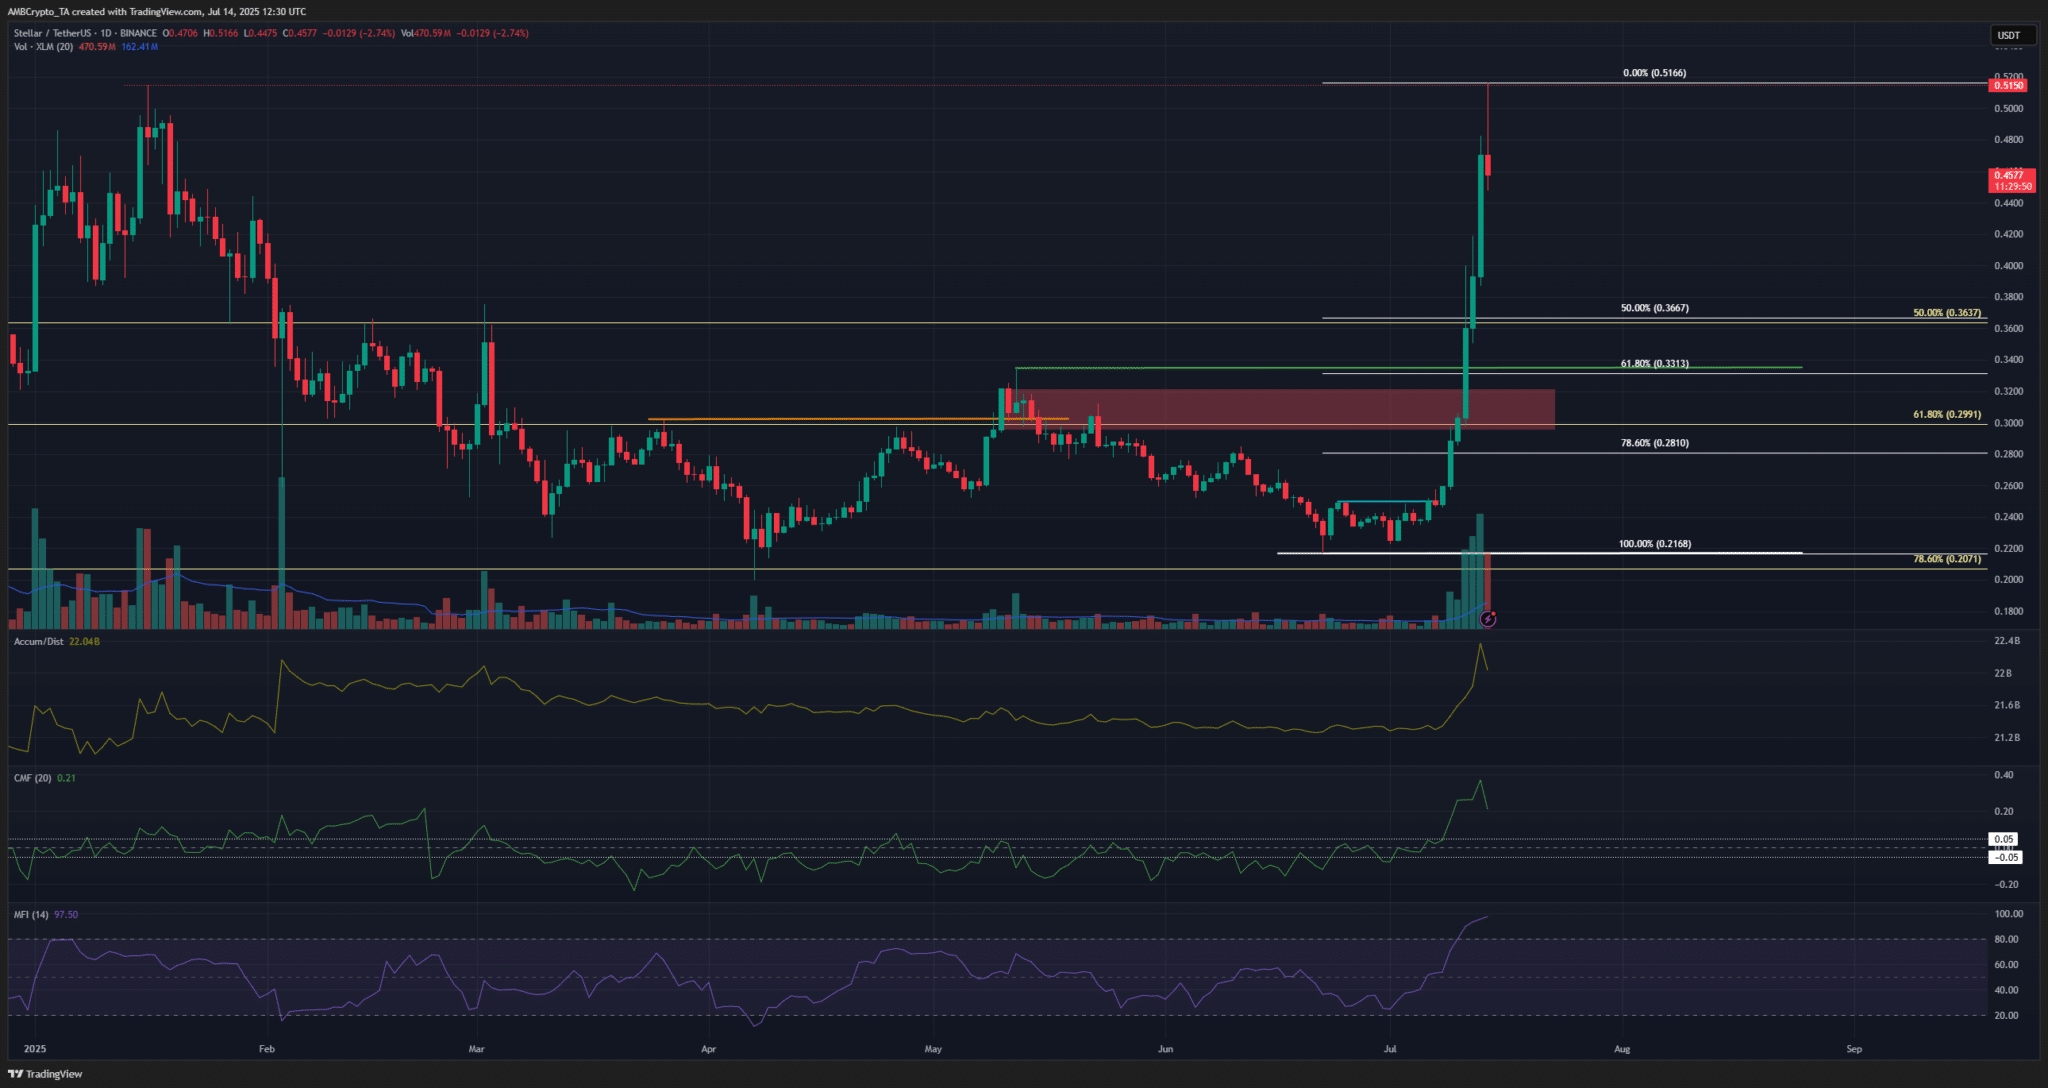
#HTX 12th-Anniversary Carnival#Check In Weekly, Win Prizes Weekly — Join the Fun!#Claim1,200 USDT in the Monthly Creation Challenge#Do you think DELOREAN is promising?#Trump family backs TRON's US listing
30Condividi
Tutti i commenti0RecentePopolare
Nessuno storico