

Naina
07/15 16:46
XLM Chart Signals Continued Rally Toward $0.80 Th
XLM Chart Signals Continued Rally Toward $0.80
The technical chart presented by market observer BigMike7335 shows a bullish formation in XLM. There is a higher highs and higher lows structure in this chart, likely on a 4-hour or daily chart, showing a traditional uptrend.
There is a breakout using a large green candle with increased trade volumes, confirming market sentiment. Even more relevant, there is a potential golden cross in the works, a situation in which a shorter-term moving average breaks above a longer-term one, typically bullish.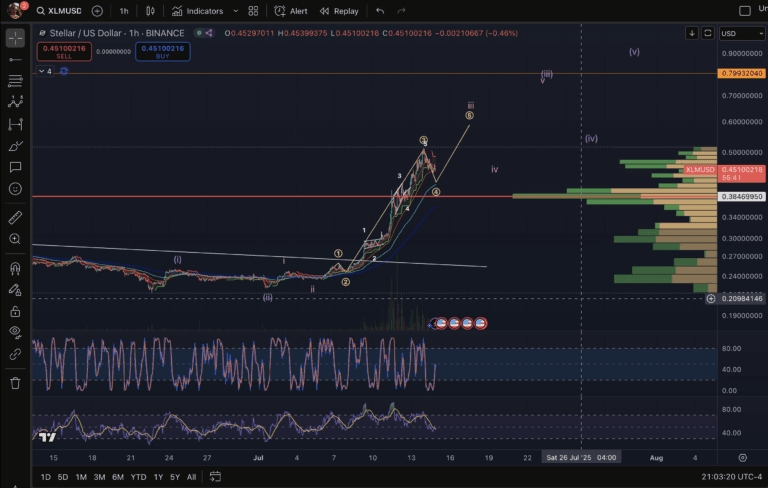
#Claim1,200 USDT in the Monthly Creation Challenge#Do you think DELOREAN is promising?#Do you think ANIME is promising?#Trump family backs TRON's US listing
2Paylaş
Tüm Yorumlar0En yeniPopüler
Kayıt yok