

Babes
07/15 15:22
ALGO price, 50-day and 100-day SMA chart — July 15
ALGO price, 50-day and 100-day SMA chart — July 15.
In a July 15 X post, crypto analyst Ali Martinez noted that ALGO appears to be trading within a multi-month parallel channel. A decisive breakout from this formation could mark the beginning of a larger bullish wave, potentially paving the way for further price appreciation in the weeks ahead.
According to Martinez, a breakout from the pattern will be confirmed if the ALGO price retests the breakout zone around $0.258. The analyst has set loftier price targets as high as $0.42, which stands 55% above the current price level at the time of writing.
From a technical perspective, ALGO has also formed a bullish double-bottom pattern on the daily chart, with a confirmed breakout above the neckline at $0.2604. The price has also moved decisively above the 50-day and 100-day Exponential Moving Averages, further validating the trend reversal.
Simultaneously, momentum indicators like the Relative Strength Index and the MACD were all pointed upwards at press time.
If ALGO breaks through the immediate resistance at $0.32, the next target lies at the 61.8% Fibonacci retracement level of $0.3642.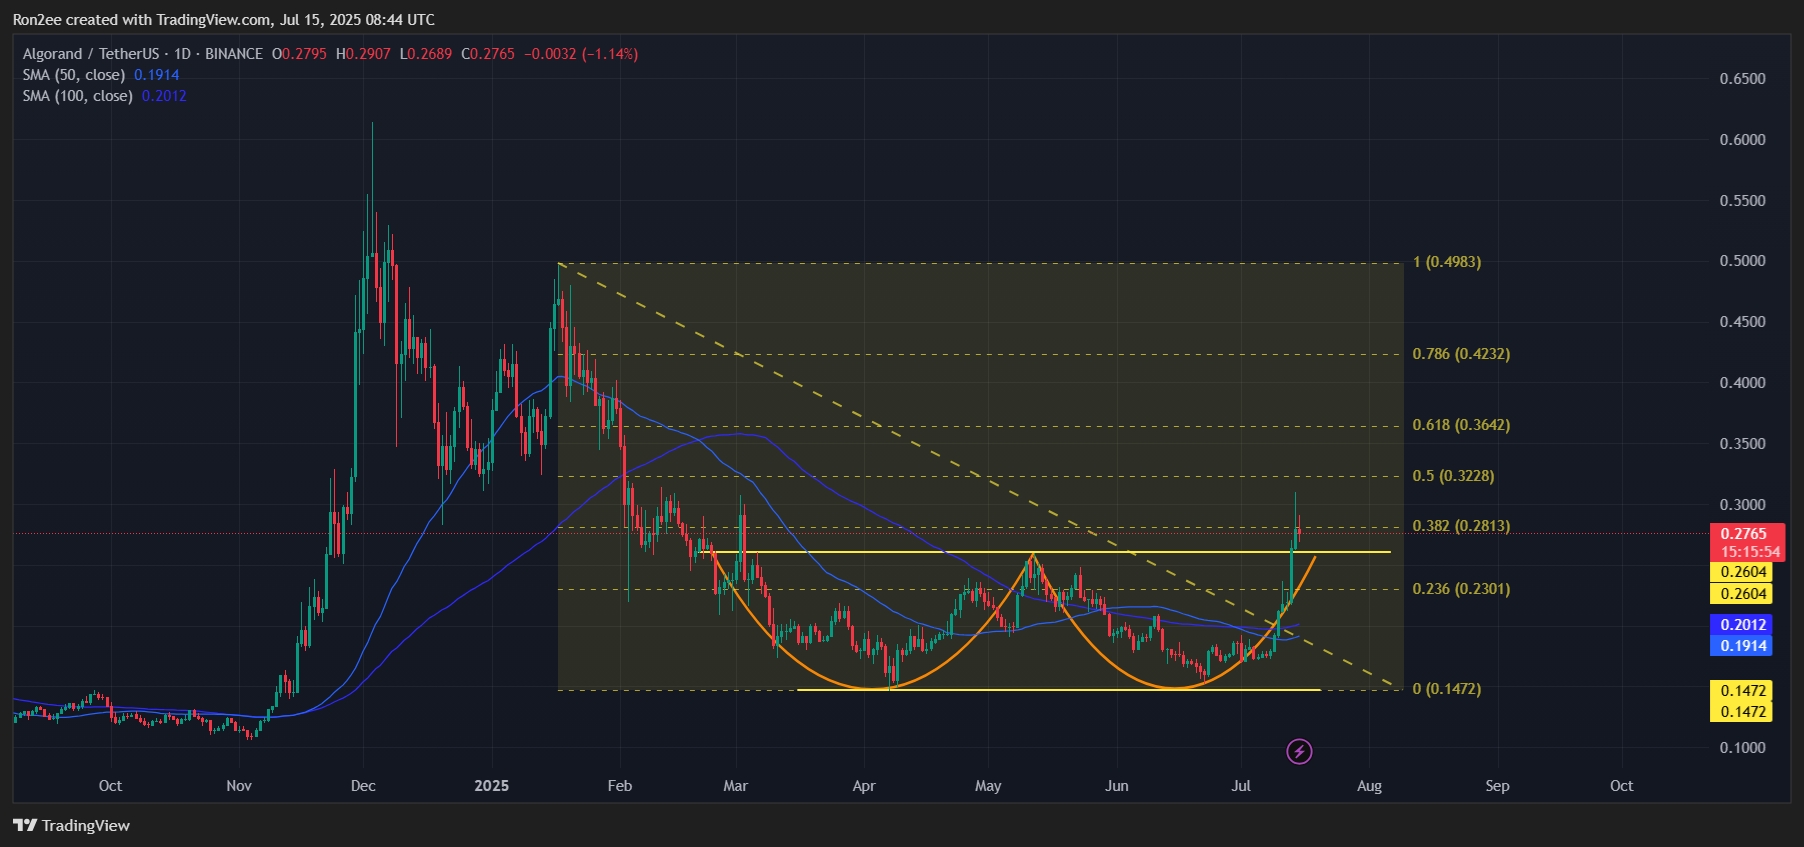
#HTX 12th-Anniversary Carnival#BTC price hits a new high of $120,000! #Check In Weekly, Win Prizes Weekly — Join the Fun!#Do you think NEWT is promising?#Do you think DELOREAN is promising?
2Condividi
Tutti i commenti0RecentePopolare
Nessuno storico