

Crypto Express
07/10 15:16
POL : No light at the end of the tunnel?
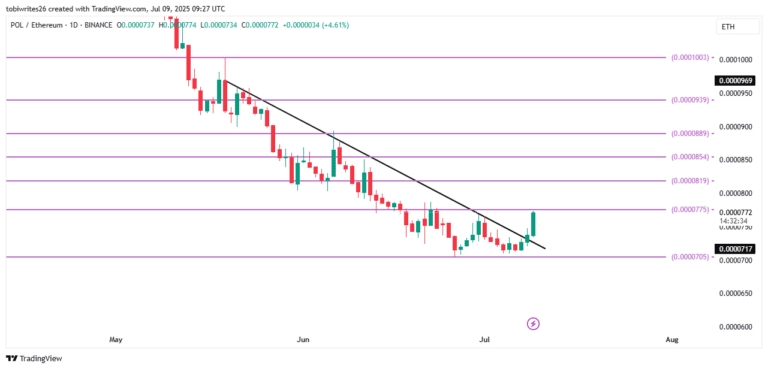
The POL/ETH chart, which tracks fund flows between the two tokens, revealed that POL attracted more capital during its price rally.
Interestingly, this northbound move coincided with a breakout from a descending channel – A typically bullish pattern. In previous instances, POL has rallied to the top of this pattern near $0.0000969 on the charts.
However, the Fibonacci retracement levels highlighted multiple resistance zones that could hinder further gains. A key resistance lay at $0.0000775 – A level that POL must overcome to maintain its upside on the charts.
Previously, the price action at this Fibonacci level has resulted in a sharp rejection, dragging POL/ETH to its recent low towards the end of June.
A similar rejection could lead to range-bound trading between $0.0000775 as resistance and $0.0000705 as support.
#Check In Weekly, Win Prizes Weekly — Join the Fun!#Claim1,200 USDT in the Monthly Creation Challenge#Share Your Thoughts on Popular Assets in June
76Paylaş
Tüm Yorumlar0En yeniPopüler
Kayıt yok