Meerab
06/21 06:03
The biggest rise in the ONDO price was when donl
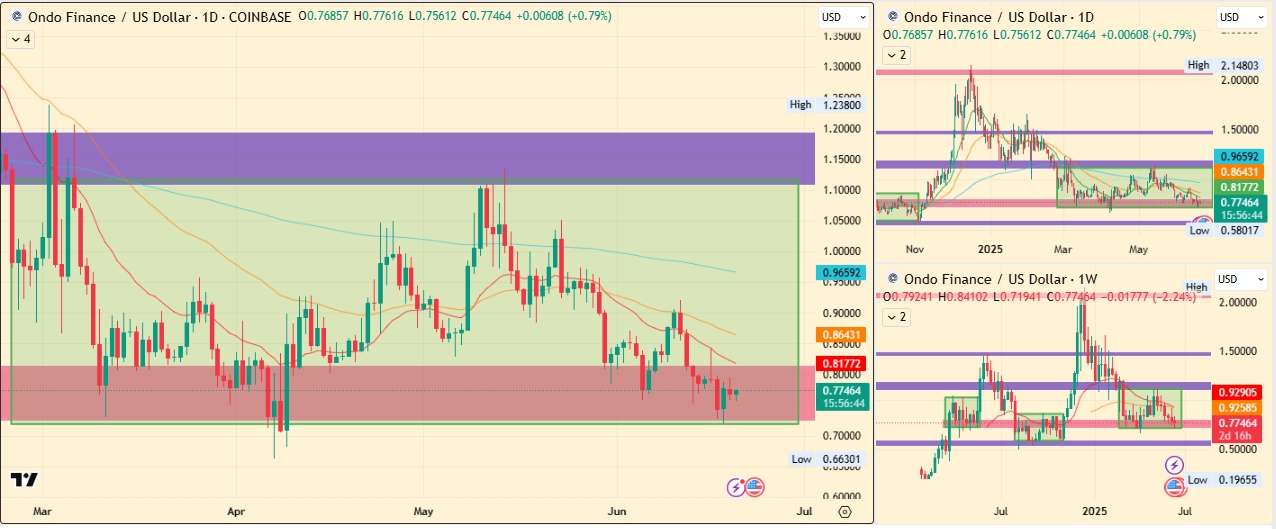
The biggest rise in the ONDO price was when donlad trump won the election last year, hitting $2.148 by mid-December on Coinbase. Since then, it has continuously declined, and by April 2024, it fell to a low of $0.70.
In the entire Q2, it has seen its price action trapped in a range, despite being a leading performer in tokenized RWA’s based on Coingecko’s report recently.
In Q2, many were anticipating that this altcoin could gain significant traction like last year’s first half movement, but met with a strong supply level mid-May and declined.
By June third week it is down over 30% with major selling pulling it down to a multi-month support, and on zooming out a little, it shows that from 2024’s high, it is down over 65%.
On zooming out to the weekly macro chart, it shows a key finding that highlights that the longer it coils in a range, the longer the breakout becomes. Year 2024’s fascinating price action is evident of that, and also the chart shows the key support is strong.
This makes the situation optimistic ahead, as institutional collaborations increased, so has retail adoption. However, the external factors like the FOMC decision and the ongoing geopolitical situation are assumed to be suppressing the current momentum.
Once the situation eases and the ONDO price shows a reversal in the short term by clearing the 50-day EMA band and $0.90 mark, then a target of $1.20 could be within reach by June or July.
Also, in the long term,if short-term makes a daily close above $1.20, then in the long term it would lead towards the retest of $2.05 by year-end.
However, if the macro range lower border, which also aligns with multi-month support, is breached, then support would be $0.66 and $0.45, where bulls could join.
YearPotential LowPotential AveragePotential High2025$0.80$1.20$2.05
#Share Your Thoughts on Popular Assets in June#Check In to Win a 20g Gold Bar#Claim1,200 USDT in the Monthly Creation Challenge#Do you think LISTA is promising?#Do you think FB is promising?
1Compartir
Todos los comentarios0Lo más recientePopular