

Bit360
06/17 09:52
Chart Analysis: Key Support and Resistance Levels
Chart Analysis: Key Support and Resistance Levels
The chart shows Bitcoin moving through multiple well-defined zones. Each level plays an important role in the current price behavior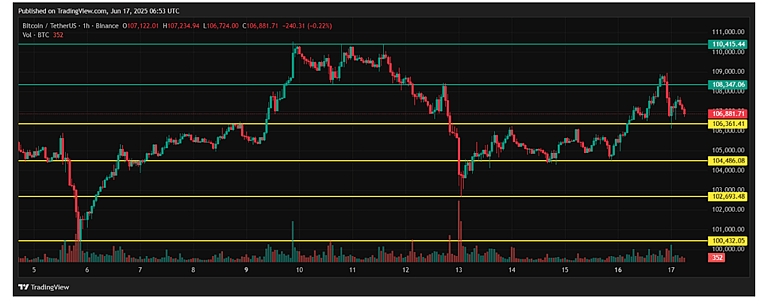
Immediate Resistance Levels
$110,415 – Strong upper resistance where previous rallies stalled. Sellers become active around this zone, causing price rejection.
$108,347 – Intermediate resistance. Bitcoin faced difficulty breaking and holding above this level during recent attempts. This zone remains important for bullish continuation.
#Share Your Thoughts on Popular Assets in June#Check In Weekly, Win Prizes Weekly — Join the Fun!#Claim1,200 USDT in the Monthly Creation Challenge
19Condividi
Tutti i commenti0RecentePopolare
Nessuno storico