usm****@gmail.com
06/08 06:36
Bitcoin Price Watch:
At 8 a.m. Eastern time, bitcoin is trading at $104,881 to $105,266 over the past hour, with a market capitalization of $2.08 trillion and a 24-hour trading volume of $24.93 billion. The 24-hour intraday price range spanned from $103,655 to $105,213, reflecting a tightly wound consolidation phase ahead of a potential breakout.
Bitcoin
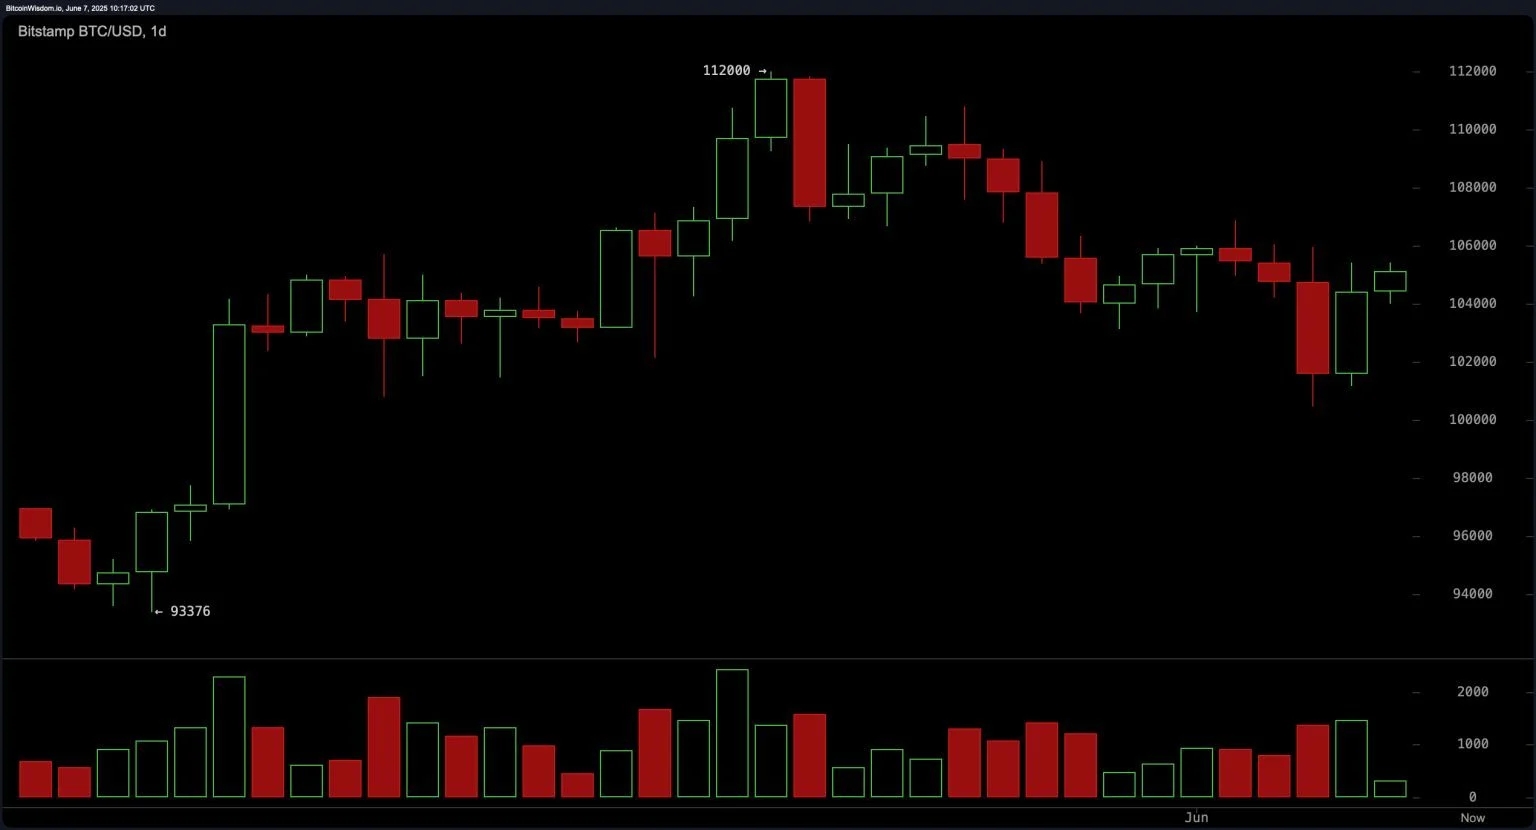
The daily chart indicates that bitcoin is in a consolidation phase after peaking near $112,000. This level formed a double top, which triggered a pullback toward the psychological support at $100,000. Despite this decline, the support structure remains intact, with notable buy interest re-emerging near $102,000. Oscillators on the daily timeframe paint a mixed picture, with the relative strength index (RSI) at 52 and the commodity channel index (CCI) at -59, both signaling neutral momentum.
(A bearish engulfing pattern, however, continues to weigh on sentiment, even as the declining volume suggests that selling pressure may be weakening.
In the intermediate term, the 4-hour bitcoin chart reveals a dynamic rebound. Following a sharp correction to $100,426 after being rejected near $106,854, bitcoin swiftly recovered to the $105,000 range. The resurgence was supported by a green volume spike, pointing to strong dip-buying activity. Currently, bitcoin appears to be forming a bullish flag or pennant pattern just below resistance. A breakout above $105,500 with substantial volume could open the door toward the $107,000 level, while failure to sustain above $102,000 would threaten deeper retracement.
#Share Your Thoughts on Popular Assets in June#Do you think LA is promising?#New Listings on HTX
1Partilhar
Todos os comentários0Mais recentePopular