Year Of The Underdog: Why Dogecoin Is On The Verge Of A Major Recovery

bitcoinistPublicado a 2026-02-28Actualizado a 2026-02-28

Resumen

Despite a brutal price decline, trading below $0.10 and down over 86% from its all-time high, Dogecoin shows strong on-chain signals suggesting a major recovery may be imminent. Network activity is surging, as daily active addresses recently spiked to nearly 58,000, and average address activity has grown significantly year-to-date. Dogecoin now ranks third among Proof-of-Work blockchains by active addresses. Derivatives data reveals overwhelmingly bullish sentiment, with high long/short ratios on major exchanges like Binance and OKX. The Taker Volume Ratio recently climbed to 63%, indicating strong buying pressure, while the Profit-Days metric has surpassed 1,100 for the first time—a historical indicator that has previously preceded parabolic price runs.

It has been a brutal few months for Dogecoin in terms of price action. At the time of writing, Dogecoin is trading just below $0.10, below all of its moving averages, and sitting more than 86% below its all-time high.

The price action looks bad for Dogecoin; however, a look at the on-chain data tells an entirely different story of resilience and network activity that’s being ignored. If history is any guide, this is exactly the kind of environment before a major recovery.

Dogecoin’s Network Growth

Price is often the last thing to move during rallies. Before any significant rally materializes, bullish sentiment tends to show up first in the data, and right now, Dogecoin’s network data is showing signs that demand serious attention. At the time of writing, daily active addresses are currently around 54,500, having recently spiked to nearly 58,000 this week.

Even more notable is the longer-term trend. As noted by crypto analyst PennybagsCX on X, average address activity has grown from 806,000 earlier in the year to above 1.05 million in recent readings. This growth is happening during a price dip, showing participants are choosing to engage with the network at a time when it would be easy to walk away.

For context, Dogecoin currently ranks third among all Proof-of-Work blockchains by 24-hour active addresses, commanding a 12% share of total PoW activity and outperforming blockchains like Dash and Bitcoin Cash.

Buyers Are Hunting, Long-Term Holders Holding

Derivatives’ positioning is also starting to tilt bullish. According to Coinglass’ long/short ratio data across Binance, OKX, and Bybit, retail traders are heavily positioned on the long side. On Binance, the retail long/short ratio stands at 2.29, while whale accounts show a ratio of 2.73, both indicating bullish sentiment. Whale positions on Binance also have a 1.94 long bias.

Retail positioning on OKX is more pronounced, with a long/short ratio of 3.49, categorized as extremely bullish. Whale accounts on OKX show a 1.61 ratio leaning bullish, although whale positions currently have a more cautious stance in open exposure at 0.79.

Source: Chart from Coinglass

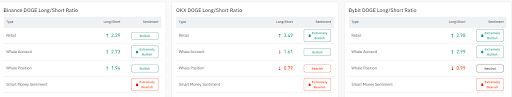
Bybit data shows similar optimism, with retail at 2.98 and whale accounts at 2.99 on the long side. Whale positions on Bybit are also close to neutral at 0.99, suggesting balanced positioning but not outright bearish pressure. The only note of caution in the data is Smart Money Sentiment, which reads as bearish across all three of the biggest Dogecoin exchanges.

Another telling signal has been the Taker Volume Ratio, which recently climbed to around 63%. This means traders executing market buy orders are dominating the activity. When the ratio moves above 50%, it means a stronger demand, as buyers are willing to pay prevailing prices.

Furthermore, Dogecoin’s Profit-Days metric has surpassed 1,100 for the first time in its history. This long-cycle indicator moves based on sustained profitability among holders. History shows that moves above 800 days are major turning points that were followed by parabolic runs in subsequent months.

DOGE trading at $0.09 on the 1D chart | Source: DOGEUSDT on Tradingview.com

Preguntas relacionadas

QWhat is the current price of Dogecoin and how does it compare to its all-time high?

AAt the time of writing, Dogecoin is trading just below $0.10, which is more than 86% below its all-time high.

QWhat on-chain metric is cited as a sign of resilience and growth for the Dogecoin network despite the price dip?

AThe growth in daily active addresses, which recently spiked to nearly 58,000 and has seen a longer-term increase in average address activity from 806,000 to over 1.05 million, is a key sign of resilience.

QAccording to the long/short ratio data, what is retail trader sentiment on major exchanges like Binance and OKX?

ARetail sentiment is heavily bullish. On Binance, the retail long/short ratio is 2.29, and on OKX, it is an extremely bullish 3.49.

QWhat does a Taker Volume Ratio above 50% indicate for Dogecoin?

AA Taker Volume Ratio above 50% indicates stronger demand, as it means traders executing market buy orders are dominating the activity and are willing to pay the prevailing prices.

QWhat is the significance of Dogecoin's Profit-Days metric surpassing 1,100 for the first time?

AThe Profit-Days metric is a long-cycle indicator based on sustained profitability among holders. History shows that moves above 800 days have been major turning points followed by parabolic price increases in subsequent months.

Lecturas Relacionadas

The Essence of AI Layoffs: Why More AI Adoption Leads to More Corporate Anxiety?

The author, awaiting potential inclusion on an 8000-person layoff list, analyzes the true nature of recent "AI-driven" layoffs. They argue that while AI use, particularly tools like Claude for code generation, has skyrocketed and boosted developer output (e.g., 2-5x more code commits), this has not translated into proportional business growth or revenue. The core issue is a misalignment between increased "Input" (code) and tangible "Outcomes" (user value, revenue). AI acts as a costly B2B SaaS, inflating operational expenses without guaranteed returns. Two key problems emerge: 1) The friction that once filtered out bad ideas is gone, as AI allows cheap pursuit of even weak concepts. 2) Organizational "alignment tax"—the difficulty of coordinating across teams—becomes crippling when development velocity outpaces consensus-building. Thus, layoffs serve two immediate purposes: 1) To offset ballooning AI costs (Token consumption) and maintain cash flow, as rising input costs without outcome growth destroys unit economics. 2) To reduce organizational bloat and alignment friction by simply removing teams, thereby speeding up execution in the short term. Therefore, these layoffs are fundamentally caused by AI, even if AI doesn't directly replace roles. They represent a painful correction until companies learn to convert AI-driven productivity into real business outcomes and streamline organizational coordination to match the new pace of work. The cycle will continue until this learning curve is mastered.

marsbitHace 7 min(s)

The Essence of AI Layoffs: Why More AI Adoption Leads to More Corporate Anxiety?

marsbitHace 7 min(s)

Can the Solana Foundation and Google's Collaboration on Pay.sh Bridge the Payment Link Between Web2 and Web3 in the Agent Economy?

Solana Foundation, in collaboration with Google Cloud, has launched Pay.sh, a payment gateway designed to bridge the gap between AI agents and enterprise-grade service infrastructure. The initiative aims to solve a key bottleneck in the "agent economy": existing payment systems are ill-suited for autonomous AI agents. Traditional methods like credit cards require human verification, while newer on-chain protocols like x402 and MPP create a separate, Web3-native system that raises barriers for service providers. Pay.sh functions as a universal payment layer. It allows users to fund a Solana wallet via credit card or stablecoin, which then acts as an identity and payment proxy for AI agents. When an agent needs to access a paid API service (e.g., Google Cloud, Alibaba Cloud), Pay.sh handles the transaction seamlessly. It leverages the HTTP 402 status code ("Payment Required") to initiate payments, intelligently choosing between one-time transfers (x402-style) or session-based authorizations (MPC-style) based on the service's billing model. This spares agents from manual account registration and API key management. A key feature for service providers is low integration effort. They can adopt Pay.sh by providing a declarative configuration file, enabling features like tiered pricing, free tiers, and automatic revenue splitting to multiple addresses (e.g., for royalties, cloud costs). Providers can also list their APIs in a central Pay Skill Registry for agent discovery. The collaboration with Google Cloud provides crucial infrastructure for API proxying, traffic routing, and compliance logging, aiming to keep agent activities within regulated boundaries. By connecting Web2 services with Web3 payment rails, Pay.sh positions the Solana wallet as a foundational identity and payment tool for AI agents, potentially driving more transaction volume to the Solana ecosystem. However, the report notes challenges. The service registry currently lacks robust vetting, risking exposure to unauthorized or malicious third-party APIs. Pay.sh also inherits security and compatibility risks from its underlying payment protocols (x402, MPC). Furthermore, adoption may be hindered by varying regional data privacy and payment compliance regulations among API providers. Despite these hurdles, Pay.sh represents a significant step towards integrating Web2 and Web3 for autonomous agent commerce.

marsbitHace 14 min(s)

Can the Solana Foundation and Google's Collaboration on Pay.sh Bridge the Payment Link Between Web2 and Web3 in the Agent Economy?

marsbitHace 14 min(s)

Bitcoin's Bull-Bear Cycle Indicator Turns Positive for the First Time in 7 Months: End of Bear Market or False Breakout?

Bitcoin's "Bull-Bear Market Cycle Indicator" from CryptoQuant has turned positive for the first time since October 2025. This gauge, based on the P&L Index relative to its 365-day moving average, suggests a potential shift from a bear market phase. Concurrently, the Bull Score Index rose to a neutral reading of 50 in late April. The indicator's move into positive territory follows a roughly 35% price rebound from a low near $60,000 in February to above $81,000. The recovery over approximately three months was faster than the 12-month period observed during the 2022 bear market. However, analysts caution against premature optimism, citing a historical precedent from March 2022. Back then, the Bull Score Index briefly hit 50, but it proved to be a false signal as Bitcoin's price subsequently plunged further. Structural differences exist in the current cycle, including consistent inflows into spot Bitcoin ETFs and an increase in large holder addresses. Yet, some models, referencing the four-year halving cycle, suggest a potential deeper bottom near $50,000 might still be possible around late 2026. In summary, while on-chain data shows marked improvement and the worst panic may be over, market participants remain cautious. A convincing trend reversal confirmation likely requires Bitcoin to sustainably break above key resistance, such as the 200-day moving average near $82,000.

marsbitHace 21 min(s)

Bitcoin's Bull-Bear Cycle Indicator Turns Positive for the First Time in 7 Months: End of Bear Market or False Breakout?

marsbitHace 21 min(s)

How to Automate Any Workflow with Claude Skills (Complete Tutorial)

This is a comprehensive guide to mastering Claude Skills, a feature for creating permanent, reusable instruction sets that automate specific workflows. Unlike simple saved prompts, Skills function like trained employees, delivering consistent, high-quality outputs by defining the entire task process, standards, error handling, and output format. The guide is structured in four phases: **Phase 1: Installation (5 minutes).** Skills are folders containing a `SKILL.md` file. The user is instructed to find a relevant Skill online, install it, test it on a real task, and compare its performance to one-off prompts. **Phase 2: Building Your First Custom Skill.** Start by rigorously defining the Skill's purpose, trigger phrases, and providing a concrete example of perfect output. The `SKILL.md` file has two parts: a YAML frontmatter with a specific name/description/triggers, and a detailed, step-by-step workflow written in natural language with examples and quality standards. **Phase 3: Testing & Optimization for Production.** Test the Skill in three scenarios: 1) a standard, common task; 2) edge cases with missing or conflicting data; and 3) a pressure test with maximum complexity. Any failure indicates a needed instruction. Implement a weekly optimization cycle to continuously refine the Skill based on real usage. **Phase 4: Building a Complete Skill Library.** The goal is to create a team of Skills for all repetitive tasks. Examples are given for industries like real estate, marketing, finance, consulting, and e-commerce. The user should list their tasks, prioritize them, and build one new Skill per week, maintaining a master document to track their library. The conclusion emphasizes the compounding time savings: ten Skills saving 30 minutes each per week reclaims over 260 hours (6.5 work weeks) per year, fundamentally transforming one's work system.

marsbitHace 45 min(s)

How to Automate Any Workflow with Claude Skills (Complete Tutorial)

marsbitHace 45 min(s)

Trading

Spot
Futuros
活动图片